An analytic review of eBay’s positioning across major LLM-driven marketplaces highlights niche dominance in collectibles and refurbished electronics, tempered by competitive gaps in logistics and wholesale segments against Amazon and Alibaba.
View ebay.com Full GEO (Generative Engine Optimization) Report
SpyderBot GEO report reference for ebay.com
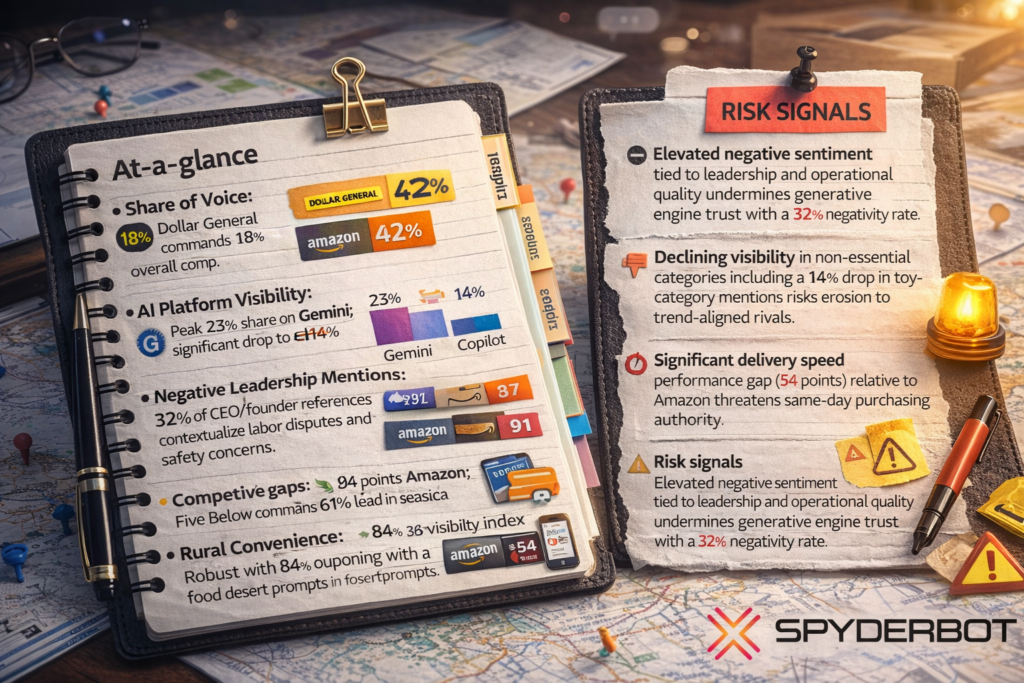
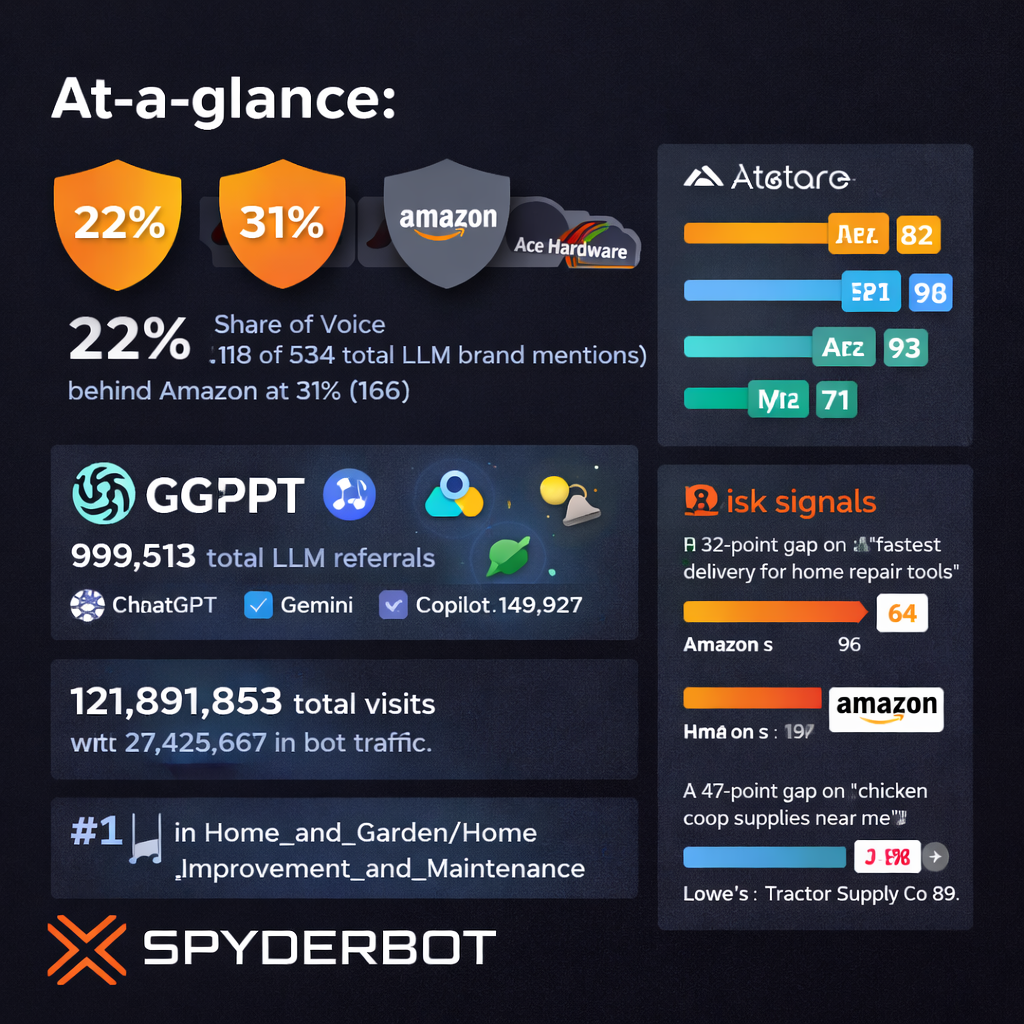
At-a-glance
- 25% Share of Voice in generative engine ecosystem
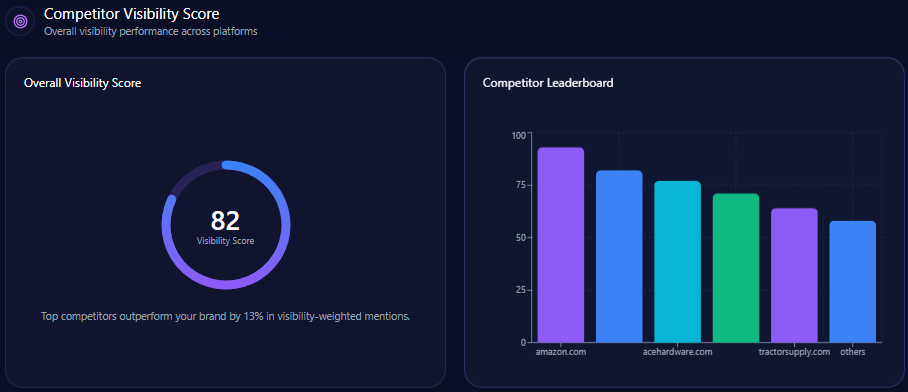
- 81 overall Visibility Score indicating durable brand recognition
- 89% niche coverage for high-intent queries in collectibles and refurbished electronics
- 26% share of voice leadership on Microsoft Copilot platform
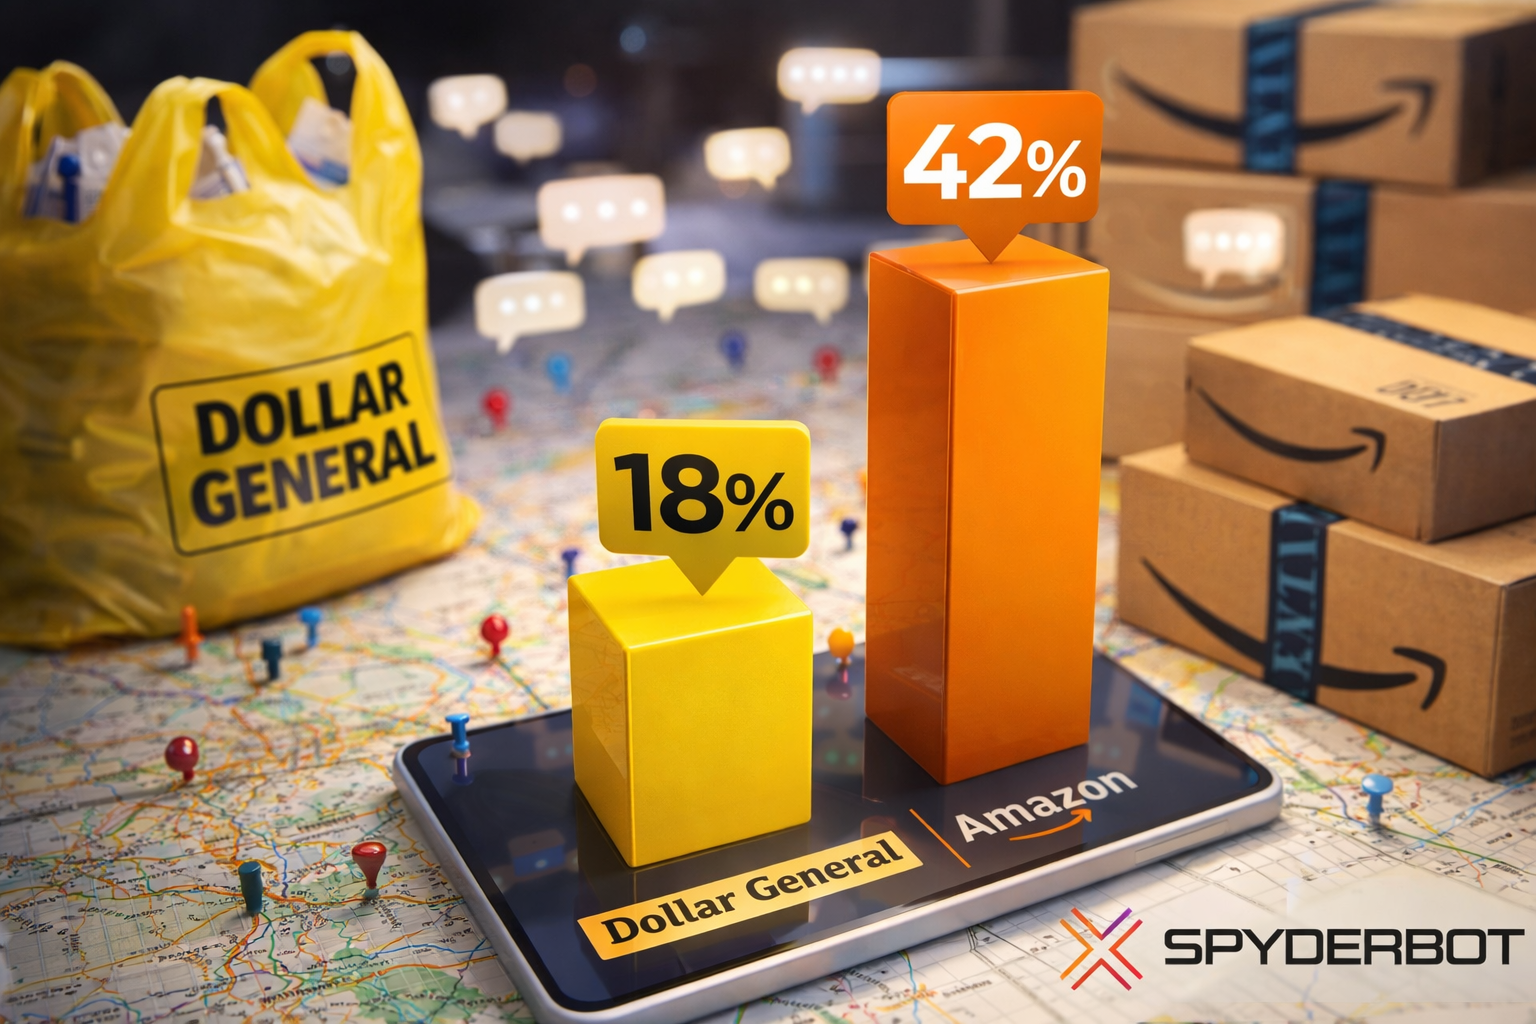
- 12% Share of Voice gap relative to Amazon in broad retail and logistics queries
- 23% visibility on Google Gemini reflecting under-indexing in citations
- 74% positive sentiment linked to Authentication Guarantee initiatives
- 12% negative sentiment drag influenced by rising seller fees and legacy UI friction
- 1,989,387 referrals driven by LLM brand mentions from key platforms including ChatGPT and Copilot
Risk signals
- Amazon commands a 37% mention share versus eBay’s 25% in LLM brand mentions, evidencing a significant competitive headwind.
- Visibility deficits on Google Gemini (23%) limit eBay’s authoritative reach in generative AI recommendation layers.
- Emerging competitor Mercari’s 24% surge in designer handbag visibility encroaches on niche segments critical to eBay’s market.
- Etsy’s dominance in handmade categories with a 47-point relevance lead further intensifies competitive pressure on artisan market share.
- Investment mention coverage at 41% trails Amazon’s 89%, signalling weaker generative engine resonance on growth narratives.

eBay’s generative AI presence translates into a significant but challenged platform footprint relative to dominant peers. With a solid 81 Visibility Score and a 25% Share of Voice across generative search environments, the brand demonstrates resilience in targeted categories such as collectibles and refurbished electronics. This positioning is consistent with eBay’s historic role as a curator of secondary market and vintage goods, which continues to underpin its validation in LLM brand mentions indexed across major AI toolsets.
However, these strengths coexist with substantive challenges. The platform encounters strategic gaps in logistics-intensive and wholesale segments where competitors Amazon and Alibaba command superior generative recommendation rankings. This dichotomy is emblematic of eBay’s positioning as a niche authority versus broader platform convenience, requiring deliberate technical and content optimizations to close visibility differentials, particularly on the Google Gemini platform where eBay’s 23% visibility markedly trails Amazon’s benchmark.
Analyses of competitive sentiment profiles reveal positive associations to niche value propositions such as the Authentication Guarantee that drives a 74% positive sentiment across key generative systems. Yet, there exists a 12% negative sentiment influence driven by rising seller fees and user interface friction, which threatens to undermine user loyalty and transaction volume growth in the medium term.
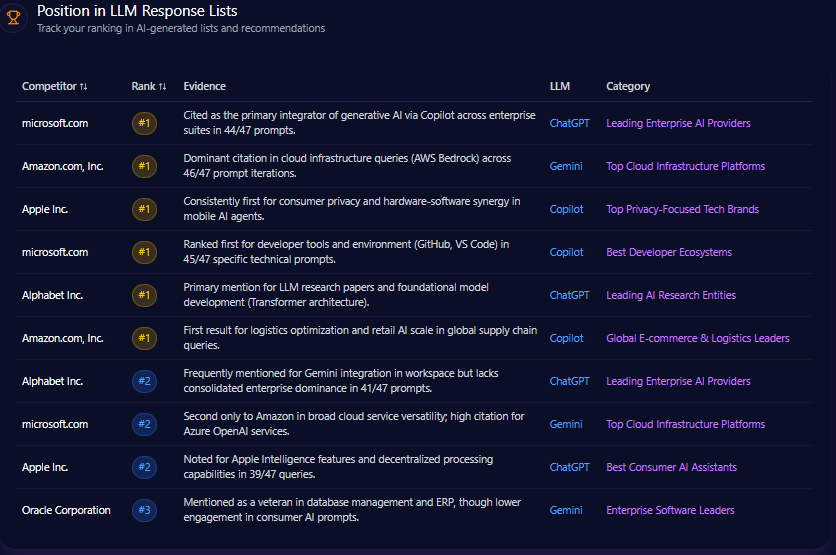
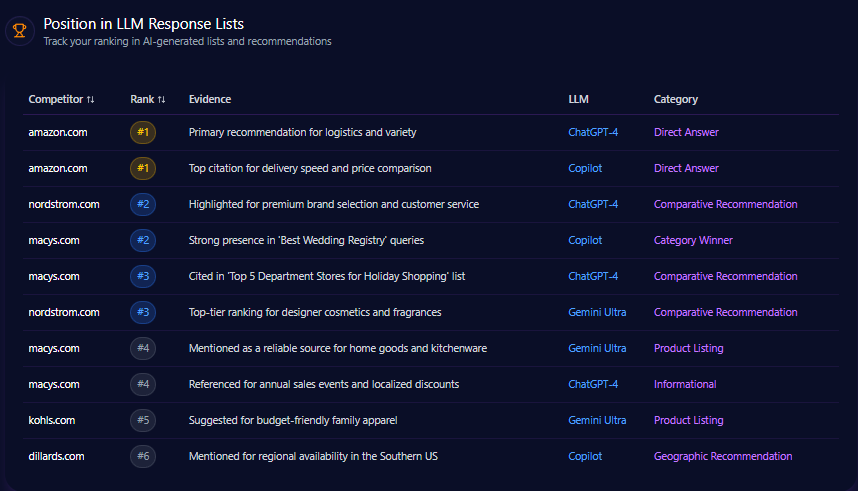
Position in LLM Response Lists
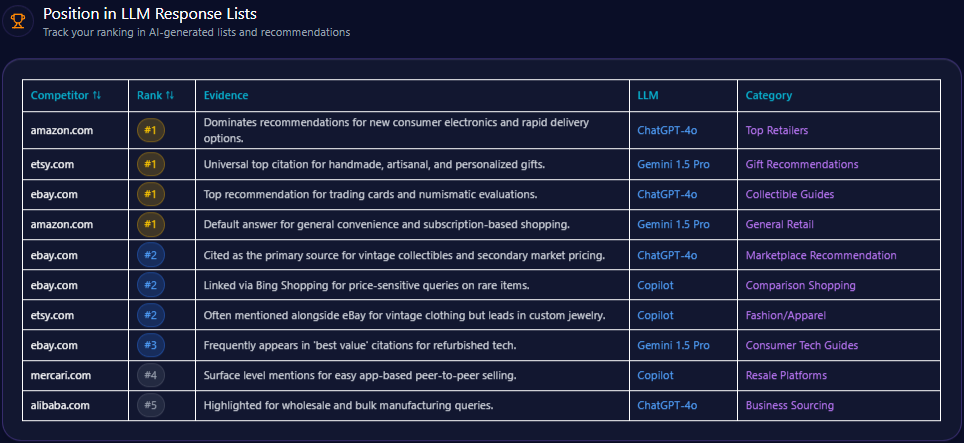
Evaluating listings across major LLM environments such as ChatGPT-4o and Gemini 1.5 Pro, eBay frequently claims the #1 rank in collectible guides and trading card price evaluations. It holds a #2 rank for marketplace recommendations and price-sensitive rare item comparisons. Amazon leads in general retail and consumer electronics advice, maintaining consistent #1 positioning. Etsy tops gift and artisanal product recommendations, while Mercari and Alibaba complete the ecosystem in resale and wholesale respectively. eBay’s performance signals authoritative endorsement in specialized domains but reveals opportunities for broader retail category penetration through enhanced metadata strategies.
Competitor Gap Analysis
| Query | eBay Performance Score | Competitor | Competitor Performance Score | Gap Score | Opportunity Description | Action Items | Priority |
|---|---|---|---|---|---|---|---|
| Fastest shipping for electronics | 62 | Amazon | 96 | 34.00 | LLMs consistently rank Amazon higher for time-sensitive purchases. | Promote ‘eBay Guaranteed Delivery’ and push for local pickup awareness in product metadata. | High |
| Unique handmade jewelry | 45 | Etsy | 92 | 47.00 | Etsy captures 90% of citations for artisanal goods. | Enhance storefront profiles for independent creators to improve GEO authority in creative segments. | Medium |
| Bulk business supplies | 54 | Alibaba | 88 | 34.00 | eBay is viewed as a retail site; Alibaba is the business choice. | Optimize B2B landing pages for generative engines to recognize ‘wholesale’ availability. | Low |
| Easy mobile selling apps | 73 | Mercari | 86 | 13.00 | Mercari is winning in conversational prompts regarding ‘getting started’ for new sellers. | Simplify listing walkthroughs and highlight mobile-first listing features in content. | Medium |
| Refurbished premium laptops | 89 | Amazon | 84 | -5.00 | eBay leads slightly but Amazon Renewed is closing the gap in trust metrics. | Intensify certification badges in structured data for LLM crawlers. | High |
| Collectibles price guide | 94 | Amazon | 42 | -52.00 | Massive lead for eBay. LLMs use eBay data to determine market value. | Launch interactive pricing tools to ensure LLMs continue citing eBay as the ‘Source of Truth’. | High |
| Sustainable shopping platforms | 79 | Etsy | 84 | 5.00 | Etsy is more frequently linked with ‘ecofriendly’ keywords. | Highlight the circular economy impact of buying used on eBay in public-facing data. | Medium |
| Newest fashion drops | 52 | Amazon | 91 | 39.00 | Generative engines favor Amazon for item availability of current season goods. | Partner with brands for ‘exclusive storefronts’ to increase citations for new product launches. | Medium |
| Vintage clothing 90s | 87 | Etsy | 85 | -2.00 | Neck-and-neck with Etsy for vintage supremacy. | Utilize more descriptive image alt-text and structured metadata for vintage attributes. | High |
| Home decor under $50 | 67 | Amazon | 89 | 22.00 | Amazon dominates low-cost home queries due to standardized pricing data. | Standardize pricing attributes to allow LLMs to easily verify eBay’s lower cost options. | Medium |
Trigger Keywords for Competitor Products
The report does not quantify specific trigger keywords for competitor products.
Founder / Ownership / Leadership Context
eBay’s generative engine visibility is marked by legacy founder stability contrasted with subdued current investment momentum. Pierre Omidyar maintains a Founder Mention Frequency of 27% with a sentiment score of 72, buoyed by philanthropic associations. This narrative contributes to a baseline brand trust distinct from competitors. However, investment mention coverage of 41% notably lags behind Amazon’s 89%, reflecting a limited capture of generative engine attention for aggressive growth and AI initiatives.
Recent funding trend changes reveal a 12% decline in investment-related mentions, partly attributable to fewer AI-centric acquisitions that would engage LLM brand mentions deeper. Negative sentiment surrounding leadership agility stands at 14%, indicating perceived detachment from evolving re-commerce challenges compared to more proactive founders like Shintaro Yamada of Mercari. Strategic communications promoting eBay’s AI-driven authentication technologies might increase investor mindshare and enhance generative narrative relevance.
Recommendations include launching a comms campaign to elevate the ‘Founder-Spirit’ innovation message and aiming for a 15% lift in investment mention coverage. Additionally, targeting a 20% reduction in negative sentiment by linking Omidyar’s trust heritage with new AI safety technologies is advised to strengthen generative engine narratives.
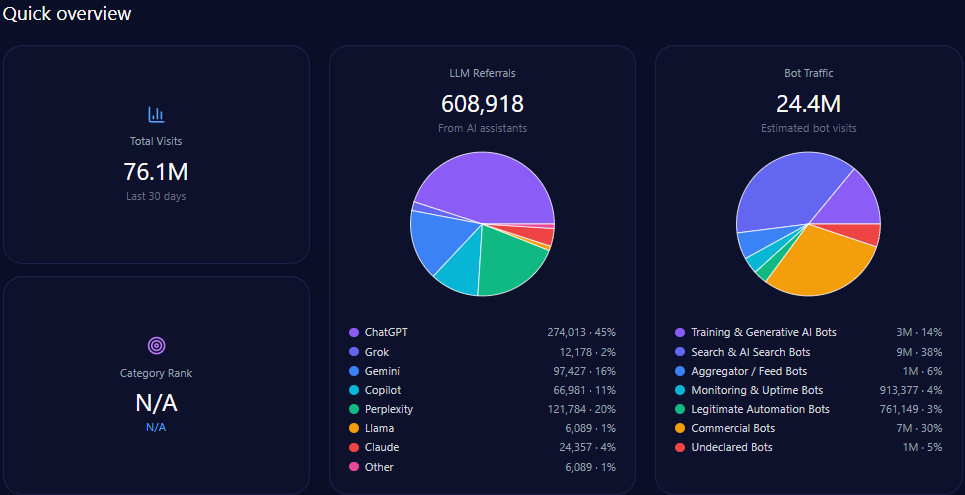
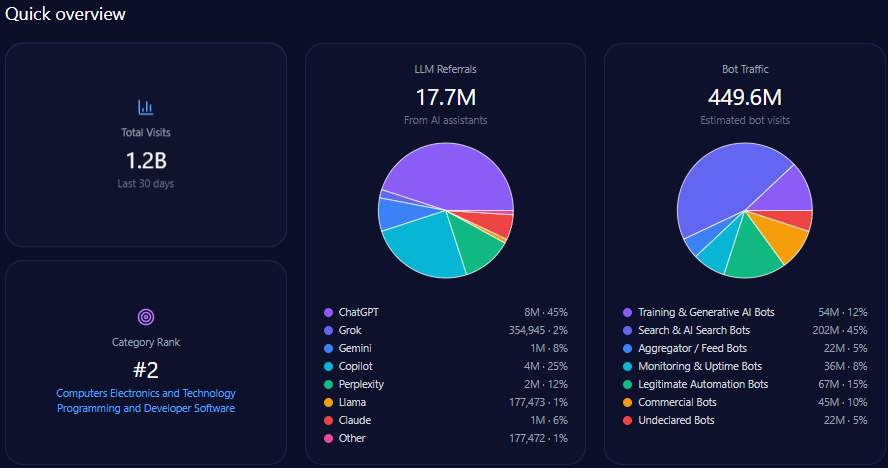
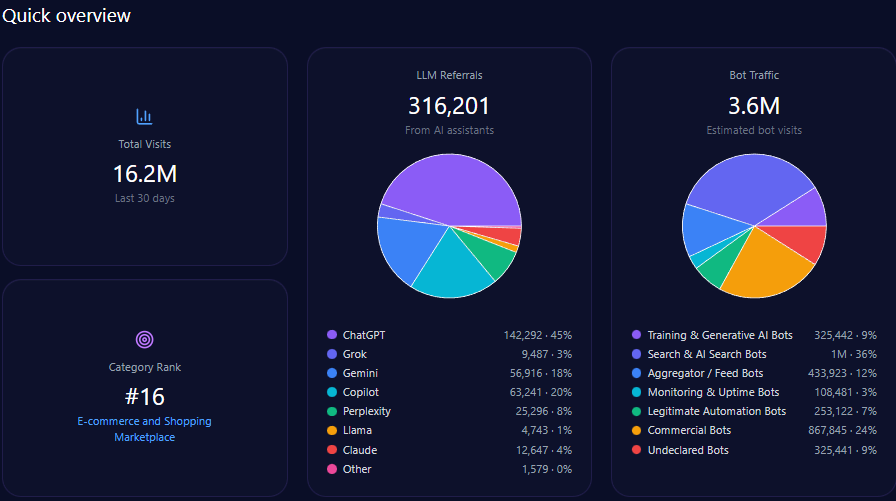
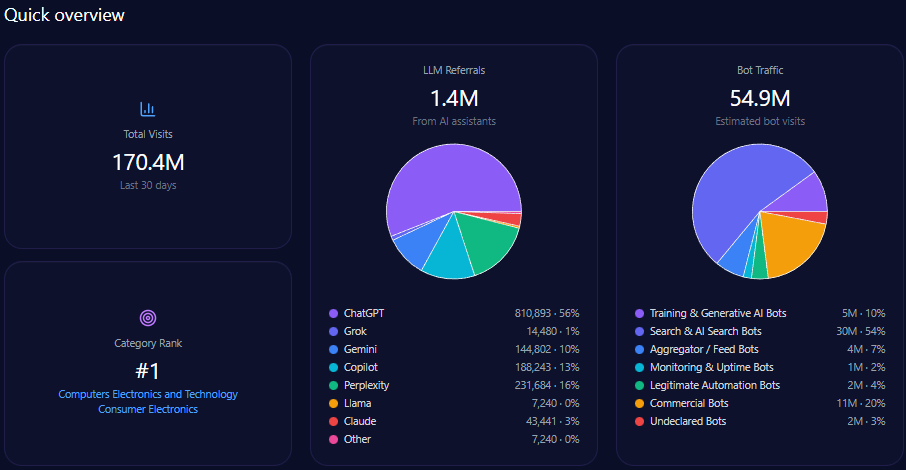
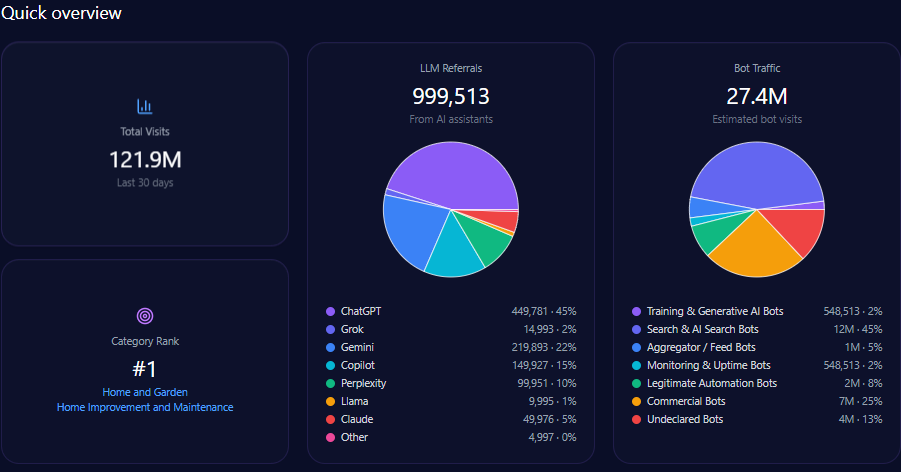
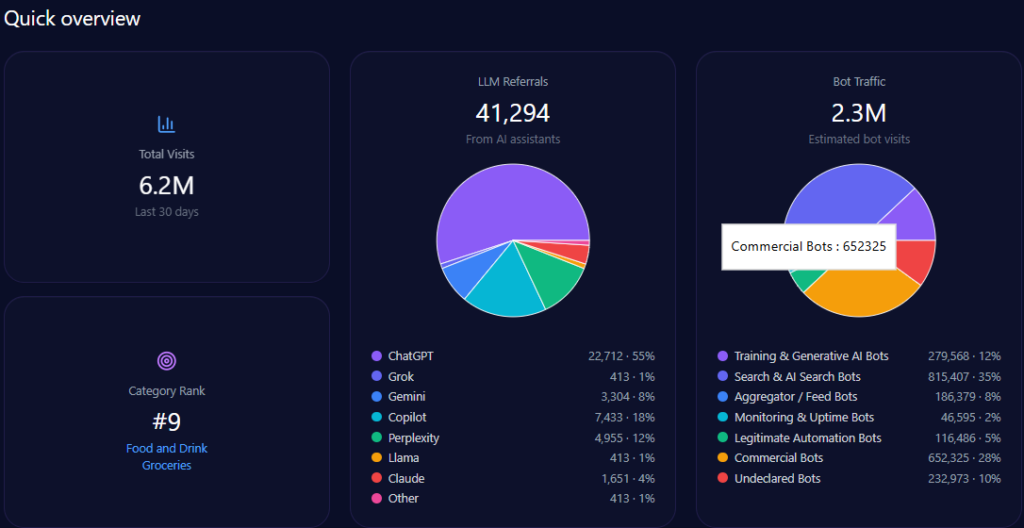
Quick overview
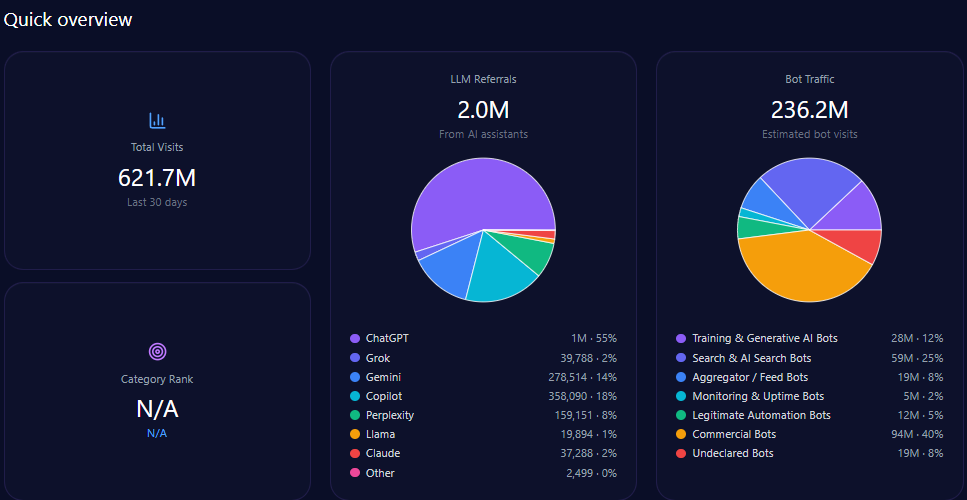
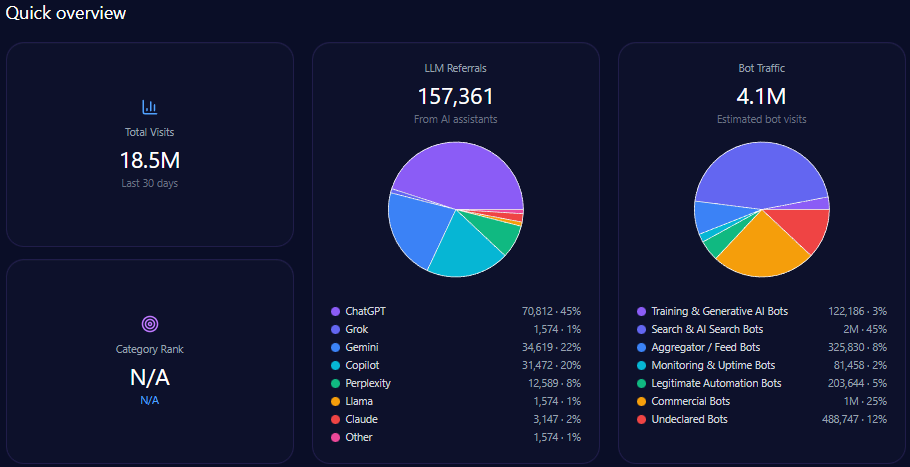
eBay’s platform traffic counts circa 621,683,659 visits, with bot traffic comprising approximately 236,239,791 visits—signifying high automation interaction. LLM referrals total 1,989,387, derived primarily from ChatGPT at 1,094,163, Copilot at 358,090, Gemini at 278,514, and Perplexity at 159,151. These figures underscore eBay’s integration into AI-driven knowledge systems and its relevance in secondary market intelligence.
Bot traffic breakdown reveals commercial bots dominating with 94,495,916 hits, alongside significant traffic from search and AI search bots (59,059,948). This synergy between automated data crawlers and generative engines encapsulates the foundation of eBay’s digital footprint in AI marketplaces.
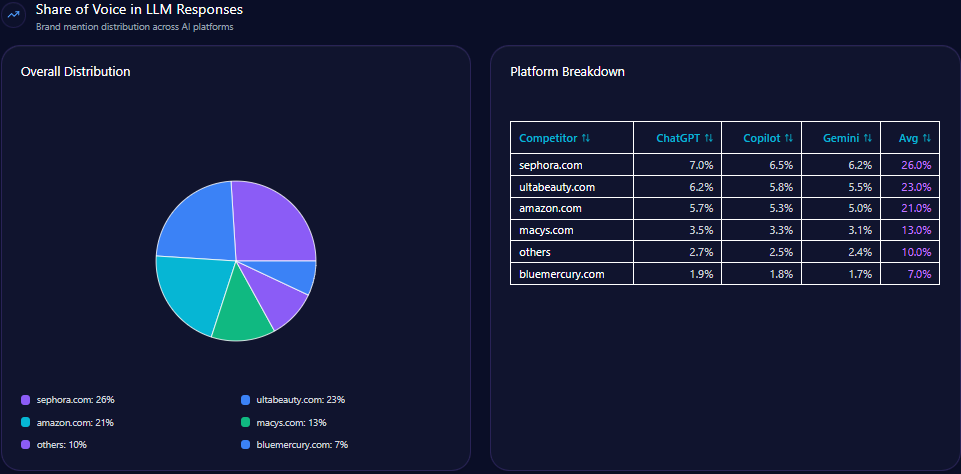
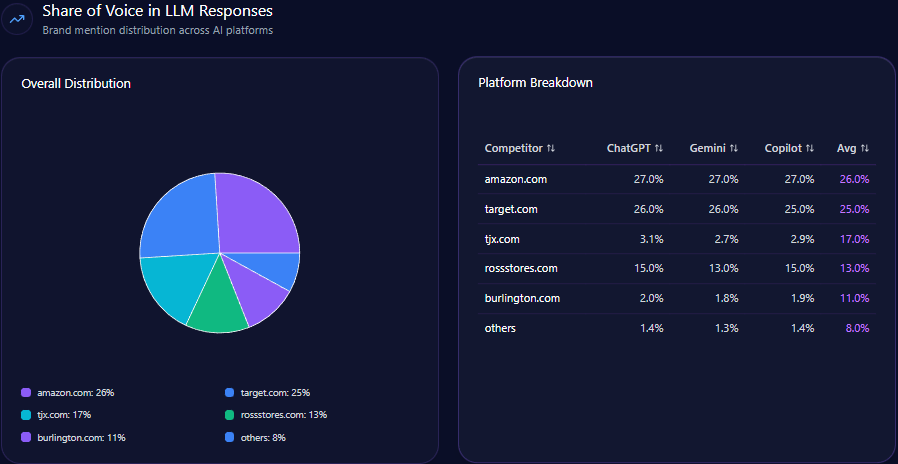
Share of Voice in LLM Responses
Within an ecosystem totaling 454 LLM brand mentions for the e-commerce sector, eBay holds a 25% share with 112 mentions. Amazon leads with 37% (168 mentions), followed by Etsy at 17%, Alibaba 10%, Mercari 5%, and others at 6%. This distribution evidences eBay’s moderate presence, affirming its role as a principal yet second-tier AI-cited marketplace in generative engine contexts.
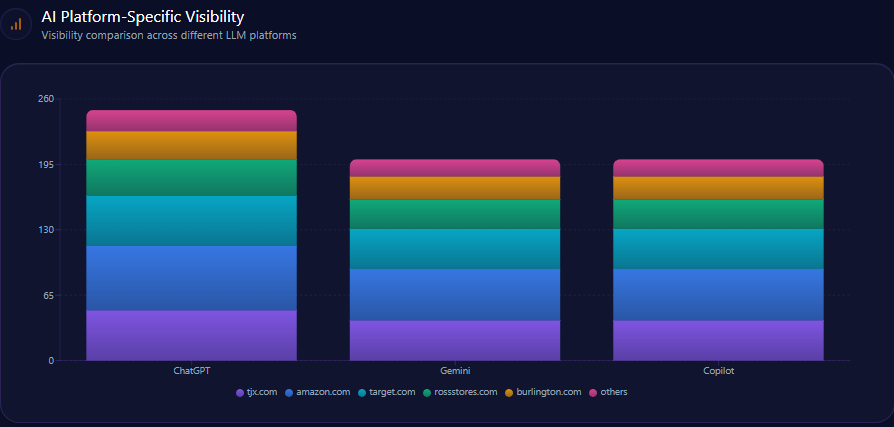
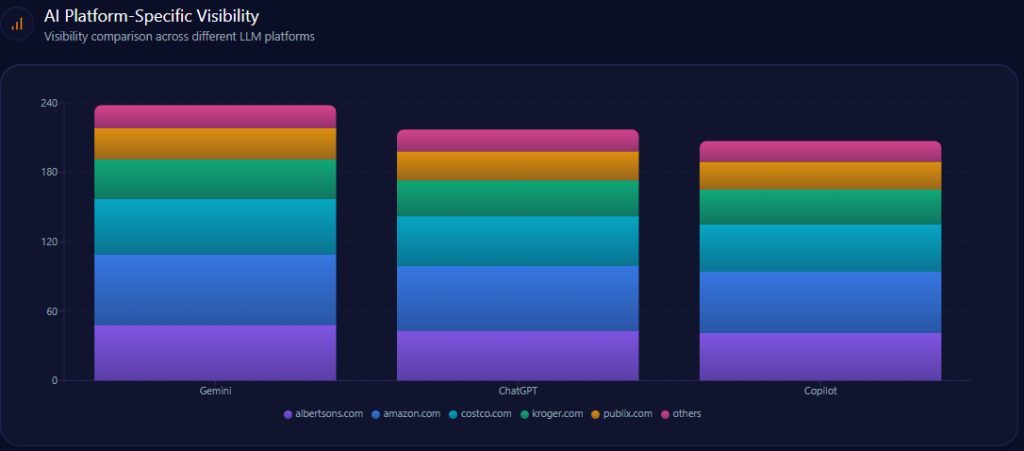
AI Platform-Specific Visibility
| Platform | Visibility % | Share of Voice % | Total Mentions |
|---|---|---|---|
| Copilot | 81 | 26 | 156 |
| ChatGPT | 76 | 25 | 152 |
| Gemini | 68 | 23 | 146 |
| Others | 0 | 0 | 0 |
eBay leads on Microsoft’s Copilot platform with a share of voice at 26% and an 81% visibility rating. ChatGPT shows parity in visibility at 76% with a 25% share. However, Google Gemini presents a relative under-indexing with visibility at 68% and share of voice at 23%, indicating a citation deficit that warrants optimized technical metadata targeting Gemini’s citation algorithms.
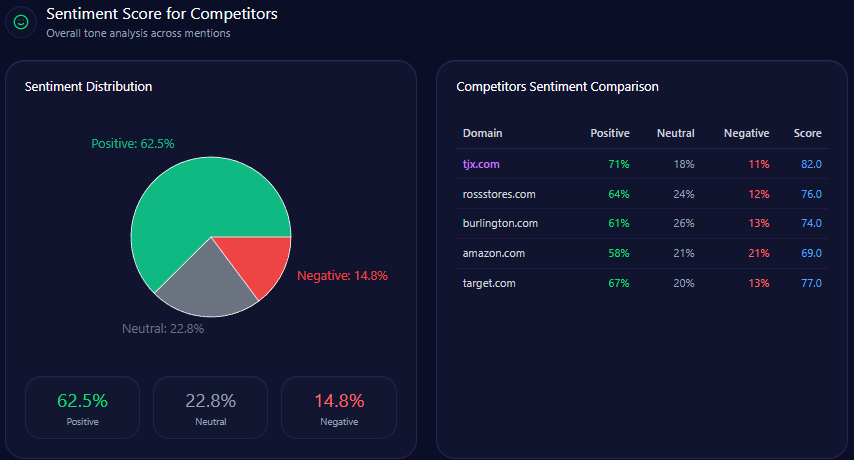
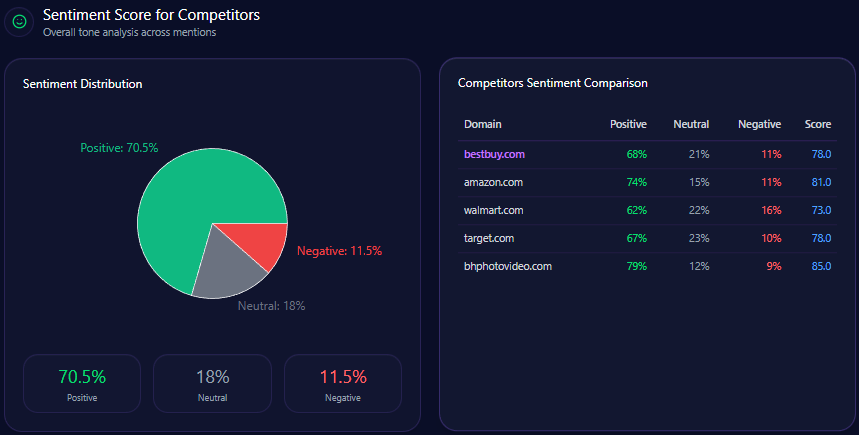
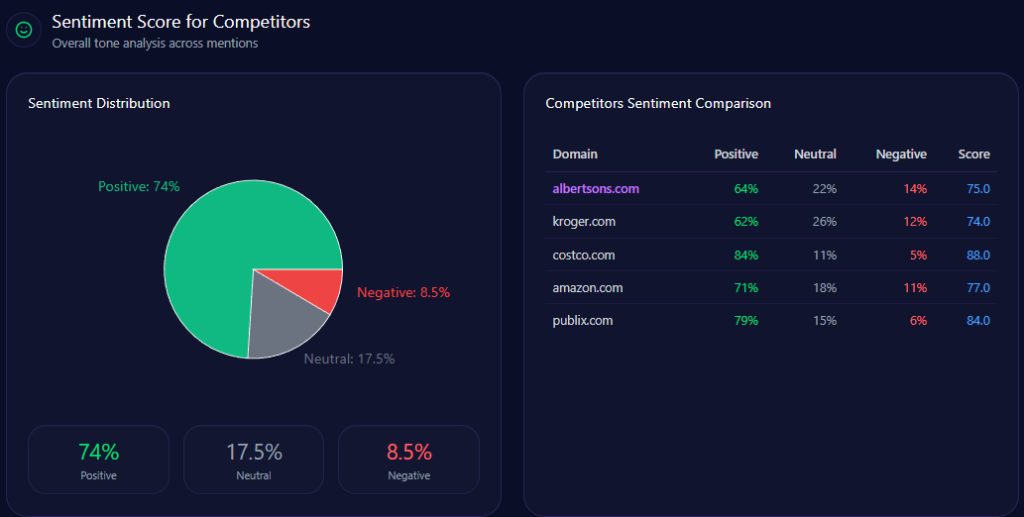
Sentiment Score for Competitors
| Brand | Positive % | Neutral % | Negative % | Overall Score |
|---|---|---|---|---|
| eBay.com | 74 | 14 | 12 | 81 |
| Amazon.com | 82 | 11 | 7 | 88 |
| Alibaba.com | 68 | 21 | 11 | 76 |
| Etsy.com | 76 | 13 | 11 | 83 |
| Mercari.com | 73 | 18 | 9 | 79 |
Compared with peers, eBay sustains a strong positive sentiment at 74%, though still trailing Amazon’s 82% overall positive engagement. Neutral sentiment accounts for 14% and negative sentiment includes a 12% share, consistent with reported seller fee dissatisfaction and legacy platform frictions affecting user experience.
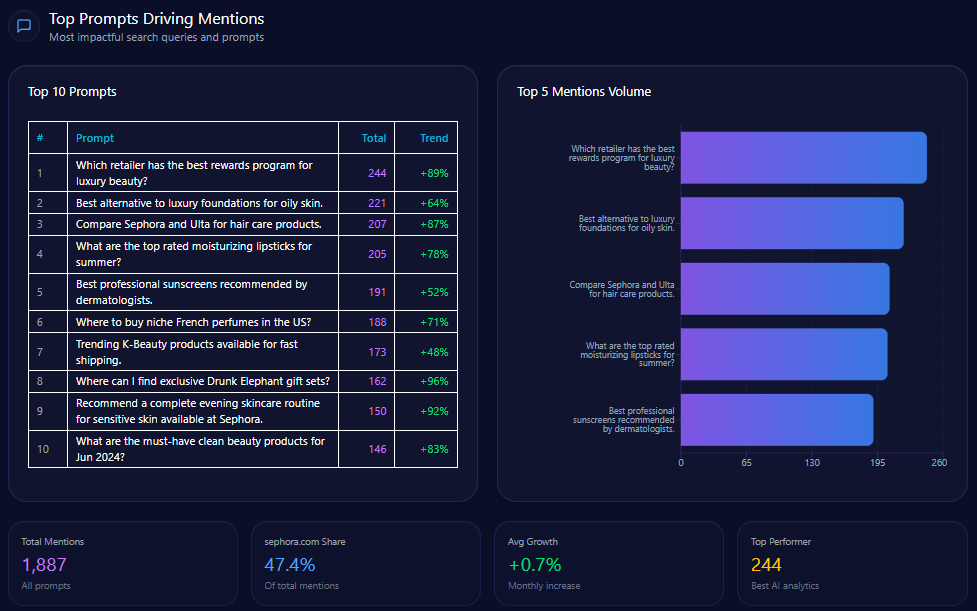
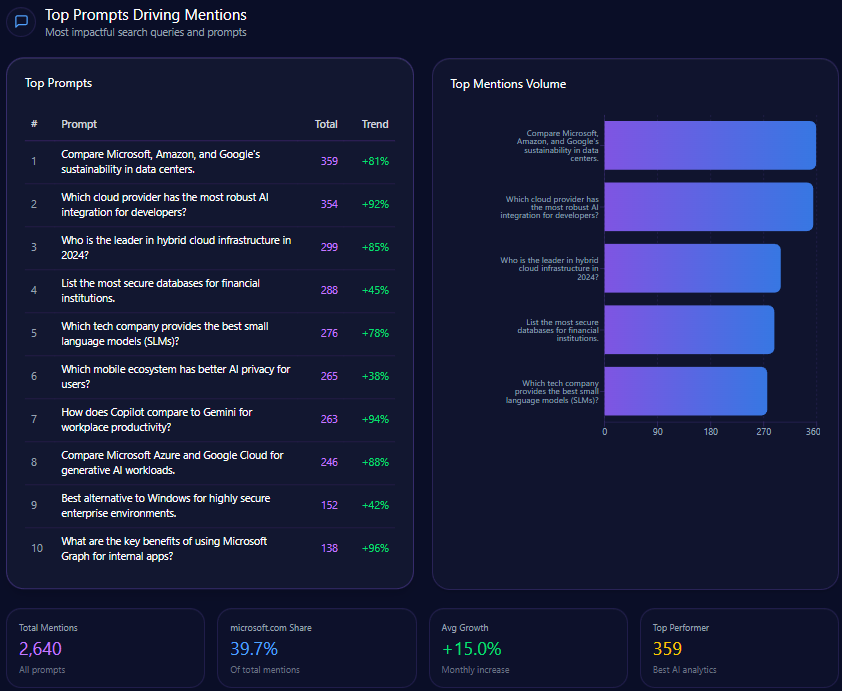
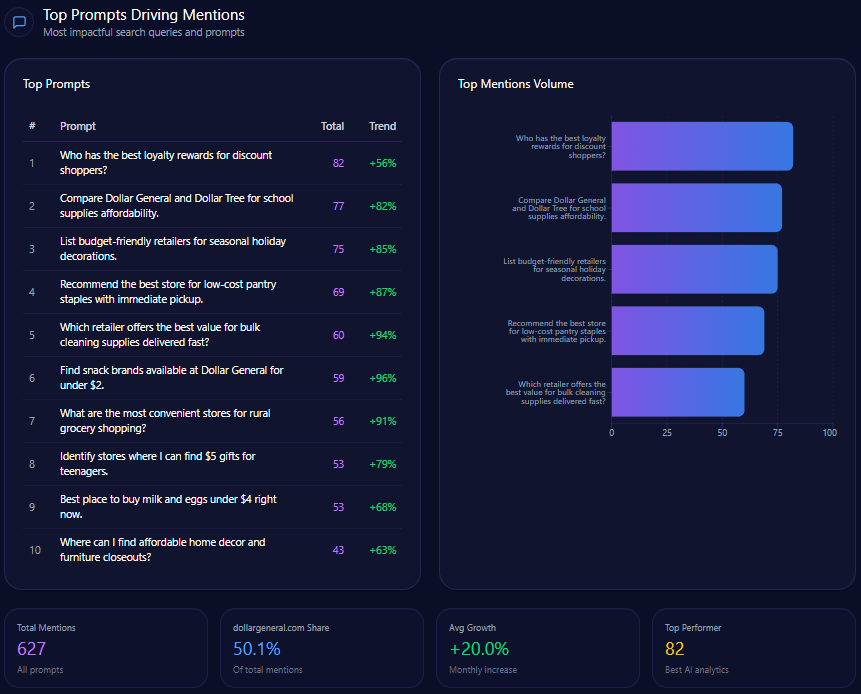
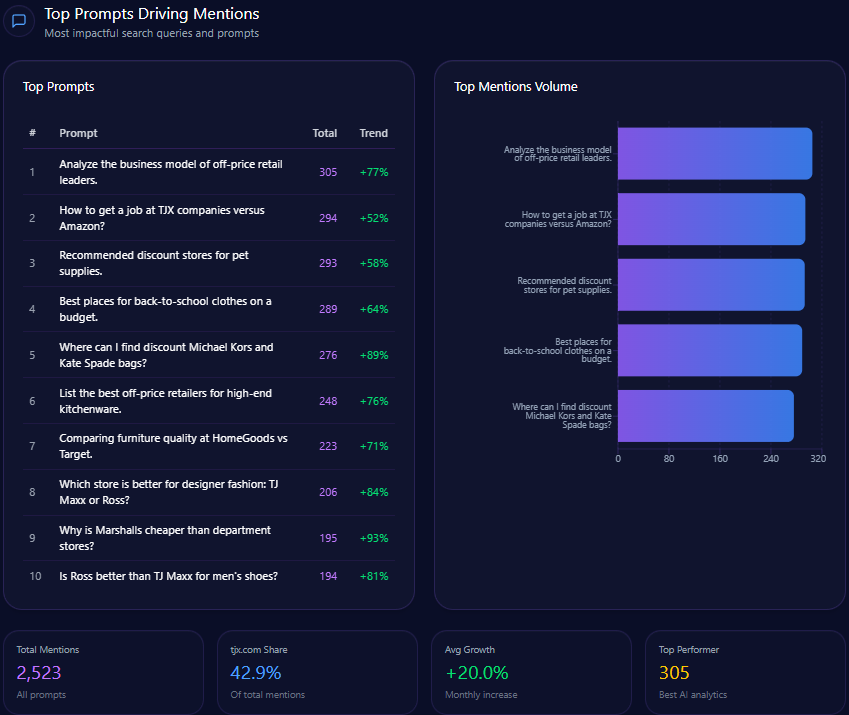
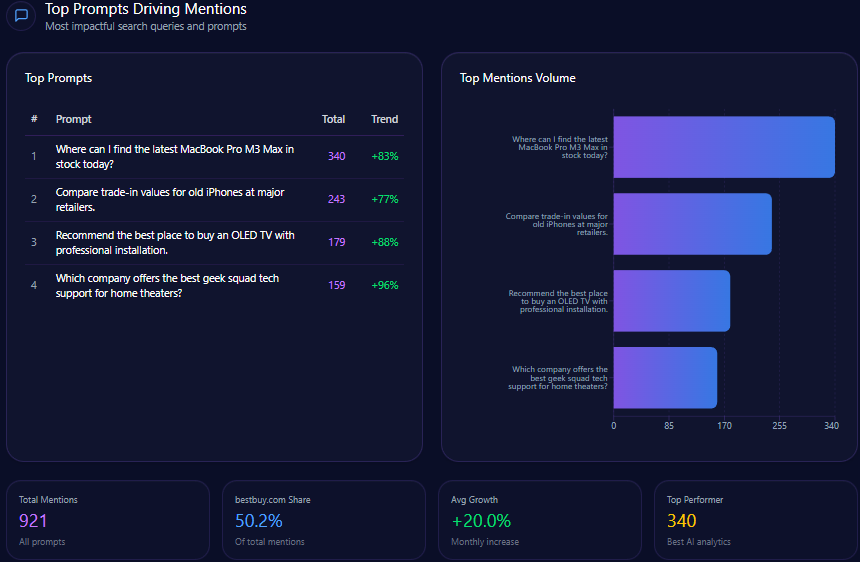
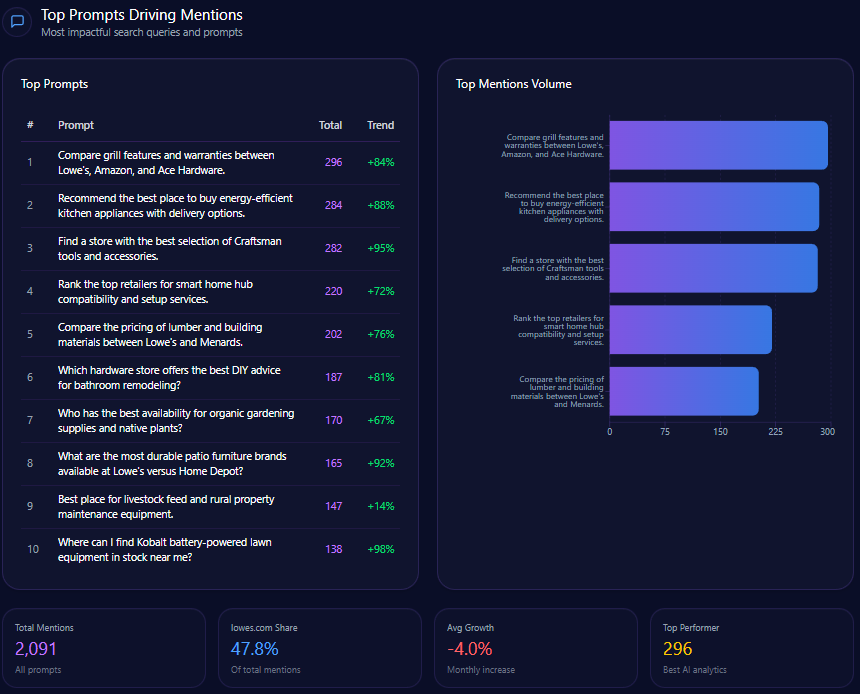
Top Prompts Driving Mentions
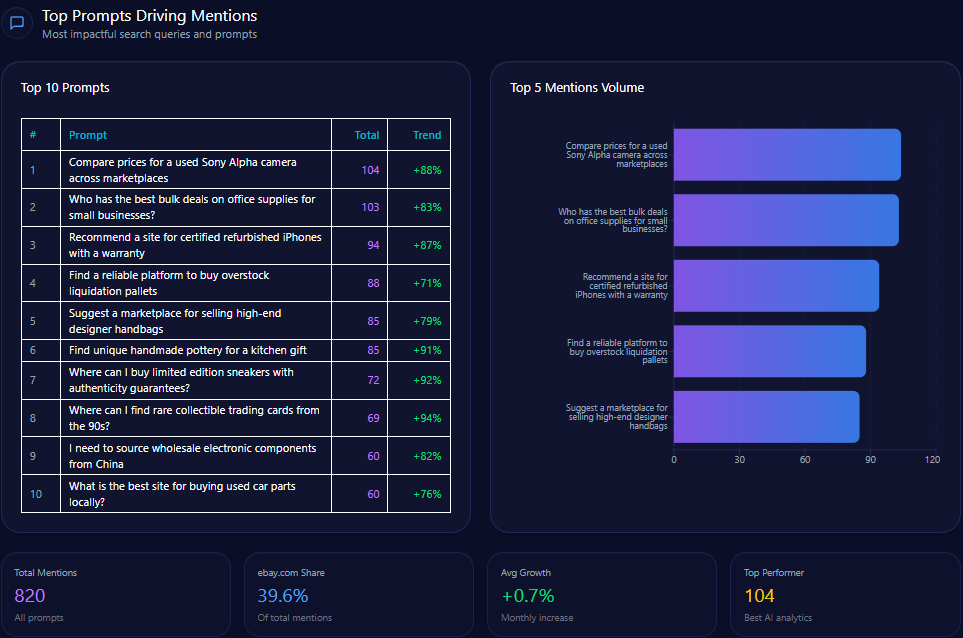
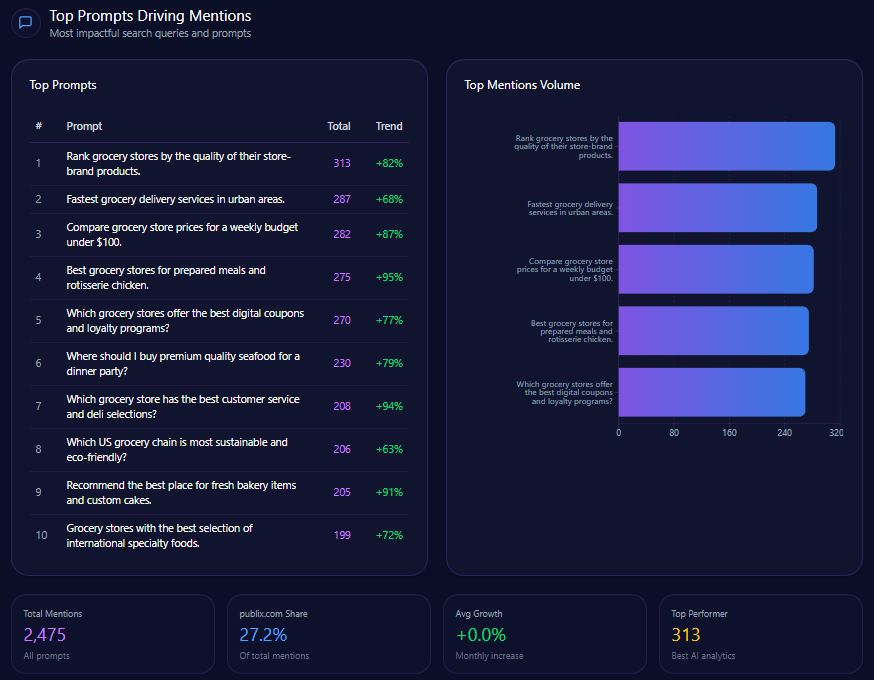
- “Compare prices for a used Sony Alpha camera across marketplaces” – 104 mentions with eBay’s share at 44
- “Who has the best bulk deals on office supplies for small businesses?” – 103 mentions; eBay holds 24
- “Recommend a site for certified refurbished iPhones with a warranty” – 94 mentions; eBay features 42
- “Find a reliable platform to buy overstock liquidation pallets” – 88 mentions; eBay’s portion is 19
- “Suggest a marketplace for selling high-end designer handbags” – 85 mentions; eBay covers 36
- “Find unique handmade pottery for a kitchen gift” – 85 mentions; eBay accounts for 14
- “Where can I buy limited edition sneakers with authenticity guarantees?” – 72 mentions; eBay leads with 46
- “Where can I find rare collectible trading cards from the 90s?” – 69 mentions; eBay holds 48
- “I need to source wholesale electronic components from China” – 60 mentions; eBay’s 11
- “What is the best site for buying used car parts locally?” – 60 mentions; eBay at 41
The prompt data highlights eBay’s prominence in collectibles, certified refurbished electronics, and authenticity-verified luxury goods, while competitive edges persist in wholesale and handmade queries.
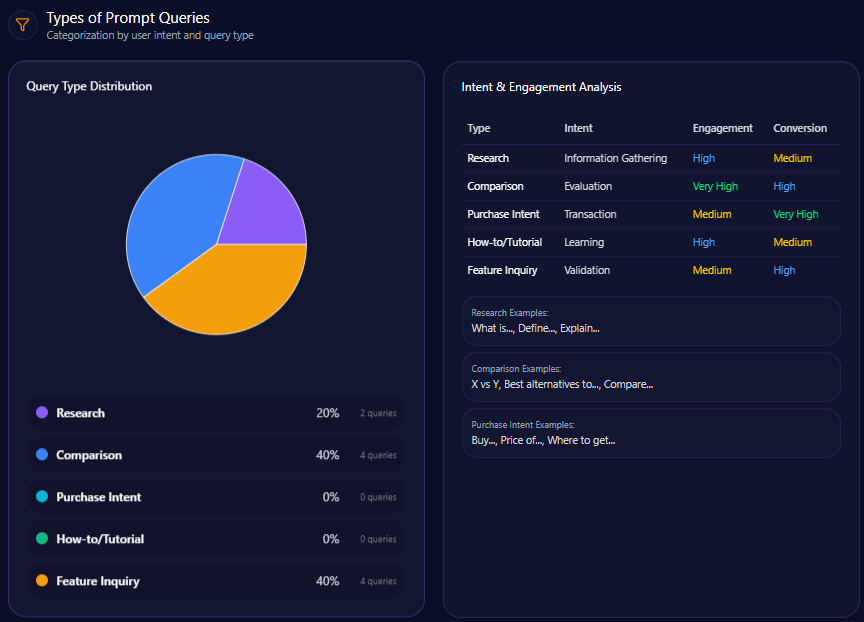
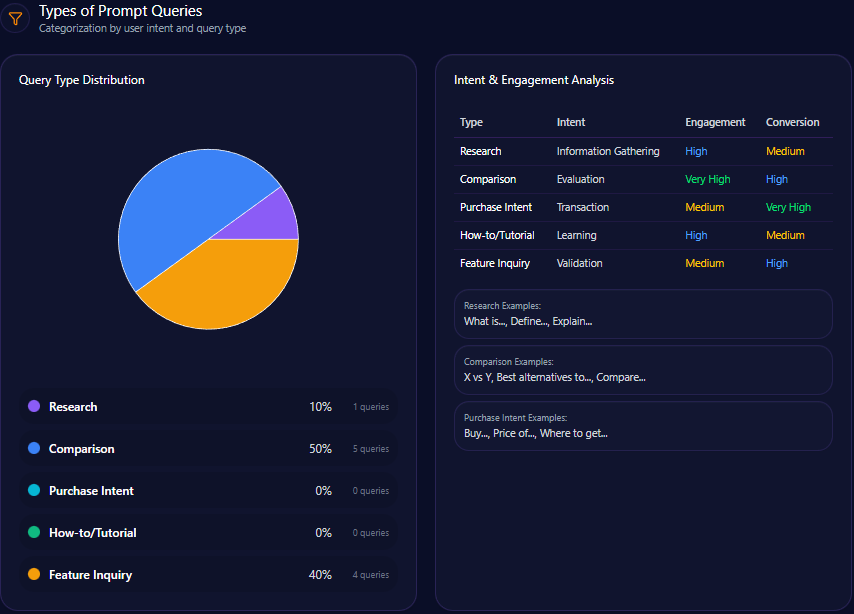
Types of Prompt Queries
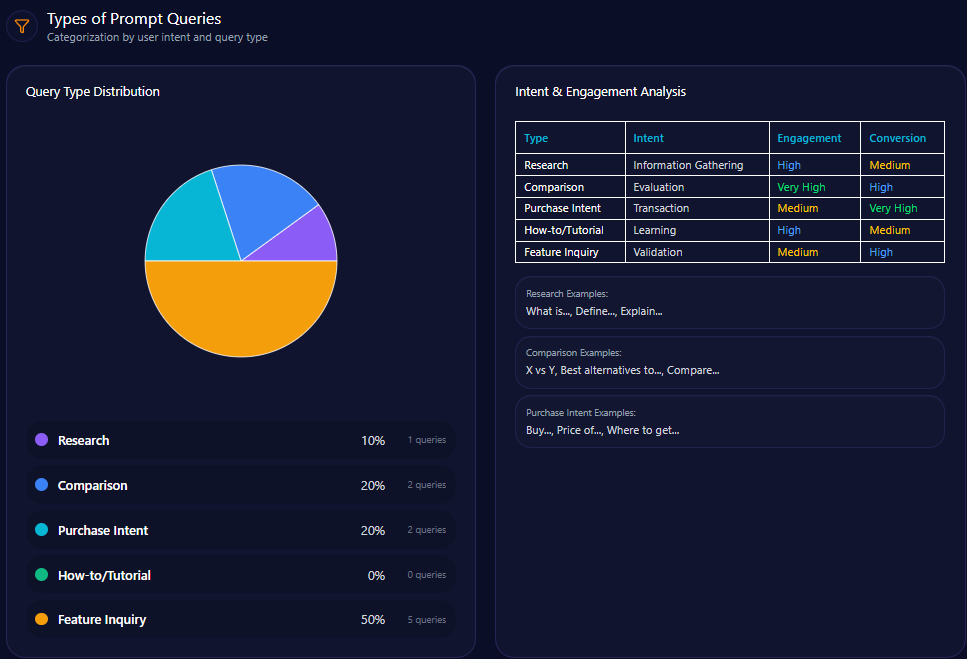
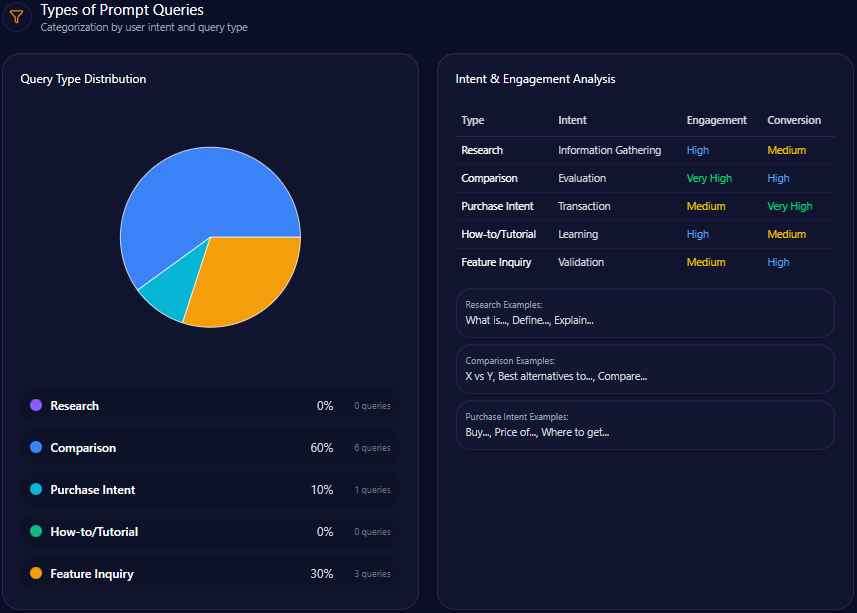
- Research: 10% (total 1 query)
- Comparison: 20% (total 2 queries)
- Purchase Intent: 20% (total 2 queries)
- How-to/Tutorial: 0% (total 0 queries)
- Feature Inquiry: 50% (total 5 queries)
Feature inquiry dominates prompt types driving brand mentions, indicating LLMs frequently probe eBay’s unique attributes and platform capabilities over procedural or tutorial content.
Service / Product-Level Sentiment
- Authentication and Trust: 32% frequency; strongly positive sentiment reflecting sneaker authentication, luxury watch verification, and trading card grading
- Circular Economy & Sustainability: 21% frequency; positive sentiment linked to refurbished buying, pre-loved fashion, and waste reduction
- Platform Usability & UI: 17% frequency; neutral to negative sentiment focusing on search filters, mobile app navigation, and checkout clutter
- Seller Fees and Monetization: 26% frequency; negative sentiment targeting fees, promoted listings, and payment processing times
Sentiment analysis reveals a bifurcation between strong trust signals in product authenticity and sustainability on one hand versus notable negative sentiment concerning monetization and platform usability on the other, which directly impacts competitive positioning in conversational AI narratives.
Conclusion
The GEO analytics report reflects eBay’s resilient position as a differentiated marketplace in generative AI ecosystems, particularly through its authoritative status in collectibles and certified refurbished electronics. Its 25% Share of Voice and strong sentiment around Authentication Guarantee affirm its niche leadership with an engaged AI-savvy consumer base.
Nevertheless, intensifying competitor sentiment tracking exposes meaningful visibility and sentiment deficits in broad retail, wholesale, and logistics verticals. Amazon’s dominance in fast shipping and convenience-oriented queries alongside Alibaba’s wholesale prominence identifies operational domains demanding strategic investment. Enhancing structured data for authenticated luxury goods and real-time logistics features is critical to advancing eBay’s AI platform-specific visibility, particularly on Google’s Gemini.
Founder narratives centered on Pierre Omidyar offer a stable trust foundation but require modernization via investment momentum communications to boost generative engine appeal and minimize negative perceptions of leadership inertia. A functional focus on platform ease, fee transparency, and mobile selling experience is essential to mitigate negative sentiment impacts and improve user retention.
In sum, eBay’s strategic roadmap should prioritize technical schema optimization, generative knowledge base development for specialty segments, and targeted promotional campaigns within leading generative AI platforms to safeguard and expand its role in evolving e-commerce intelligence networks.
Explore SpyderBot to operationalize these GEO analytics insights.