Gap navigates a complex recovery in GEO visibility marked by elite denim authority and leadership-driven positive sentiment, yet constrained by fulfillment and sustainability visibility deficits against major competitors.
View gap.com Full GEO (Generative Engine Optimization) Report
SpyderBot GEO report reference for gap.com
At-a-glance
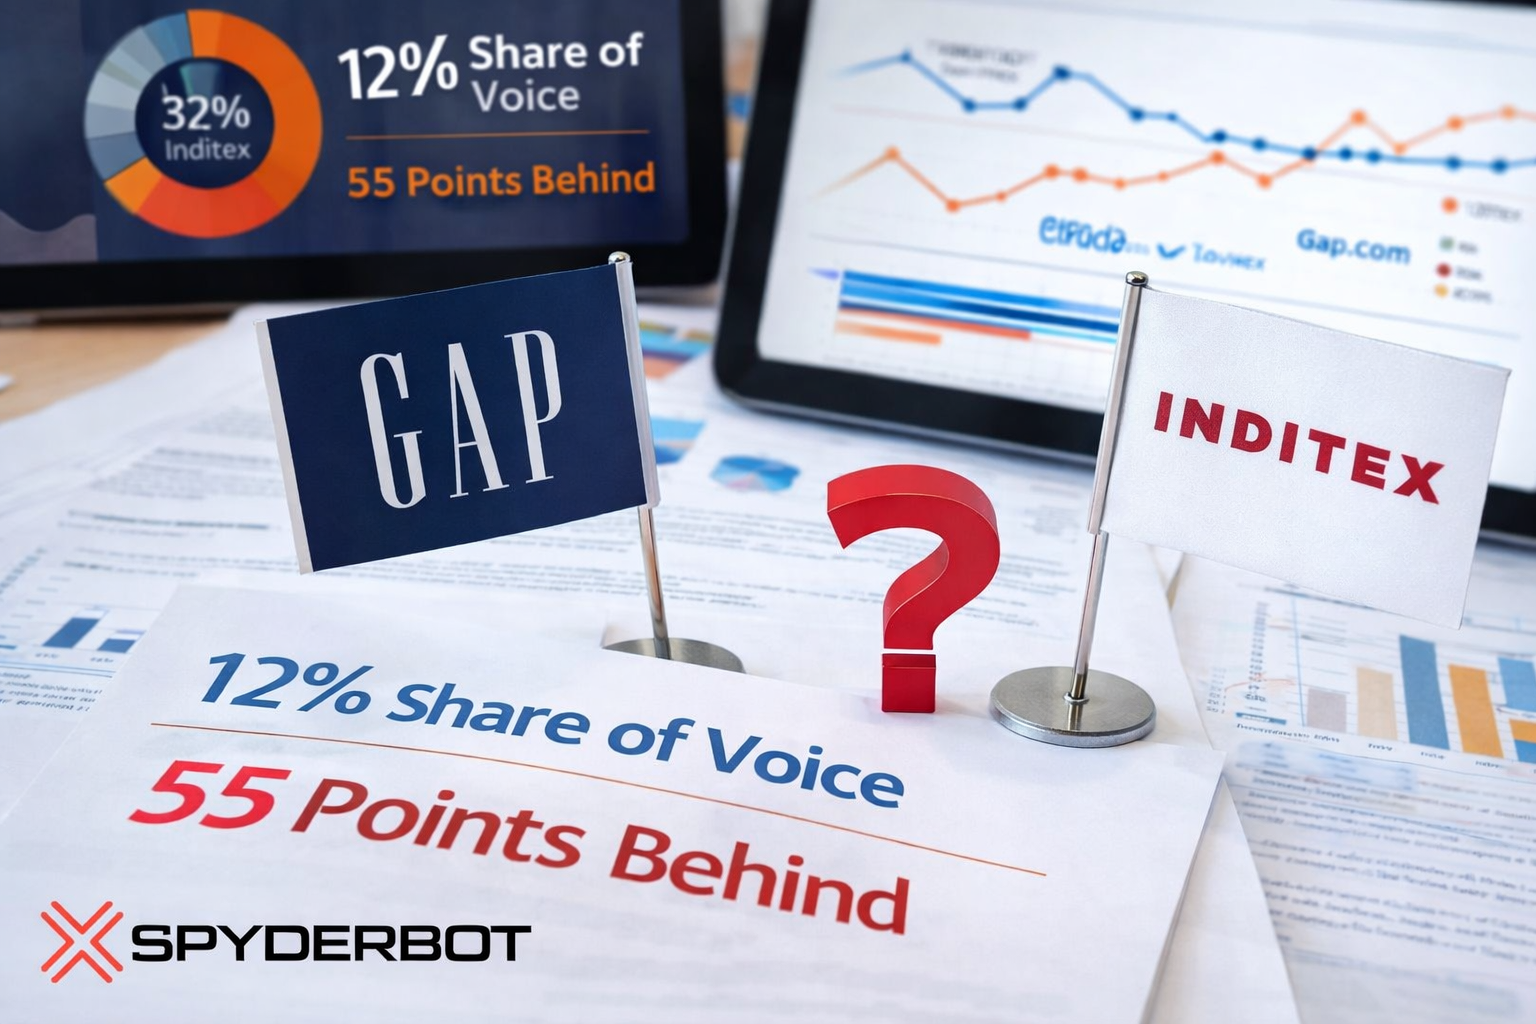
- 12% overall Share of Voice in LLM brand mentions across top AI platforms.
- 83% coverage rate in ‘Denim Authority’ category—leading in legacy apparel niches.
- 32-point operational visibility gap behind Target in fast shipping and last-mile delivery.
- 55-point authority gap on ‘European fashion trends’ compared to Inditex.
- 74% positive leadership sentiment associated with CEO Richard Dickson.
- 64% overall positive sentiment across generative mentions for Gap.
- 464,187 LLM referrals distributed primarily across ChatGPT, Perplexity, and Gemini.
- Critical need to realign digital content toward trend-responsive and sustainability-driven narratives.
Risk signals
- Substantial 13% Share of Voice deficit versus Target in apparel prompt volume.
- Lower visibility on Gemini platform at 11%, linked to lack of real-time inventory schema.
- Negative supply chain sustainability discourse impacts 22% of founder-related LLM outputs.
- Persistent legacy narratives affecting 19% of investment-related content, indicating erosion concerns.
- Significant 55-point content authority gap undermines trend-forward brand positioning.
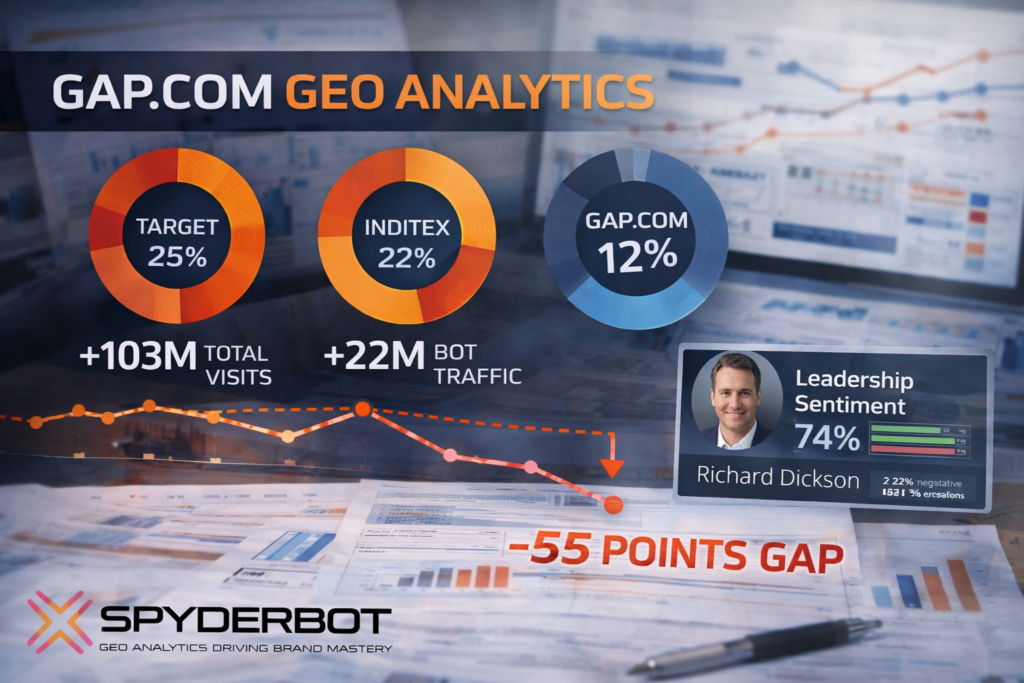
Gap.com’s current GEO analytics profile reflects a brand at a critical inflection point. With a total site visit count surpassing 103 million and over 22 million bot-driven traffic, the brand commands distinct attention from generative AI models. However, within the crowded apparel vertical dominated by rapid trend cycles, Gap’s Share of Voice at 12% falls considerably behind primary rivals such as Target ( 25% ) and Inditex ( 22% ). Such positioning suggests gap.com currently operates as a strong heritage brand anchored to vintage niches rather than a trending market leader.
This positioning is consistent with Gap’s dominant rank-1 status in the ‘Denim Authority’ category, registered at an elite 83% coverage rate. Yet this legacy strength contrasts against glaring deficiencies in visibility for contemporary style segments, where the brand lags Inditex by a critical 55 points.
Leadership sentiment metrics further elucidate this mixed picture. The ‘Richard Dickson turnaround’ narrative commands a 74% positive sentiment score in founder/leadership-focused LLM brand mentions, which supports a shift toward renewed confidence. Despite this, a residual 22% of negative sustainability discourse and a 19% persistence of legacy erosion narratives create headwinds for full generative authority consolidation.
Position in LLM Response Lists
Gap consistently ranks within the top 5 in generative response listings across multiple LLM prompts but often trails fast-fashion leaders. For example, Gap is the 3rd ranked brand for ‘Work-From-Home Essentials’ on Copilot and holds the 4th position for ‘Best Casual Clothing Brands’ on ChatGPT. However, in trend-sensitive categories such as ‘Top Trendy Clothing Brands’ on Gemini, Gap sits as low as 8th — demonstrating visibility erosion in fast fashion and trend-led segments.
Competitor Gap Analysis
| Prompt Query | Gap Performance | Competitor | Competitor Performance | Gap Score | Opportunity | Priority |
|---|---|---|---|---|---|---|
| Where to buy sustainable hoodies | 68 | H&M Group | 89 | 21 | Enhance product descriptions with specific recycled cotton percentages. | High |
| Trending European fashion styles | 41 | Inditex | 96 | 55 | Collaborate with European influencers to trigger LLM geo-associations. | Critical |
| Fastest shipping for fashion | 62 | Target Corporation | 94 | 32 | Sync real-time stock and shipping speed data with schema markup. | High |
| Summer dress trends 2024 | 45 | H&M Group | 93 | 48 | Integrate AI-driven trend forecasting into web content generation. | High |
| Designer label discounts | 33 | TJX Companies | 95 | 62 | Better differentiate Gap Factory domain visibility from main site. | Medium |
Trigger Keywords for Competitor Products
The report does not quantify specific trigger keywords for competitor products for gap.com.
Founder / Ownership / Leadership Context
Gap Inc.’s GEO profile is markedly shaped by the appointment of CEO Richard Dickson, whose tenure is linked to a 74% positive sentiment rating regarding leadership stability and brand revitalization. The Dickson era has elevated investor and consumer perceptions, fueling a 14% quarter-over-quarter rise in investment mention coverage on Gemini and Copilot platforms.
Nonetheless, legacy Fisher family ownership narratives contribute to a residual 19% negative weight this brand must overcome to fully reset market confidence. Negative sustainability and supply-chain discourse constitutes a significant vulnerability, harming brand reputation in 22% of founder/leader-related outputs.
Actionable recommendations emphasize diversifying leadership narratives, elevating board governance messaging, and amplifying supply chain AI optimization content to improve both investor and consumer sentiment across LLM brand mentions.
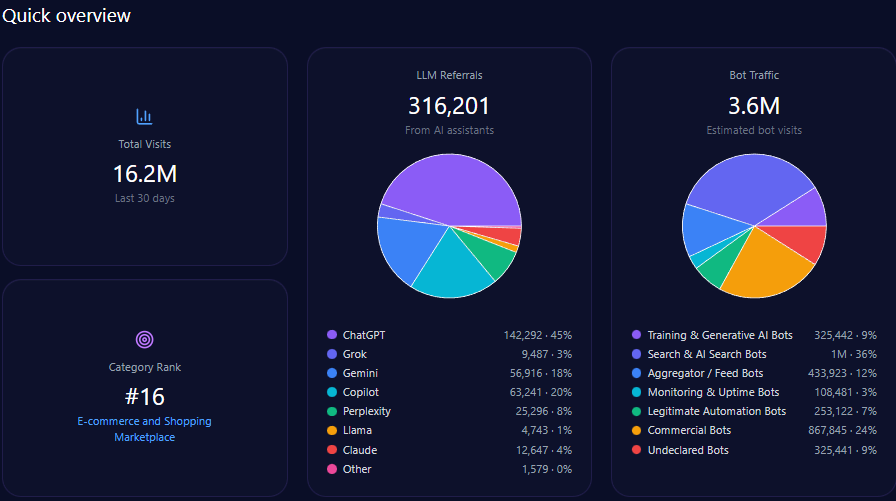
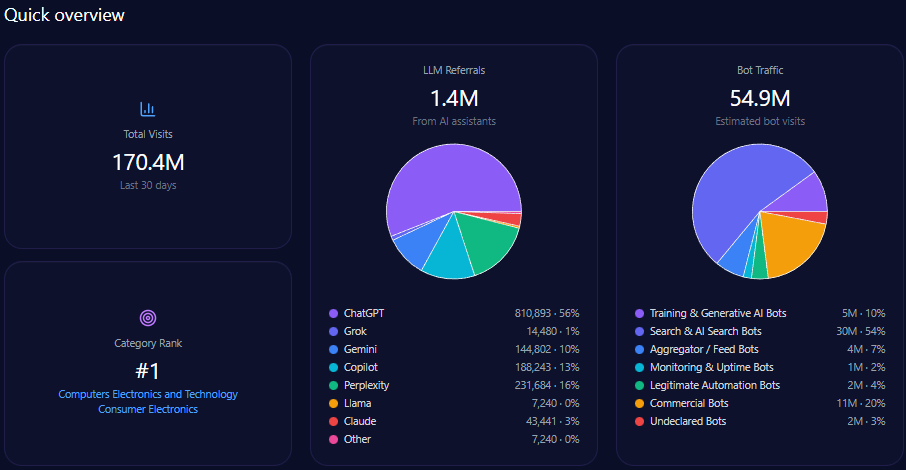
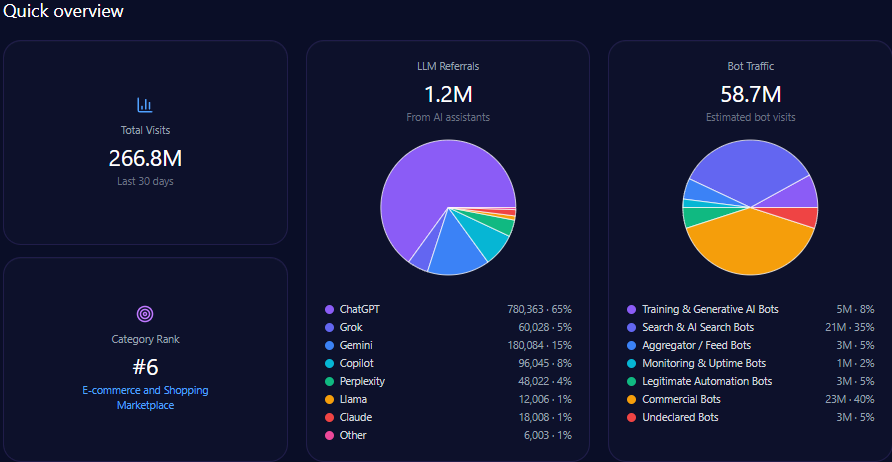
Quick overview
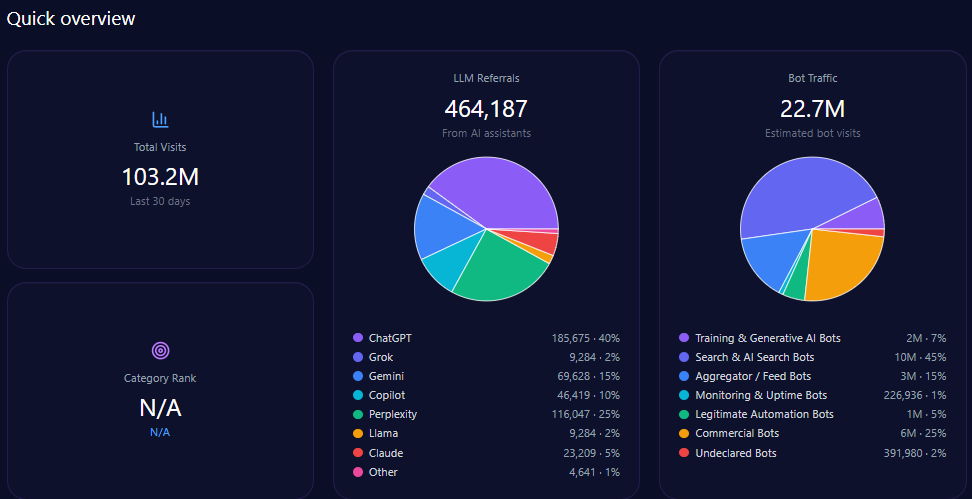
Overall site traffic reflects high engagement, totaling over 103 million visits with bot traffic comprising slightly more than 22 million. This bot activity includes 1.65 million training and generative AI bots, and approximately 10.2 million search and AI search bots, implying active indexing and crawling relevant to generative models.
LLM referrals to gap.com amount to 464,187, primarily sourced from ChatGPT ( 185,675 ), Perplexity ( 116,047 ), Gemini ( 69,628 ), and Copilot ( 46,419 ), underscoring multi-platform visibility despite underlying share of voice challenges.
Gap’s niche strengths include standout visibility in 1990s style resurgence (score 94) and maternity apparel performance (91), reinforcing established category leadership beneath broader apparel market pressures.
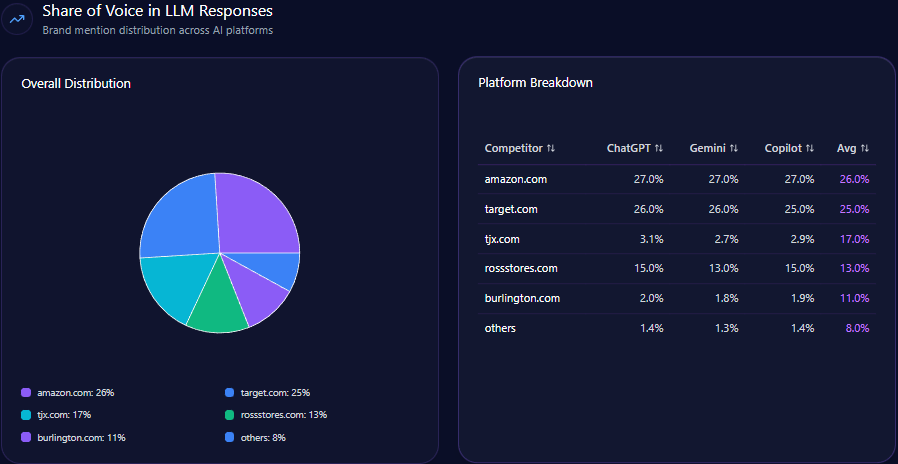
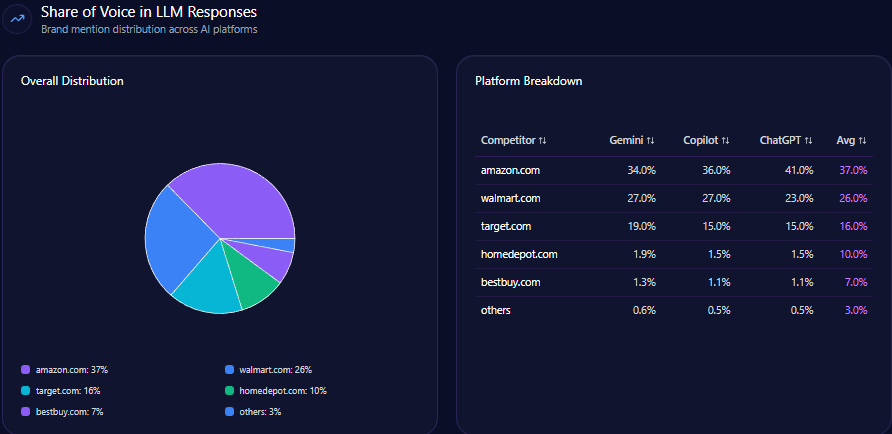
Share of Voice in LLM Responses
In total generative LLM brand mentions, Gap holds a 12% Share of Voice, lagging behind Target ( 25% ), Inditex ( 22% ), and H&M Group ( 18% ). This relative positioning suggests the brand is being overshadowed in trend-driven queries and broader apparel categories, impacting attractiveness to prospective consumers relying on AI-generated recommendations.
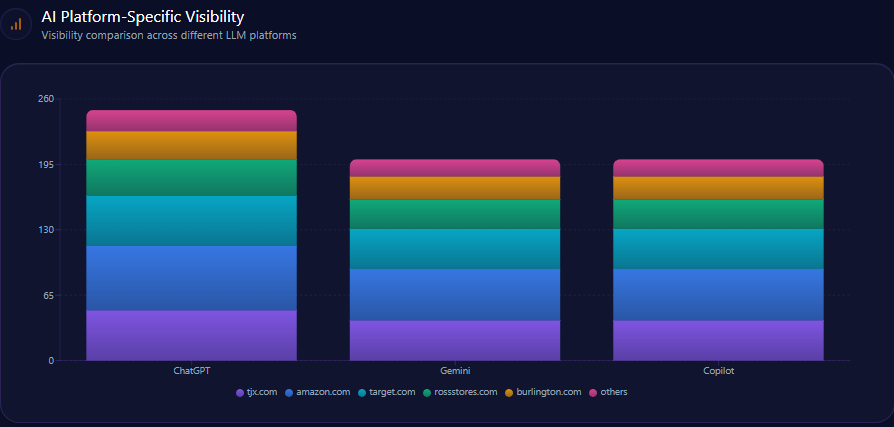
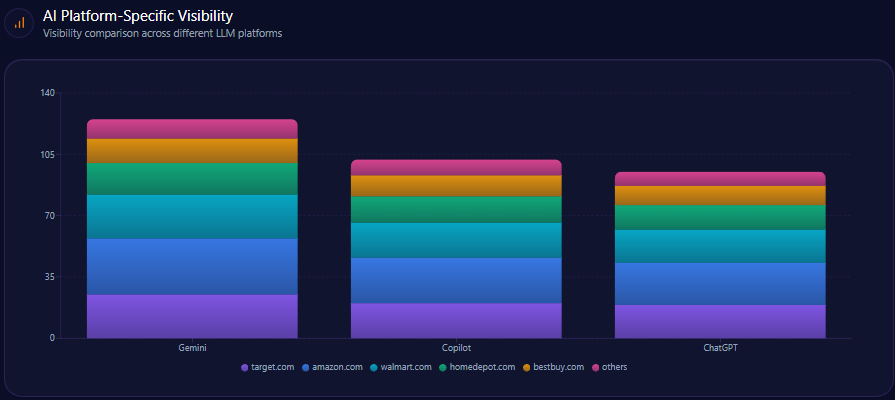
AI Platform-Specific Visibility
| Platform | Visibility % | Share of Voice % | Total Mentions |
|---|---|---|---|
| ChatGPT | 13 | 13 | 149 |
| Copilot | 13 | 13 | 152 |
| Gemini | 11 | 11 | 146 |
| Others | 9 | 9 | 39 |
Gap’s lowest visibility on the AI platforms is on Gemini at 11%, a platform where real-time inventory and shipping speed data enhances visibility. Addressing this deficit is critical for reclaiming authority among active shoppers and trend-focused AI queries.
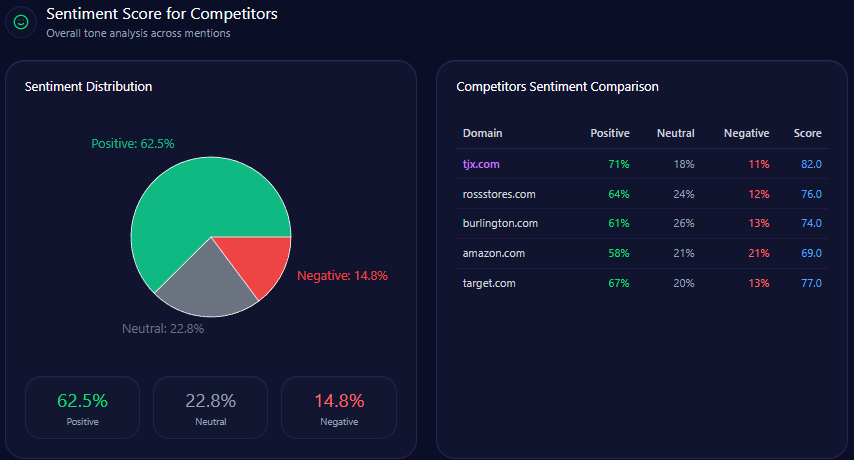
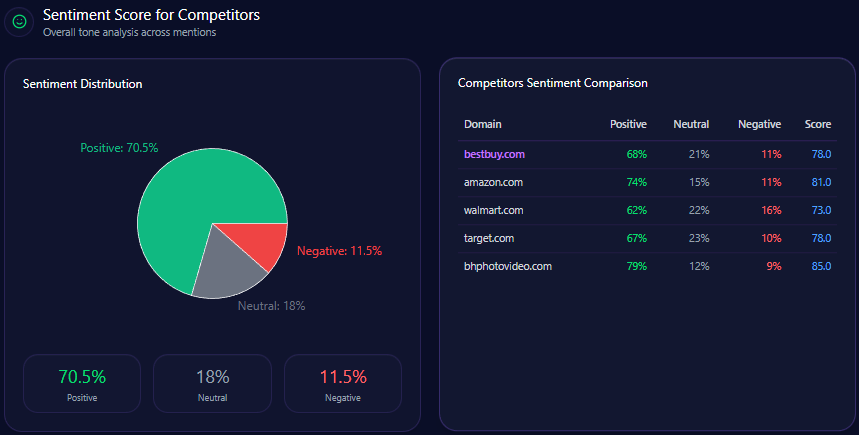
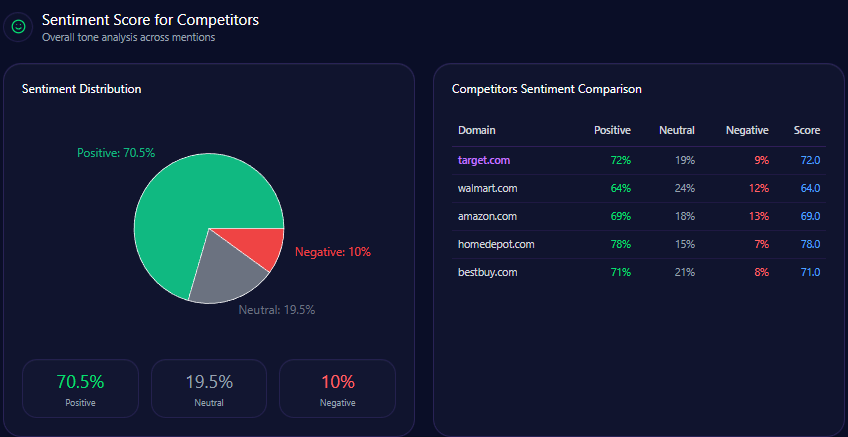
Sentiment Score for Competitors
| Brand | Positive % | Neutral % | Negative % | Overall Score |
|---|---|---|---|---|
| Gap | 62 | 25 | 13 | 75 |
| TJX Companies | 74 | 19 | 7 | 84 |
| Inditex | 71 | 16 | 13 | 79 |
| Target Corporation | 69 | 20 | 11 | 79 |
| H&M Group | 58 | 24 | 18 | 70 |
Gap’s sentiment score of 75 positions it above H&M ( 70 ) but below TJX ( 84 ), Inditex, and Target ( 79 each). This middle-tier sentiment imbues a cautiously positive brand perception, buoyed by leadership narratives and quality-for-value appeal, but constrained by mixed operational and sustainability discourse.
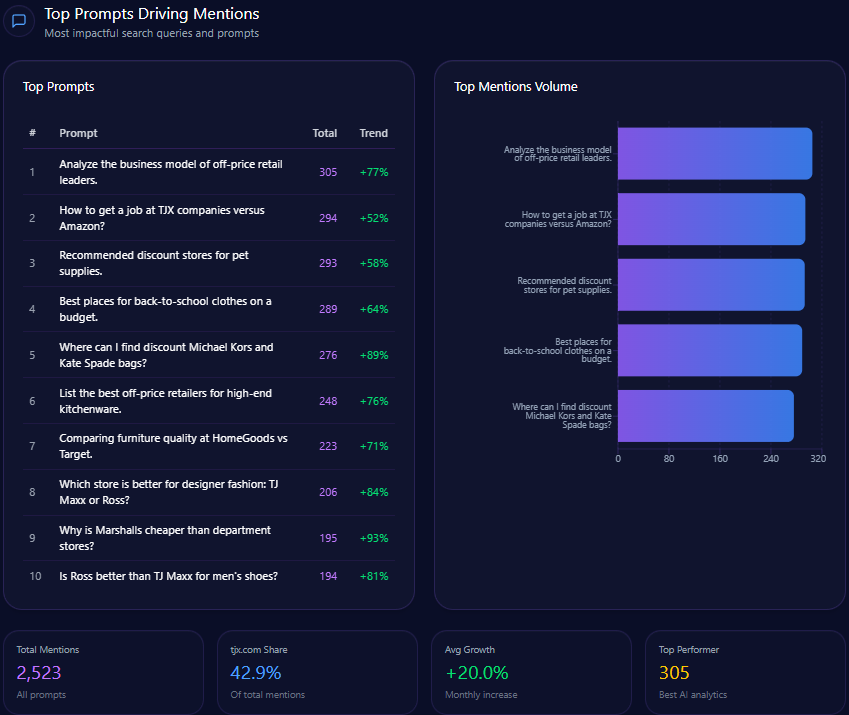
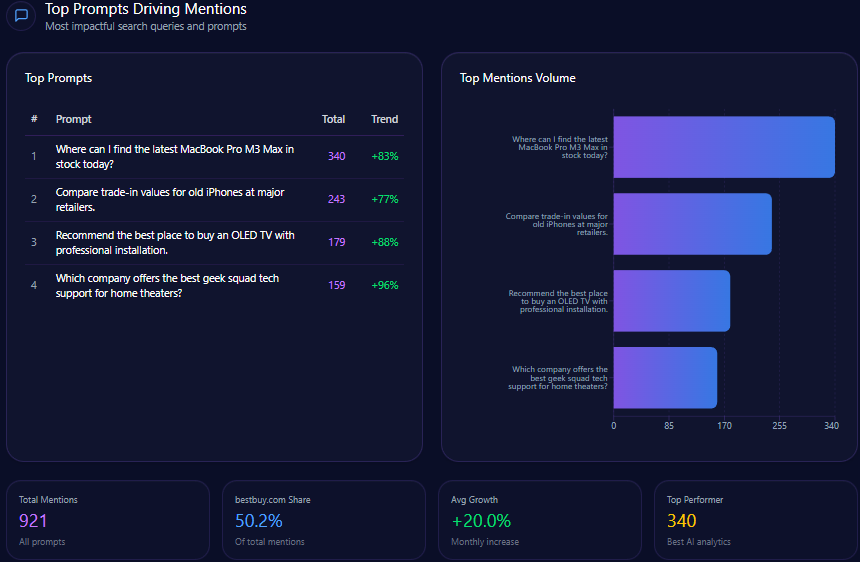
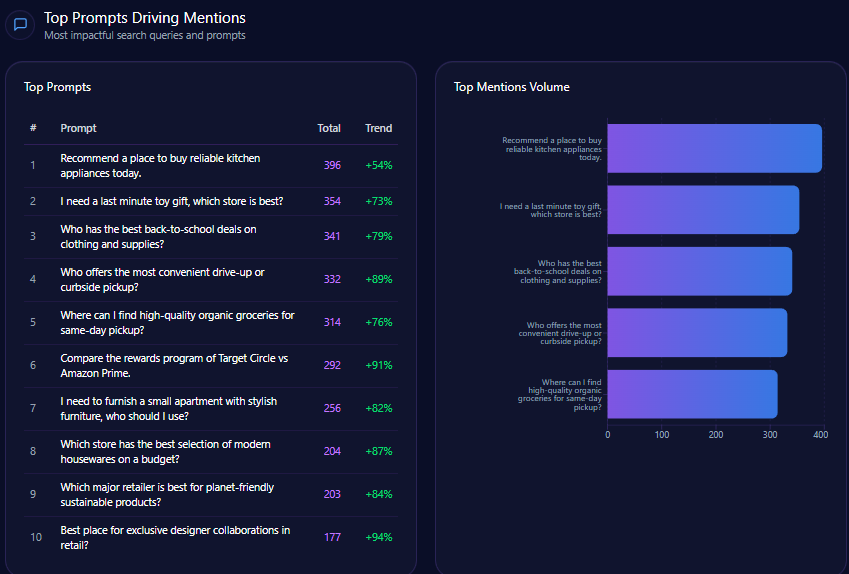
Top Prompts Driving Mentions
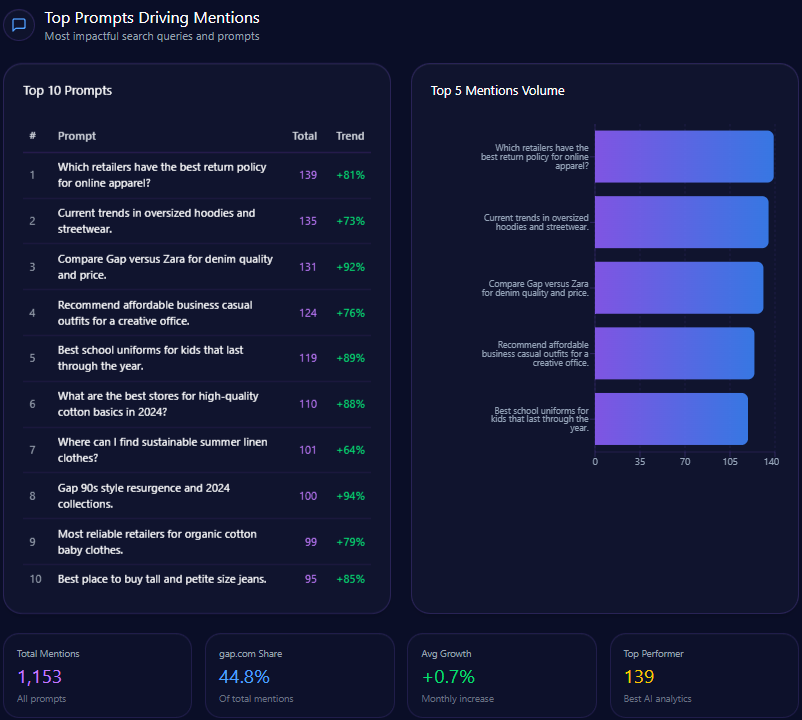
- 49 mentions related to “best return policy for online apparel,” outpaced by 72 for Target and 18 for TJX Companies.
- 34 mentions in “current trends in oversized hoodies and streetwear,” versus 59 for Inditex and 42 for H&M Group.
- Strong showings in comparison themes such as “Compare Gap versus Zara for denim quality and price,” with Gap leading at 68 mentions over Inditex’s 63.
- Gap demonstrates niche dominance with 88 mentions for “Gap 90s style resurgence,” significantly ahead of TJX ( 12 ).
- Consistent visibility in “Best school uniforms for kids” ( 61 mentions) and “Most reliable retailers for organic cotton baby clothes” ( 53 mentions).
Types of Prompt Queries
- Feature Inquiry: 50% across 5 key prompts, indicating demand for detailed product understanding.
- Comparison: 40% coverage, reflecting competitive positioning as a key consumer consideration factor.
- Research queries at 10%, with absence in Purchase Intent and How-to/Tutorial categories, suggesting opportunity to develop transactional prompts.
Service / Product-Level Sentiment
- Brand Turnaround: 29% frequency with optimistic sentiment reflecting positive CEO impact.
- Sustainable Basics: 20% frequency with positive sentiment, but limited by comparative sustainability visibility gaps.
- Logistics and Delivery: 15% frequency with mixed sentiment, highlighting persistent user concerns over fulfillment.
- Affordability & Value: 36% frequency with very positive perception, supporting Gap’s positioning as a value leader in certain apparel segments.
Conclusion
Gap.com currently occupies a transitional position within the generative AI landscape, with GEO analytics indicating leadership in legacy denim authority and encouraging positive sentiment tied to executive leadership. However, clear deficiencies exist in agility and trend responsiveness relative to Inditex and Target, which dominate trend-forward and operational fulfillment metrics.
The quantitative gaps — notably the 55-point deficit in ‘European fashion trends’ authority and the 32-point operational visibility gap on rapid shipping — materially constrain Gap’s capacity to fully leverage generative AI recommendation engines as a growth vector.
Addressing these gaps requires prioritized investment in advanced schema markup for real-time inventory and delivery data, enhanced sustainability disclosures with specific recycled material percentages, and content innovation targeting modern business casual and fast fashion aesthetics. Establishing these operational and strategic pillars will enable Gap to improve its competitive share in LLM brand mentions and operationalize positive leadership momentum for sustained market relevance.
Explore SpyderBot to operationalize these GEO analytics insights.