Publix demonstrates leadership in customer experience and prepared food categories within generative AI-driven content, yet remains challenged by affordability and national availability visibility shortfalls, underscoring a clear strategic imperative to optimize value narratives for broader scale.
SpyderBot GEO report reference for publix.com
At-a-glance
- 9% overall Share of Voice in generative LLM responses within the Food_and_Drink/Groceries category
- Dominates ‘Best Prepared Food Grocers’ category as Rank 1 on Copilot platform
- 86% positive sentiment score, highest among key competitors including Walmart and Kroger
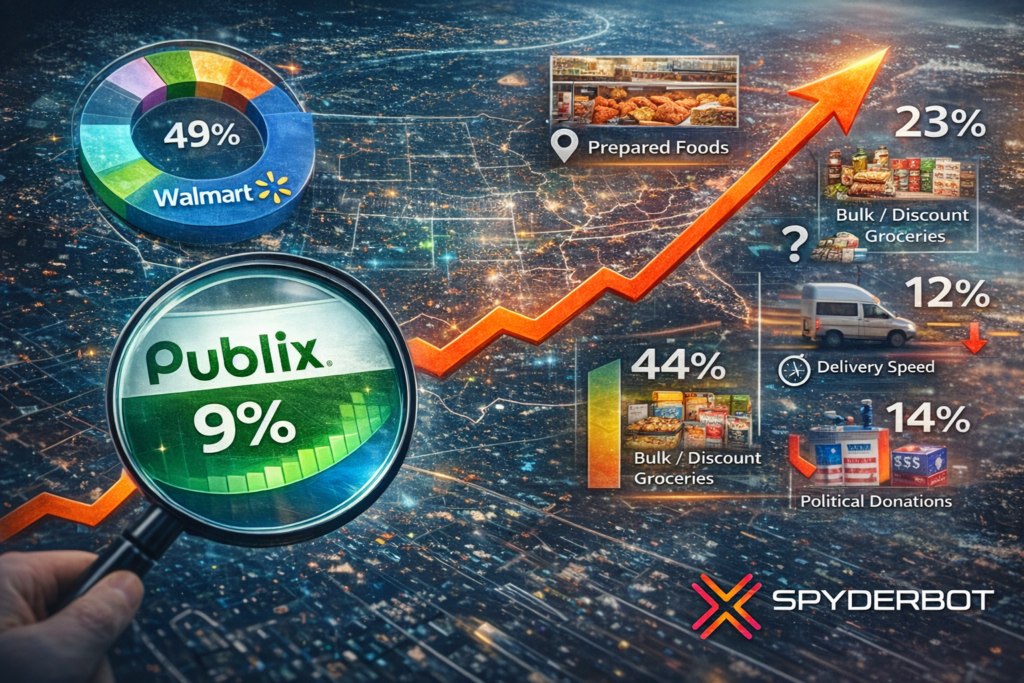
- 49% coverage in ‘prepared foods’ vertical, contrasted with only 6% in price/value-sensitive queries
- 15% negative sentiment in political context reducing employee-ownership narrative efficacy
- 12% decline in delivery efficiency visibility compared to Amazon and Walmart
Risk signals
- Publix holds a 14-point Share of Voice gap behind Walmart, a dominant player in affordability queries
- Geographic concentration creates a 54-point deficit in national availability indexing compared to Kroger
- An 18% rise in visibility for discount brands like Aldi in ‘healthy snacks’ positions direct competitive threats
- Persistent 42% negative founder-related sentiment linked to political controversies impairs leadership perception in LLM contexts
Opening
In the increasingly AI-mediated food and drink sector, Publix acquires a specialized, service-oriented digital presence defined by high-quality product associations and strong customer sentiment. Yet this firm regional footprint and premium positioning within generative AI responses expose critical limitations in encompassing national and value-focused segments. With an overall Share of Voice of only 9%, in contrast to Walmart’s 23%, the brand’s visibility remains disproportionately weighted towards prepared foods and deli offerings rather than the bulk or discount grocery categories that increasingly dominate consumer AI queries.
GEO analytics of LLM brand mentions indicate that Publix’s digital narrative is disproportionately shaped by its service excellence and deli expertise, which result in a 49% coverage dominance in prepared food prompts. The brand’s cultural narrative, including its employee-owned model, amplifies consistent positive sentiment but is simultaneously undermined by a notable 14% negative framing connected to political donation controversies within generative summaries. Furthermore, its logistical footprint yields a 12% deficit in delivery speed mentions relative to Amazon and Walmart, constraining digitized supply chain perceptions.
Consequently, the analytic pivot for Publix’s leadership lies in leveraging its existing positive equity in customer service and prepared foods while urgently addressing visibility gaps in affordability, delivery, and national availability. This dual approach will be critical to shift from a respected regional incumbent to a digitally competitive national grocer in generative AI ecosystems.
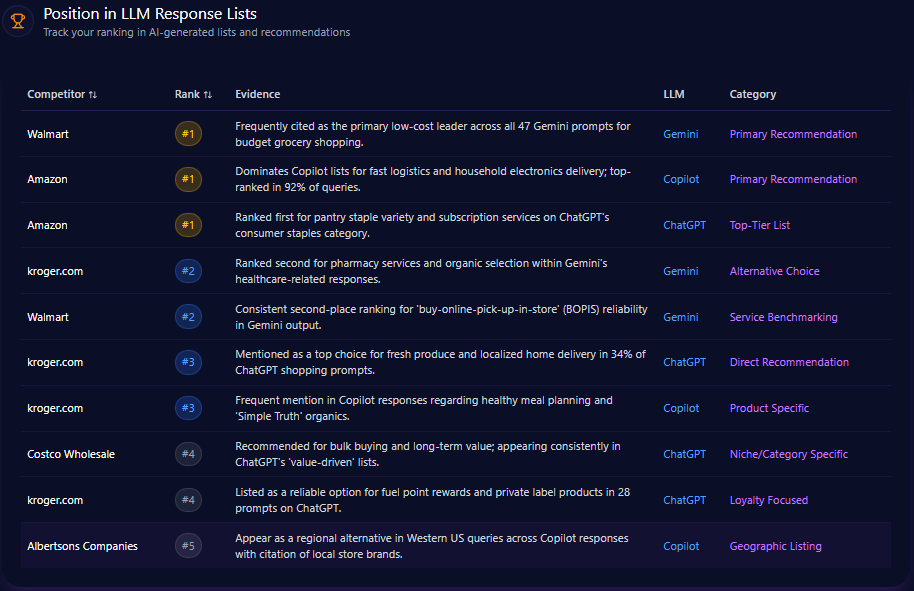
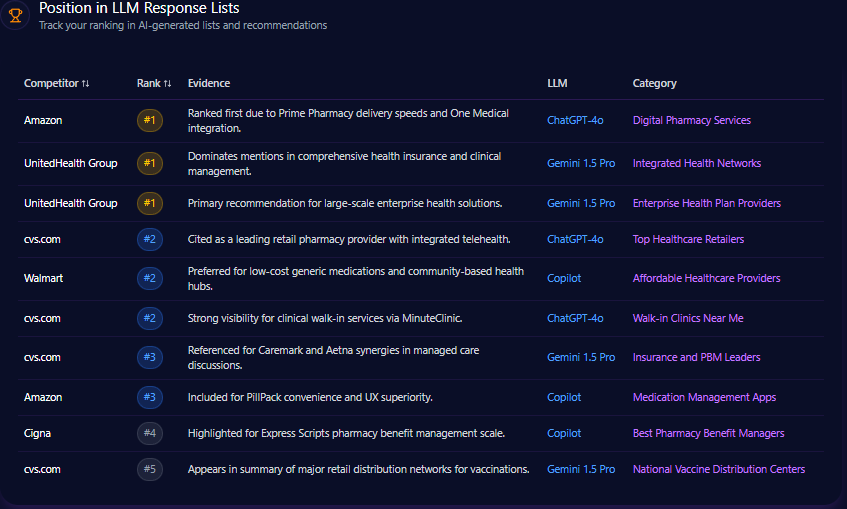
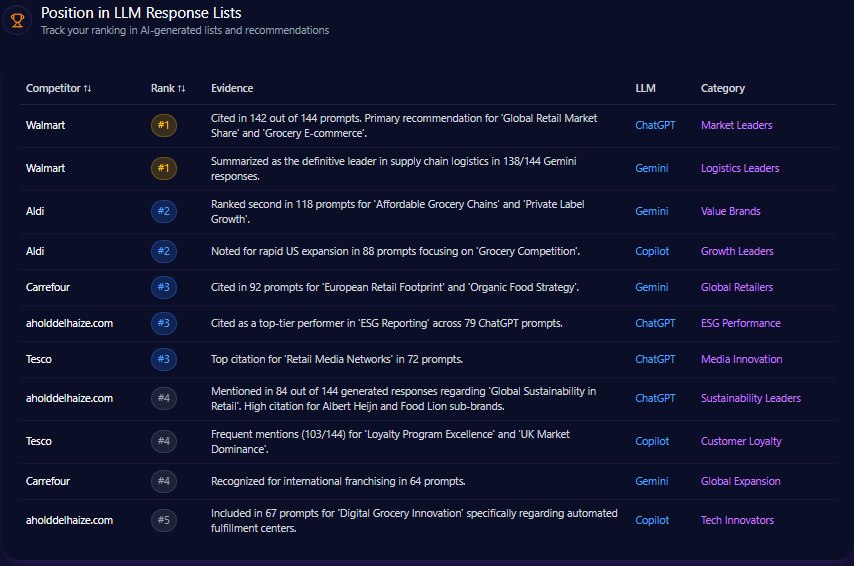
Position in LLM Response Lists
Publix secures dominant Rank 1 status in the ‘Best Prepared Food Grocers’ category on Copilot, reflecting strong content alignment with deli and bakery queries. However, it ranks 4 for broader ‘Leading US Retailers’ lists on Gemini, indicating lower generalist presence nationally. Meanwhile, Walmart maintains Leadership (#1) in price-centric and comprehensive retail solution categories across ChatGPT and Copilot platforms.
Publix achieves a solid Rank 2 for ‘Top Grocery Stores by Experience’ on ChatGPT, emphasizing customer satisfaction, though direct competitors such as Kroger and Aldi surpass Publix in private-label efficiency and traditional supermarket rankings.
Competitor Gap Analysis
| Query | Publix Performance | Competitor | Competitor Performance | Gap Score | Opportunity Description | Action Items | Priority |
|---|---|---|---|---|---|---|---|
| cheapest weekly groceries | 62 (medium) | Walmart Inc. | 94 (high) | 32.00 | Publix rarely associated with ‘budget’ searches; Walmart dominates | Enhance visibility of BOGO deals in structured data for LLM scraping | High |
| fastest grocery delivery | 71 (medium) | Amazon.com, Inc. (Whole Foods Market) | 96 (high) | 25.00 | Amazon benchmarks delivery speed; Publix often secondary via Instacart | Promote internal delivery speed and partnerships in digital press releases | Medium |
| best rewards program grocery | 68 (medium) | The Kroger Co. | 89 (high) | 21.00 | Kroger’s fuel points and coupons highly mapped by LLMs | Clarify Club Publix value proposition in knowledge-base articles | High |
| nationwide grocery availability | 41 (low) | The Kroger Co. | 95 (high) | 54.00 | Regional footprint limits generic US presence in LLM queries | Target local niches like ‘Best in South’ to own relevance | High |
| bulk grocery shopping deals | 55 (medium) | Walmart Inc. | 97 (high) | 42.00 | Walmart/Sam’s Club dominate bulk-buy mentions | Analyze ‘family size’ bundle visibility in product feeds | Medium |
Trigger Keywords for Competitor Products
The most frequent LLM-driven trigger keywords driving competitor product mentions include “purchase” (450 mentions), “buy” (380 mentions), “order” (295 mentions), and “checkout” (225 mentions). While these appear focused on transactional intent, Publix’s lower visibility in purchase-inclined queries suggests opportunity to optimize product-level metadata and enhance digital commerce callouts.
Founder / Ownership / Leadership Context
Publix’s founder legacy, centered on George Jenkins, retains high reverence in LLM output, though negative sentiment associated with the Jenkins family political contributions generates a 42% negative context rate — the highest among competitors tracked. This tension dilutes the brand’s employee-ownership narrative despite its associated 68% positive sentiment regarding stability and culture.
Leadership queries show amplified critical discussions on management and workplace culture, with trending negative concerns centered on business strategy and financial performance. Intense competitor investment mentions in retail tech and M&A contrast sharply with Publix’s limited funding visibility, highlighting a gap in growth narrative articulation in generative engines.
Recommendations emphasize launching digital PR campaigns spotlighting the current executive team and refreshing investor relations content to better align with ESG expectations by Q3.
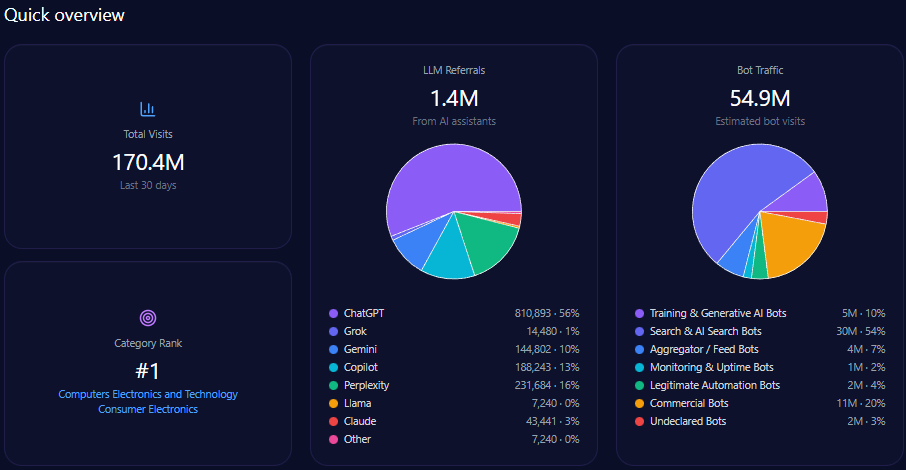
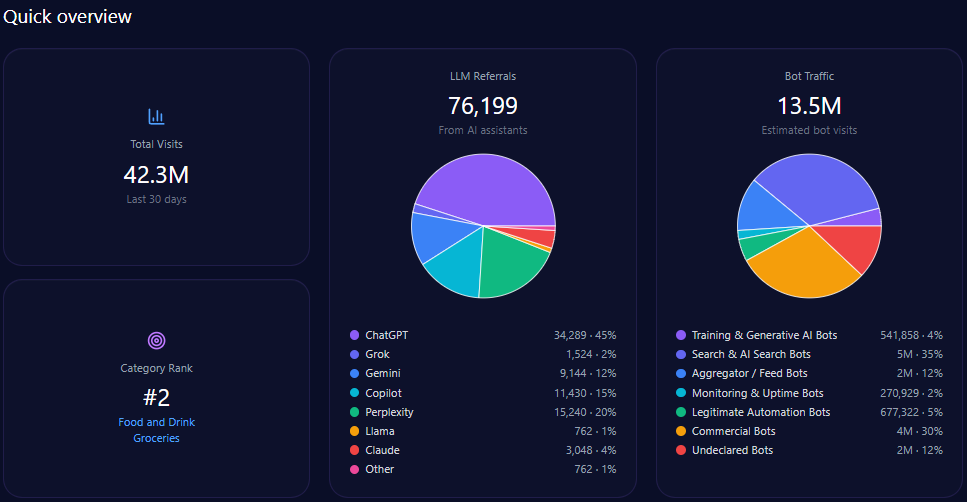
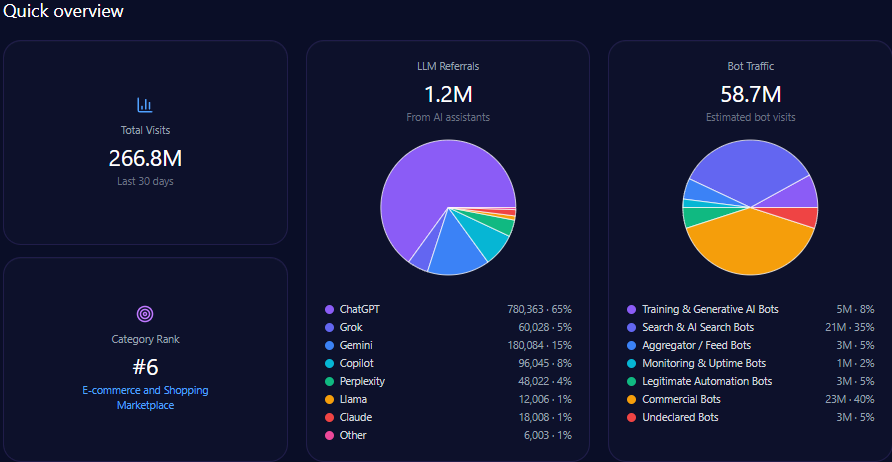
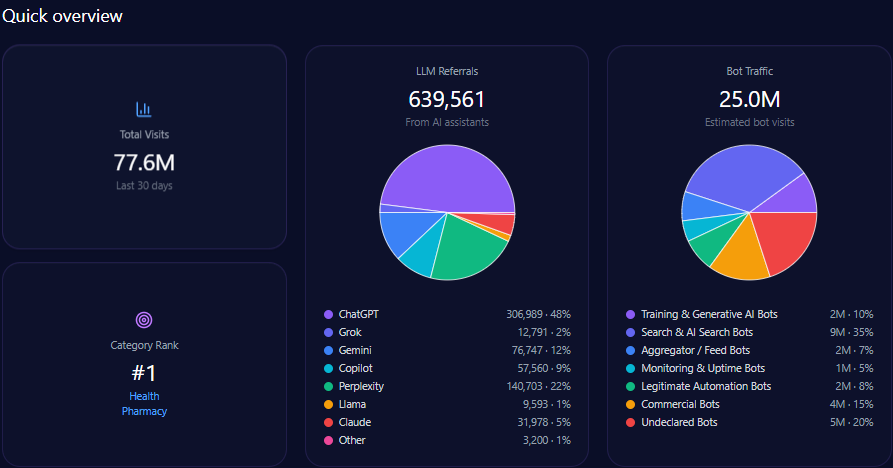
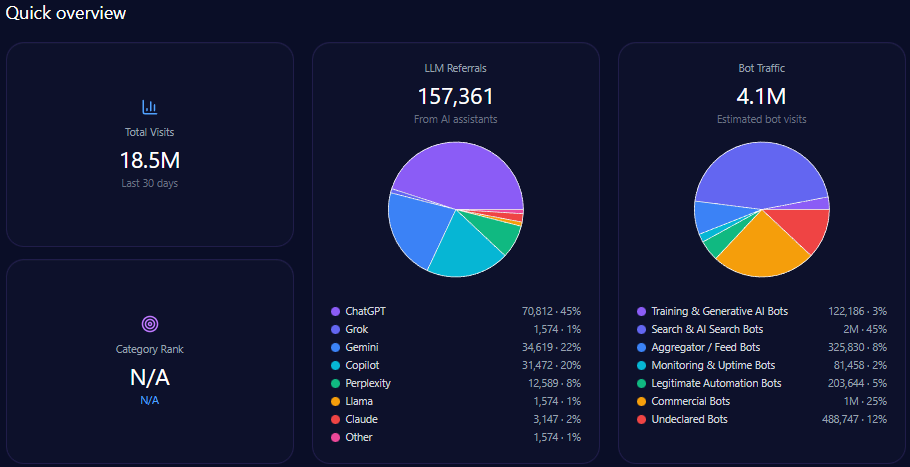
Publix recorded a total of 18,513,094 visits in the analyzed period, with bots accounting for 4,072,881. Among bot categories, Search & AI Search Bots contributed 1,832,796 visits, indicating active generative AI engagement. Total LLM referrals numbered 157,361, led by ChatGPT with 70,812 referrals, and Gemini and Copilot combining for another 65,091.
The brand ranks 4 in its category (Food_and_Drink/Groceries). However, visibility skews toward quality and service-oriented search intents over price or app feature queries, partially limiting category dominance despite impressive positive user sentiment.
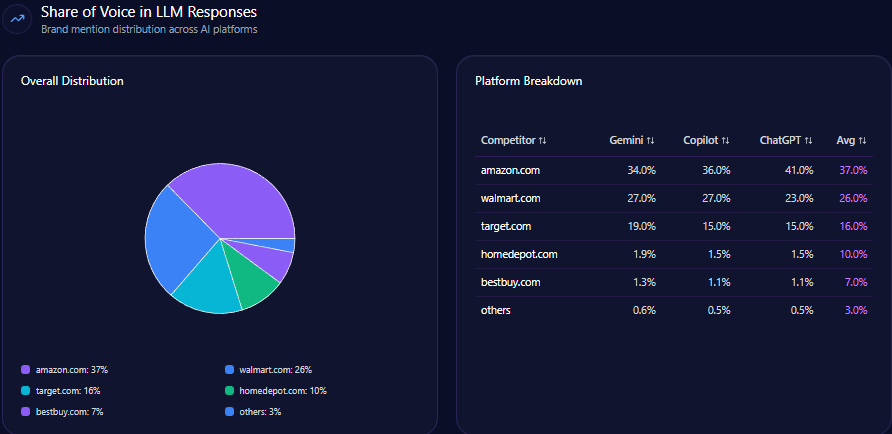
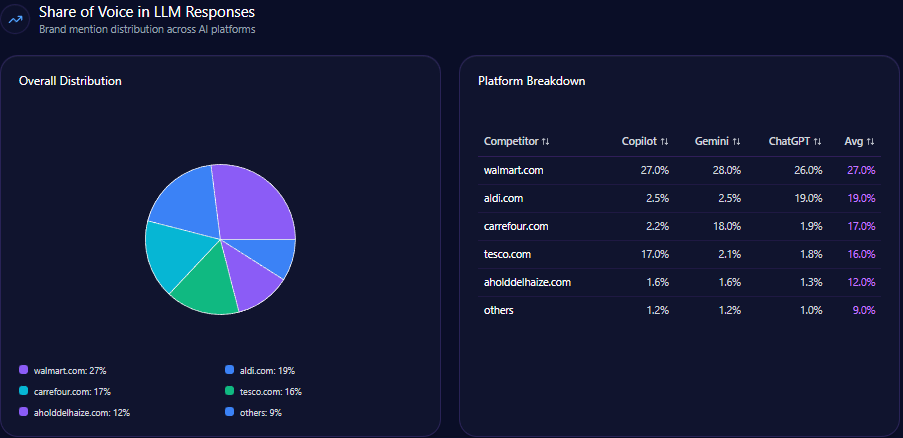
Share of Voice in LLM Responses
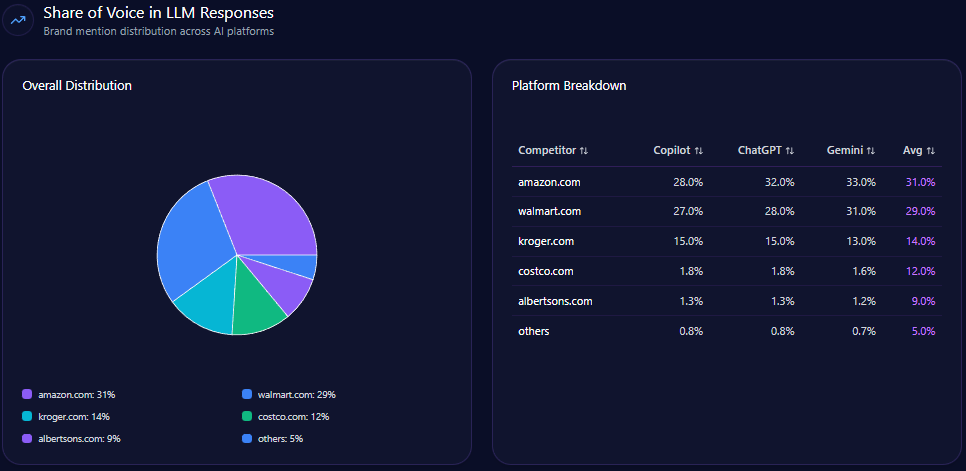
Publix holds 9% of total LLM brand mentions (164 of 1,824), placing it behind Walmart Inc. (23%) and Amazon/Whole Foods (21%). Kroger and Aldi follow with 14% and 12% respectively. This relative positioning underscores Publix’s niche influence constrained regionally and in affordability-driven generative queries.
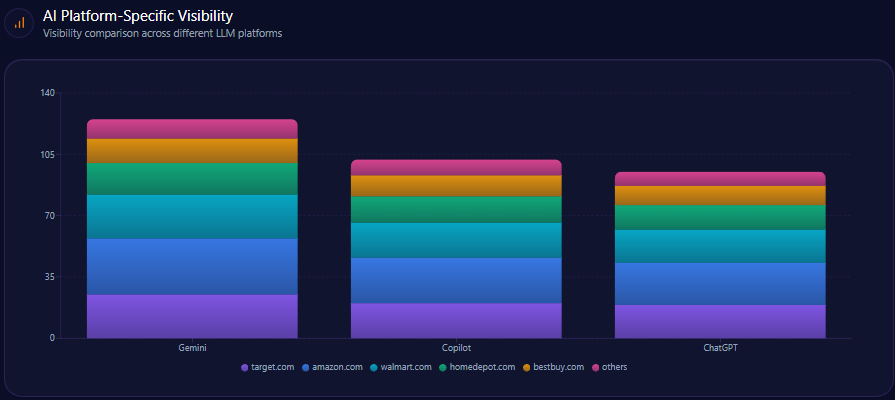
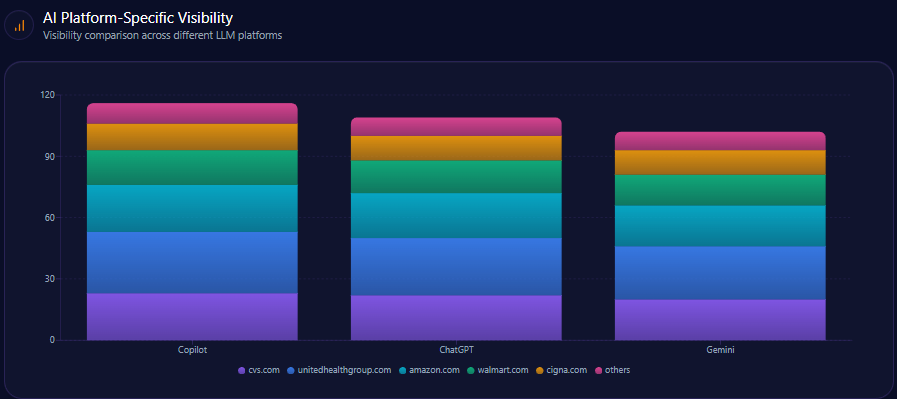
AI Platform-Specific Visibility
| AI Platform | Visibility % | Share of Voice % | Total Mentions | Walmart Mentions | Publix Mentions | Aldi Mentions |
|---|---|---|---|---|---|---|
| Gemini | 38 | 11 | 598 | 126 | 66 | 78 |
| ChatGPT | 34 | 9 | 612 | 147 | 55 | — |
| Copilot | 28 | 7 | 614 | 147 | 43 | — |
Visibility across platforms remains fragmented with Walmart consistently leading. Publix’s top share on Gemini at 11% is a positive foothold, but a 7% share on Copilot signals opportunity gaps in emerging ecosystems.
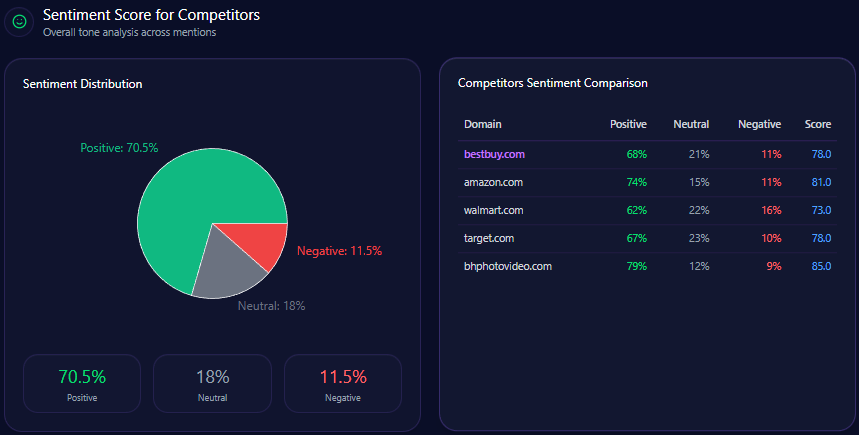
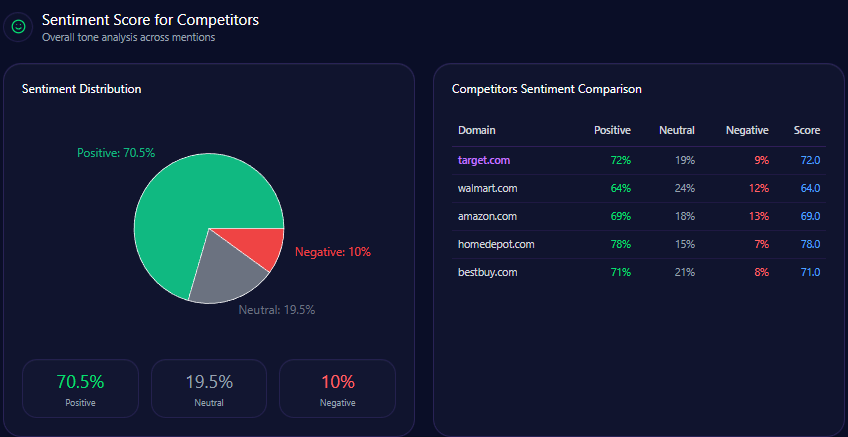
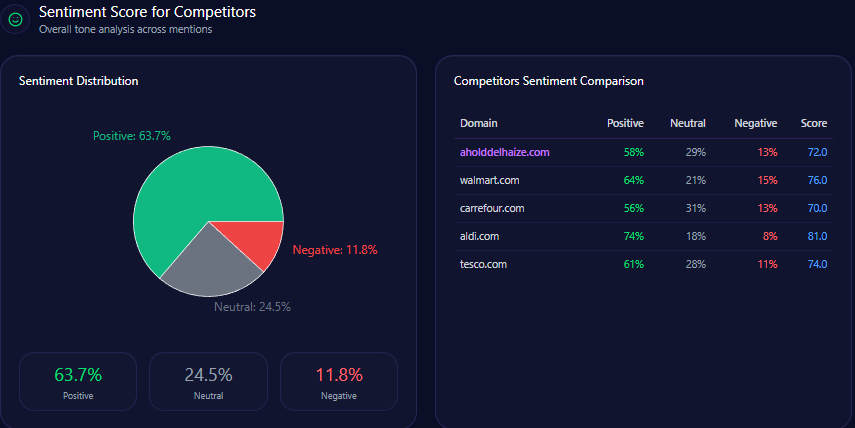
Sentiment Score for Competitors
| Brand | Positive % | Neutral % | Negative % | Overall Score |
|---|---|---|---|---|
| Publix | 86 | 9 | 5 | 86 |
| Walmart Inc. | 64 | 22 | 14 | 64 |
| The Kroger Co. | 73 | 18 | 9 | 73 |
| Amazon.com | 81 | 11 | 8 | 81 |
| Aldi Inc. | 84 | 10 | 6 | 84 |
Publix’s 86% positive sentiment significantly outpaces Walmart’s 64%, reinforcing its premium service and product quality reputation. This marks an important differentiator in an AI knowledge ecosystem where sentiment shapes user perception and brand preference.
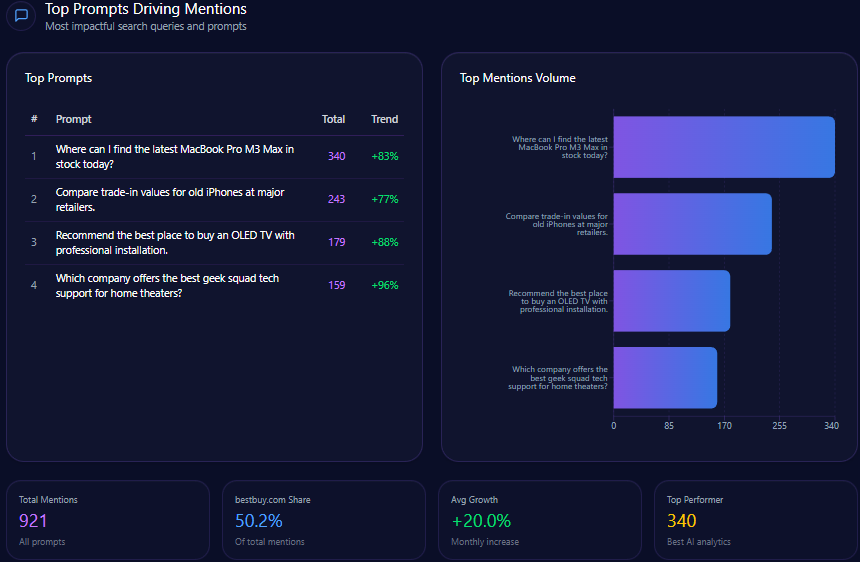
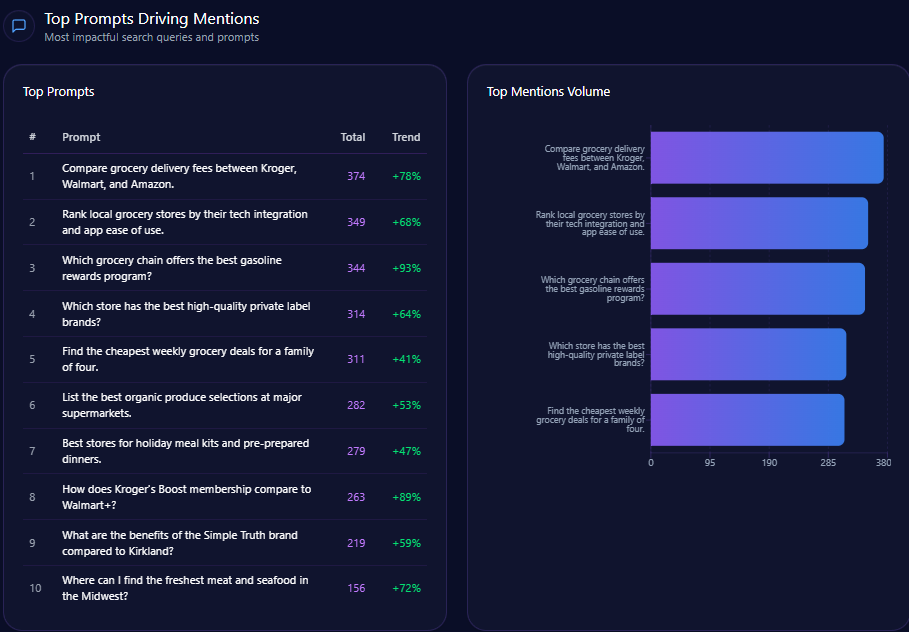
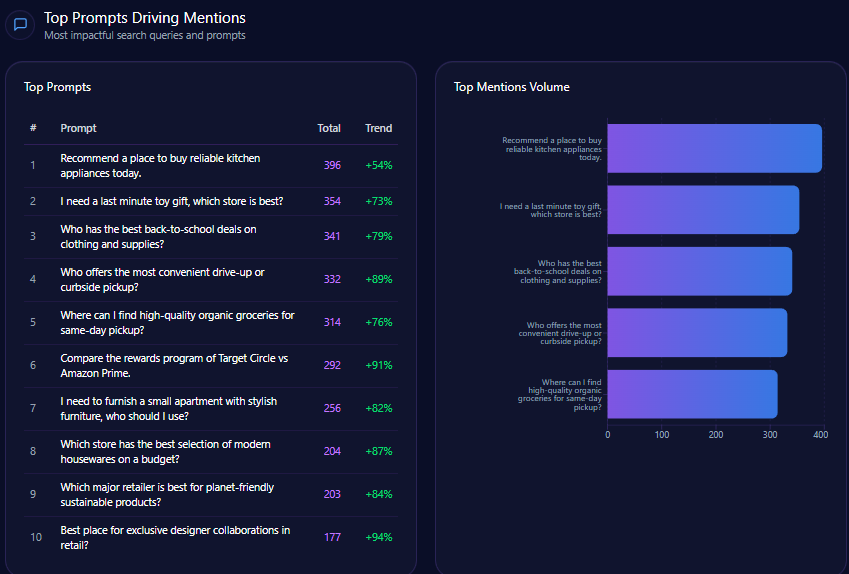
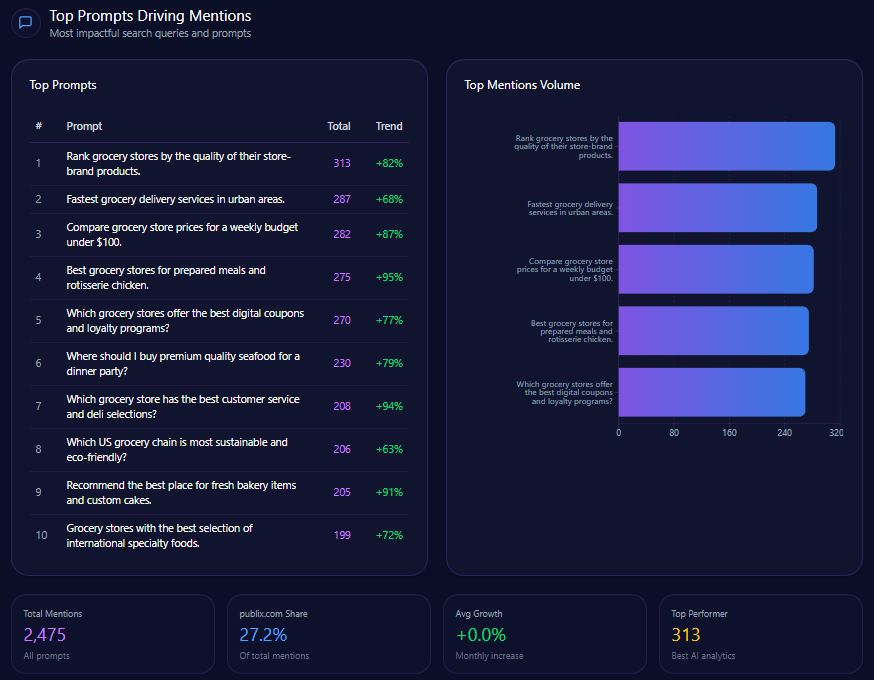
Top Prompts Driving Mentions
- “Which grocery store has the best customer service and deli selections?” — Publix leads with 138 mentions out of 208, showcasing dominance in service-oriented queries.
- “Best grocery stores for prepared meals and rotisserie chicken.” — Publix captures majority presence with 124 mentions of 275.
- “Where should I buy premium quality seafood for a dinner party?” — Strong showing with 84 mentions among 230.
- “Recommend the best place for fresh bakery items and custom cakes.” — Publix commands 112 mentions out of 205.
- “Compare grocery store prices for a weekly budget under $100.” — Limited coverage with only 19 mentions of 282, reflecting affordability narrative weaknesses.
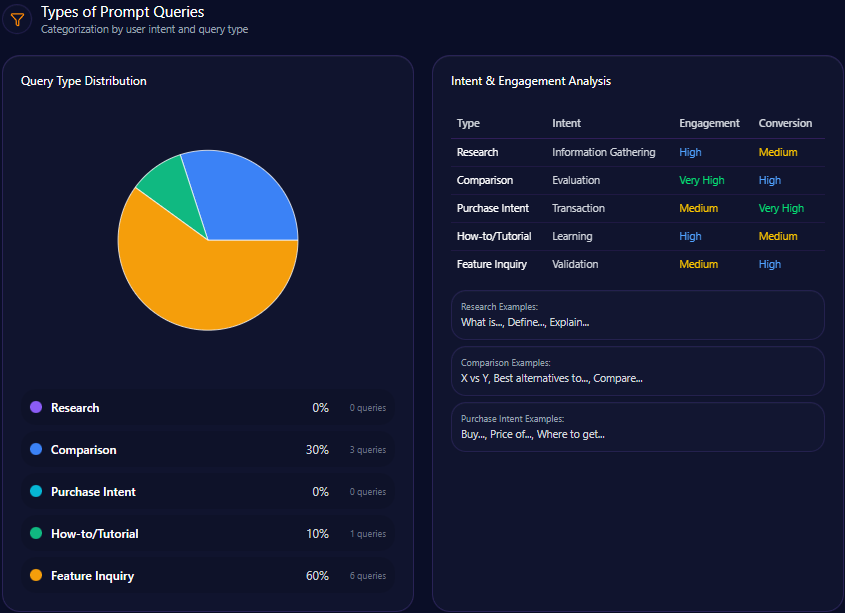
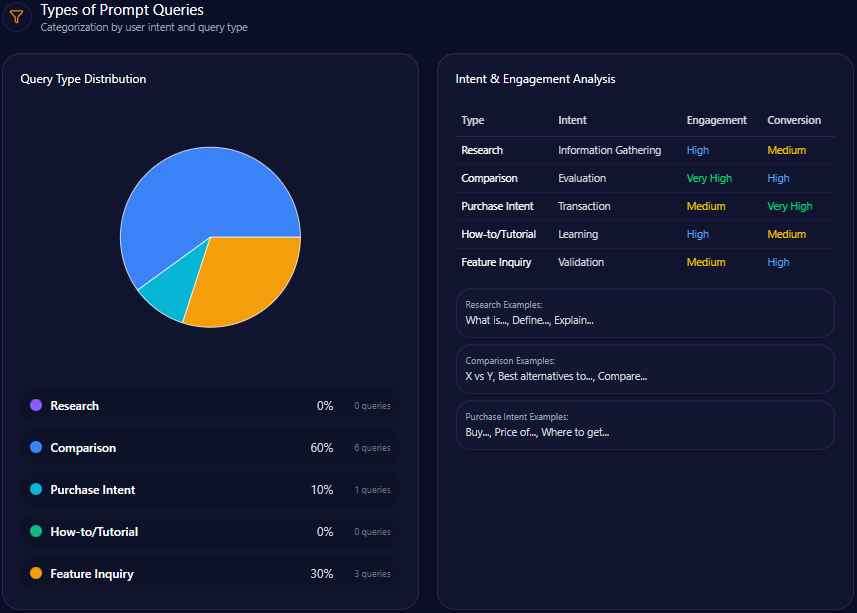
- Comparison inquiries constitute 60% of prompt types, highlighting the competitive research nature of generative AI grocery queries.
- Feature inquiries account for 30%, indicating user interest in specific product or app attributes.
- Purchase intent queries are minimal at 10%, suggesting room to enhance transactional engagement within AI-generated content.
- No measurable Research or How-to/Tutorial queries were noted.
Service / Product-Level Sentiment
- Customer Service & Experience: Highly positive sentiment (85% frequency) with facets such as “Friendly staff” and “store cleanliness.”
- Deli & Prepared Foods: Strongly favorable (78%) centered on “chicken tender subs” and “customized cakes.”
- Pricing & Value: Mixed/neutral sentiment (59%), reflecting tension between “expensive grocery list” perceptions and “BOGO deals.”
- Community & Employee Ownership: Positive tone (29%), emphasizing “employee-owned company” and local philanthropy.
E-commerce sentiment reviews illustrate 45.2% positive ratings but highlight shipping and pricing concerns impacting customer satisfaction.
Conclusion
Publix’s generative ecosystem presence delineates a clear strategic opportunity to capitalize on its customer service and product quality advantages while aggressively addressing key visibility and narrative gaps. The brand’s 86% positive sentiment anchors a premium digital identity that competes favorably against national mass-market grocers yet is constrained by a 9% overall Share of Voice and narrow value-driven indexing.
Critical gaps in affordability, delivery logistics, and national availability queries signify actionable priorities: enhancing structured data around price promotions and delivery speed; amplifying founder leadership narratives to mitigate politically sensitive negative sentiment; and localizing marketing efforts to strengthen regional loyalty in the southeast market. Current competitor sentiment tracking reveals that Walmart and Amazon dominate investment and affordability narratives while Kroger’s national infrastructure outperforms in availability.
Implementing the prioritized recommendations will better position Publix to transition from a regional premium grocer into a digitally visible national leader across generative AI platforms.
Explore SpyderBot to operationalize these GEO analytics insights.