SpyderBot has been recognized among the first set of winners in HackerNoon’s Proof of Usefulness Hackathon, marking an important milestone for the company as it continues to build analytics infrastructure for the AI Search era.
The official announcement was published by HackerNoon under the title “Proof of Usefulness Hackathon: First Set of Winners Announced.”
The Proof of Usefulness Hackathon is organized by HackerNoon and supported by Bright Data, Neo4j, Storyblok, and Algolia. The program recognizes software projects that demonstrate practical usefulness, real-world value, and measurable relevance beyond pitch deck promises.
SpyderBot was recognized under the Bright Data Awards category, reflecting the platform’s focus on GEO analytics, AI visibility, and LLM brand monitoring.
A Recognition Focused on Real-World Utility
The Proof of Usefulness Hackathon is built around a simple but important idea: useful products should solve real problems for real users.
In a technology landscape where many products are judged by vision, presentation, or early-stage hype, HackerNoon’s Proof of Usefulness framework places emphasis on practical value. It asks whether a product works, whether it addresses a real need, and whether it can create meaningful value for users.
For SpyderBot, this recognition is significant because it aligns directly with the problem the company is trying to solve.
Search behavior is changing. Users are no longer relying only on traditional search engines and blue links. Increasingly, they are asking AI systems for recommendations, comparisons, summaries, and vendor suggestions.
That shift creates a new visibility challenge for brands.
A company may rank on Google, but still be absent from AI-generated answers.
A brand may have strong website content, but still be misunderstood or underrepresented by large language models.
A competitor may appear more often in AI recommendations, even when another brand has stronger expertise, better positioning, or a more relevant product.
SpyderBot was built to help companies understand and monitor this new layer of visibility.
What SpyderBot Does
SpyderBot is a GEO analytics platform designed to help businesses track how AI systems understand, mention, and compare brands across generative search environments.
The platform helps teams monitor AI brand visibility, LLM mentions, competitor presence, prompt-level performance, sentiment, and how different AI models describe a brand across multiple contexts.
This includes visibility across AI systems such as ChatGPT, Gemini, Grok, Claude, Copilot, Perplexity, and other large language models.
At its core, SpyderBot helps brands answer two increasingly important questions:
What do LLMs mention about your competitors to users?
And how are LLMs analyzing and tracking your website?
These questions are becoming critical as AI-generated answers begin to influence how users discover products, evaluate companies, and make decisions.
Why AI Search Requires a New Measurement Layer
Traditional SEO has long focused on rankings, backlinks, organic traffic, and keyword visibility. These metrics remain important, but they no longer provide a complete picture of brand visibility.
In traditional search, a user sees a list of results and chooses which page to visit.
In AI Search, the answer is often generated directly. The AI system may summarize a market, recommend a short list of brands, compare competitors, or explain which solution best fits the user’s intent.
This means brands are no longer competing only for rankings. They are competing to be included, understood, and recommended inside AI-generated responses.
That is where Generative Engine Optimization, or GEO, becomes important.
While SEO focuses on search engine rankings, GEO focuses on how brands appear inside generative AI answers. It looks at whether a brand is mentioned, how it is described, what context surrounds the mention, which competitors appear nearby, and whether the brand’s positioning is accurately represented.
SpyderBot focuses on this emerging data layer, helping marketing, SEO, growth, and brand teams monitor their presence in AI-generated discovery journeys.
Supported by a Strong Technology Ecosystem
The Proof of Usefulness Hackathon is supported by Bright Data, Neo4j, Storyblok, and Algolia, bringing together important areas of the modern technology stack, including data infrastructure, graph technology, content architecture, and search experience.
This broader ecosystem makes the recognition especially relevant for companies building at the intersection of data, AI, and product usefulness.
SpyderBot’s recognition under the Bright Data Awards category reflects the growing importance of real-world data and AI-driven analytics in understanding how brands appear across generative systems.
As more users turn to AI tools for discovery and decision-making, brands will need more reliable ways to measure how they are represented across these systems.
A Milestone, But Only the Beginning
For SpyderBot, this recognition from HackerNoon is both a milestone and a starting point.
The company will continue developing its platform with a focus on practical insights, clearer analytics, and better support for brands entering the AI Search era.
SpyderBot’s goal is not only to help companies monitor mentions. It aims to help brands understand how AI systems interpret their identity, compare them against competitors, and surface them in response to real user questions.
The team also looks forward to continued trust, feedback, and support from users, partners, and businesses exploring GEO, AI visibility, and LLM brand monitoring.
The Bigger Signal for Brands
SpyderBot’s recognition in HackerNoon’s Proof of Usefulness Hackathon points to a broader shift in digital visibility.
Brands no longer need to focus only on being indexed by search engines. They also need to be understood by AI systems.
They no longer need to measure only where they rank. They also need to measure whether they are mentioned, how they are framed, and which competitors appear more often in AI-generated answers.
In the AI Search era, visibility is no longer only about traffic.
It is about being present in the answers that shape user decisions.
For SpyderBot, this milestone reinforces the importance of building tools for that future.
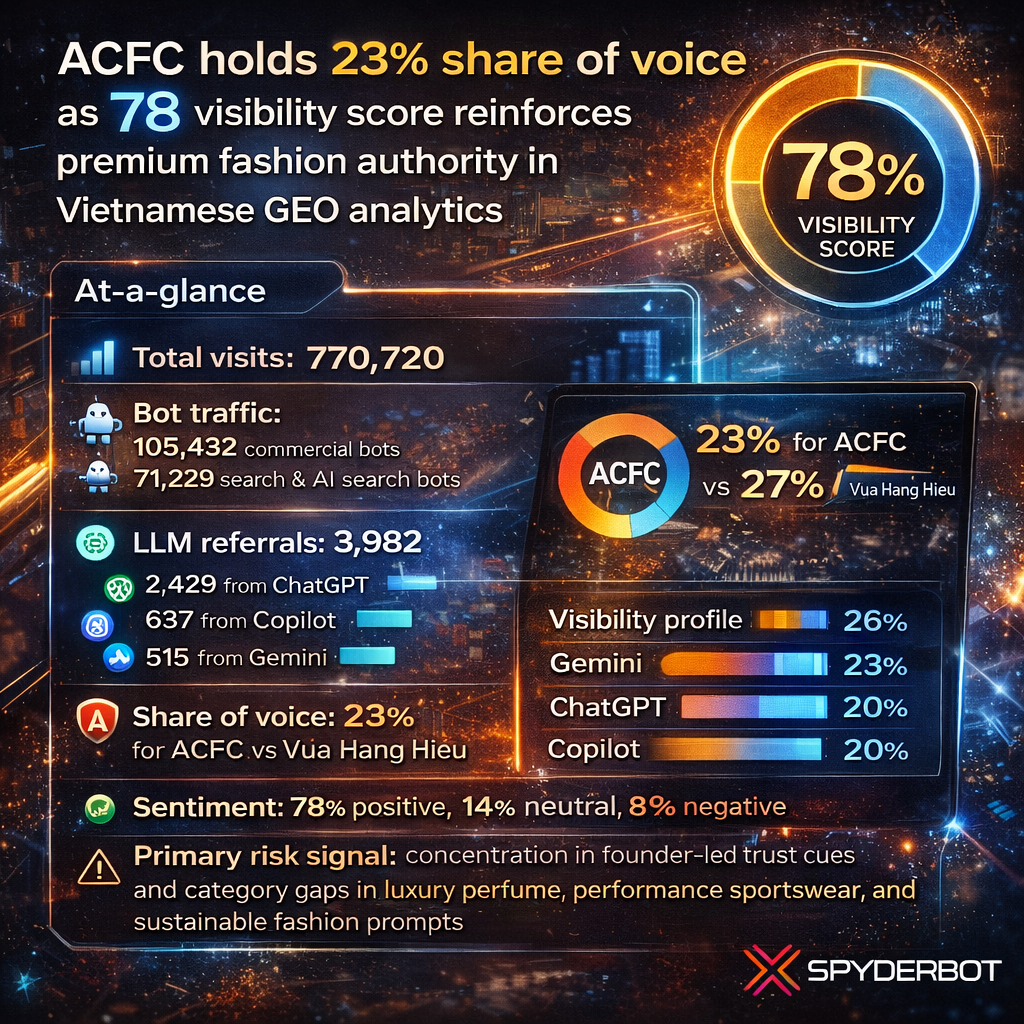
Despite commanding dominance in small business e-commerce and AI innovation prompts, Shopify confronts measurable gaps against competitors in B2B features, transactional transparency, and enterprise integrations, challenging its generative engine market position.
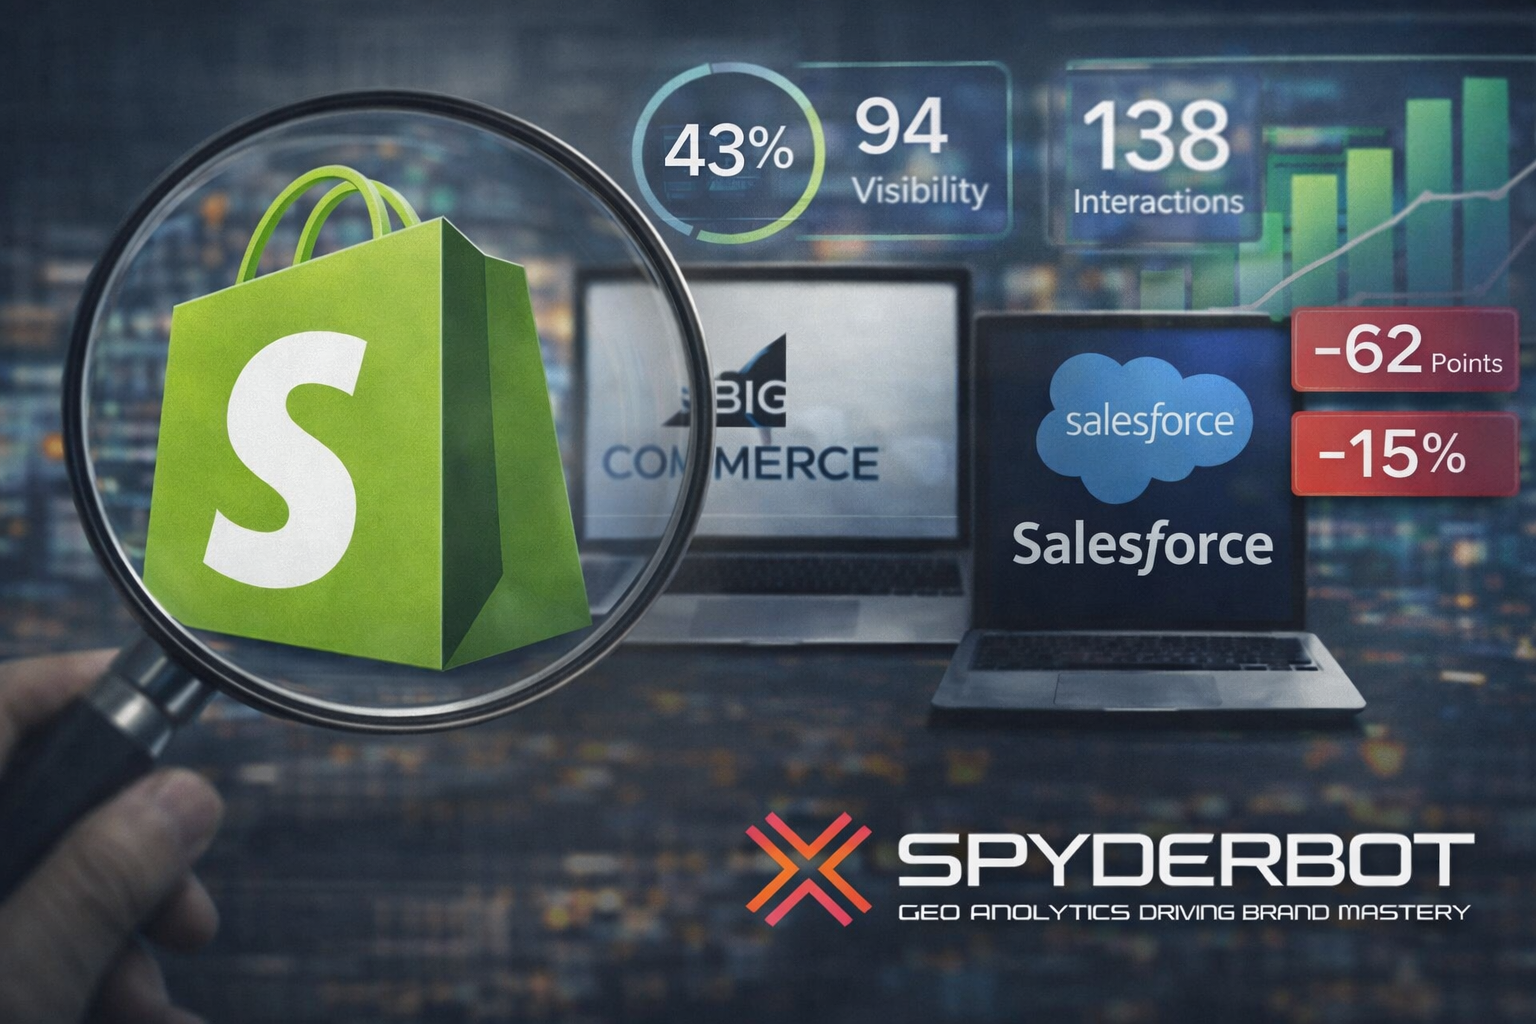
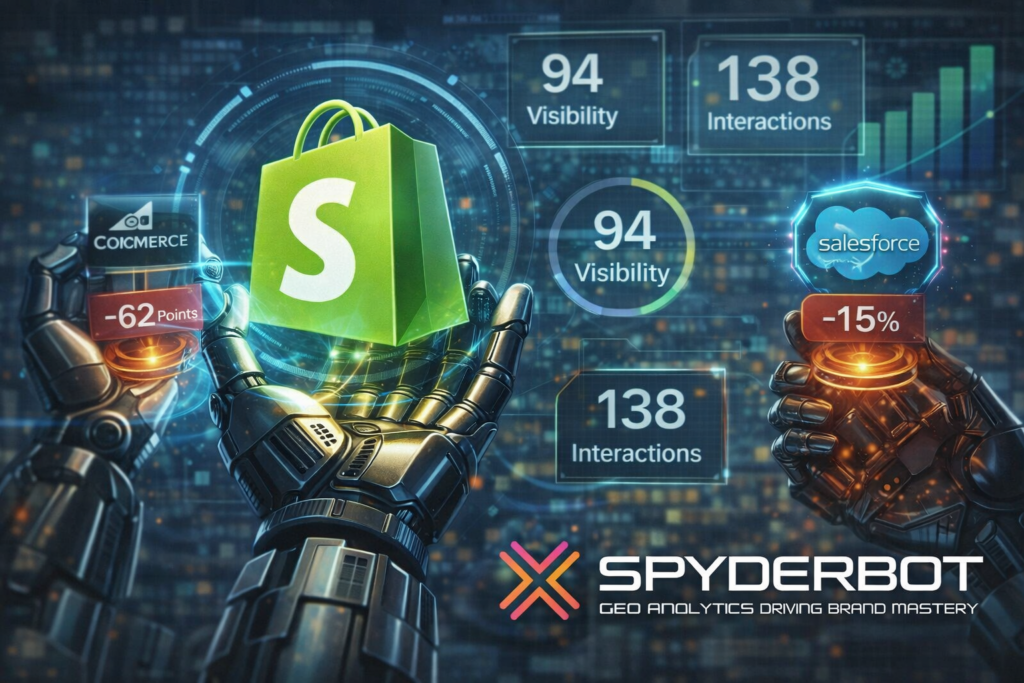
43% Generative Search Share, highest in the sector
94 Visibility Score across 138 LLM interactions
27% Share of voice in LLM brand mentions, leading but pressured by Wix (20%) and BigCommerce (15%)
Critical visibility gap of 62 points versus BigCommerce on transaction fee transparency
84 Overall sentiment score in LLM outputs, highest among peers
98% Visibility score on Copilot platform
Positive founder sentiment driven by Tobi Lütke’s product-led growth and AI integration narratives
Recommendations include technical documentation enhancement, transparency campaigns, and ERP partnership upgrades
Risk signals
62-point visibility gap on fee-related queries disadvantaging Shopify in price-sensitive segments
15% deficits against Salesforce and Adobe Commerce in enterprise omnichannel and ERP integration queries
Legacy founder-related negative sentiment at 14% linked to 2023 workforce reductions
Wix’s advancement in ‘Small Business Agility’ rankings threatens Shopify’s lead in that category
The current GEO analytics position of Shopify reveals a complex competitive landscape within the fast-evolving generative search and e-commerce ecosystem. Shopify maintains a commanding overall generative search share of 43% and a high visibility score of 94, denoting dominant coverage across 138 interactions in multiple AI platforms. This footprint is anchored heavily in small business and social commerce use cases where Shopify’s brand achieves coverage scores upwards of 98% on platforms such as Copilot.
However, the landscape is not without tensions. Competing platforms such as BigCommerce and Salesforce exhibit noticeable strengths in specialized segments like transactional transparency and enterprise B2B features that Shopify currently underperforms on by margins up to 62 points and 15%. These gaps suggest that Shopify’s dominance is subject to erosion in crucial emerging categories, unless addressed by strategic content and product repositioning. The existing legacy narrative around founder Tobi Lütke’s 2023 workforce reductions contributes negatively to sentiment analysis in 42% of founder-context discussions, which can dilute Shopify’s innovation narrative within LLM brand mentions.
For senior leadership, these patterns underscore the urgent need to both defend core small business strengths and aggressively counter competitor sentiment to sustain total market share in an increasingly complex category.
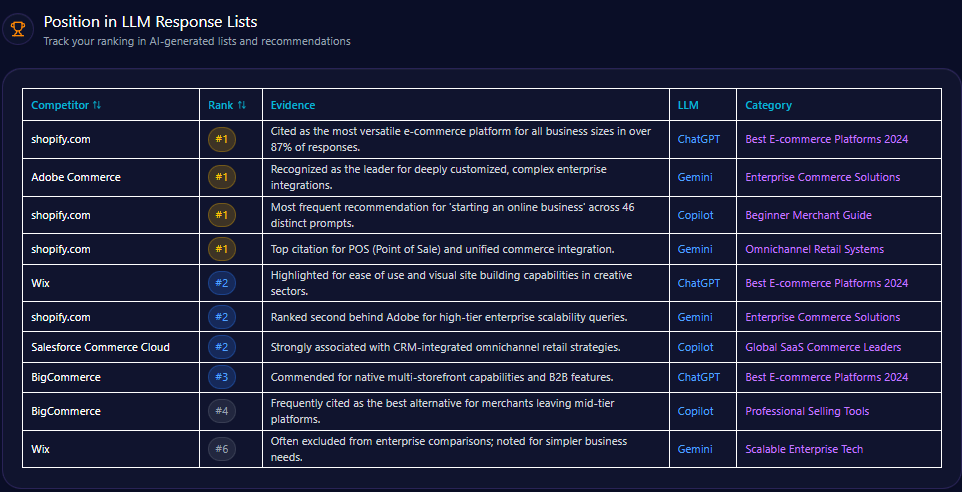
Position in LLM Response Lists
Shopify ranks first across multiple key LLM-generated lists. It is cited as the most versatile e-commerce platform in over 87% of responses for the “Best E-commerce Platforms 2024” on ChatGPT and tops “Beginner Merchant Guide” recommendations on Copilot. It holds primacy for POS and unified commerce citations on Gemini.
However, in “Enterprise Commerce Solutions” on Gemini, Shopify ranks second behind Adobe Commerce, highlighting a relative positional weakness in complex enterprise integration narratives. Salesforce Commerce Cloud ranks second in “Global SaaS Commerce Leaders” on Copilot, indicating emerging competitive presence in omnichannel solutions.
shopify.com’s Position in LLM Response Lists (Generated on March 20, 2026)
Competitor Gap Analysis
Query
Shopify Score
Competitor
Competitor Score
Gap
Opportunity
Priority
Headless commerce for global brands
81
BigCommerce
88
-7
Improve visibility for Hydrogen/Oxygen headless tools
High
B2B e-commerce features comparison
76
Salesforce Commerce Cloud
91
-15
Showcase B2B Wholesale capabilities
Critical
Transaction fees transparency
32
BigCommerce
94
-62
Implement transparency campaign on total cost of ownership
Critical
ERP integration for e-commerce
79
Adobe Commerce
94
-15
Deploy whitepapers on SAP partnerships
High
Trigger Keywords for Competitor Products
The report does not quantify trigger keywords for competitor products.
Founder / Ownership / Leadership Context
Founder Tobi Lütke’s mention frequency is notably high at 83% with a positive sentiment score of 80.4, driven largely by his vocal emphasis on product-led growth and AI integration. Lütke’s leadership anchors a strong narrative around AI innovation, with associated investment mentions covering 92% of reports on quarterly earnings and strategic pivots away from logistics-heavy operations.
Nevertheless, a legacy negative sentiment rate of 10.2% couples with residual perceptions of 2023 workforce reductions. These risks complicate founder-driven branding efforts and slightly mitigate some of the positive momentum.
Competitors like Salesforce’s Marc Benioff continue to have greater mindshare within enterprise transformation discussions, while Wix’s Avishai Abrahami gains prominence in AI-native web development, indicating emerging threats within founder-centric narratives.
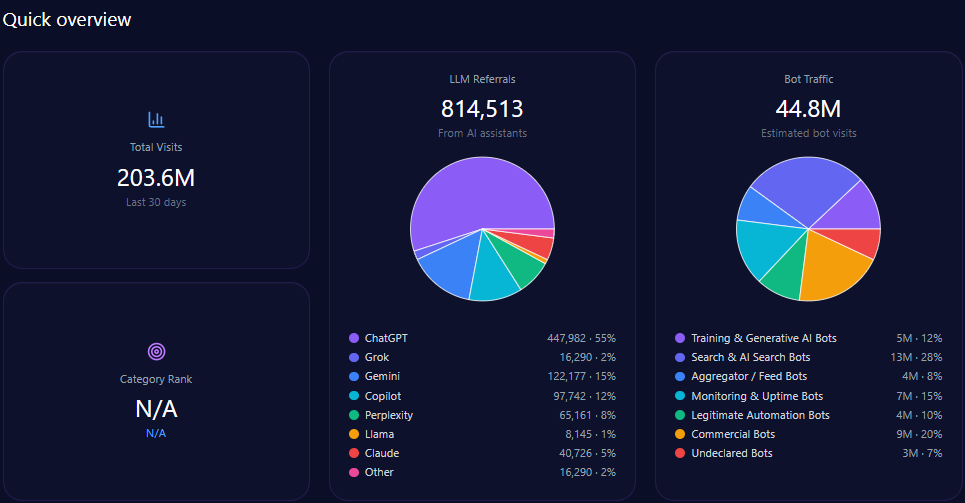
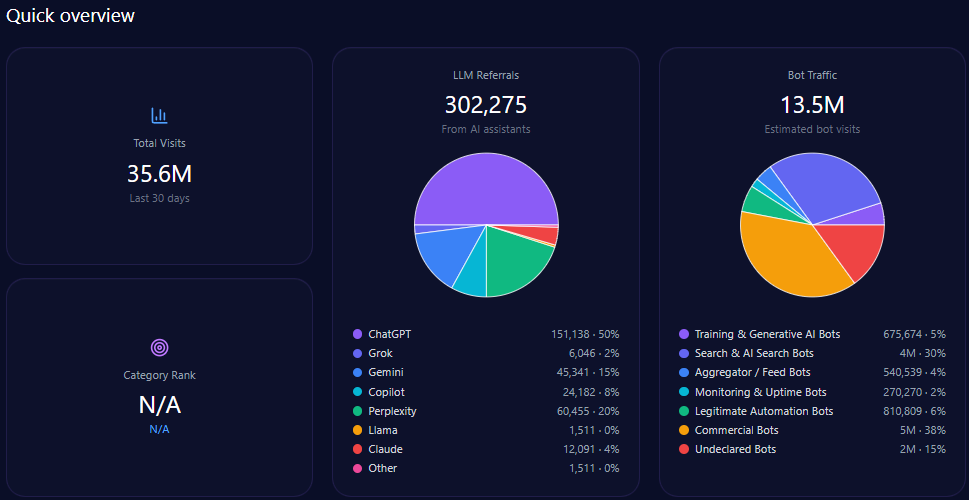
Quick overview
shopify.com’s Quick overview (Generated on March 20, 2026)
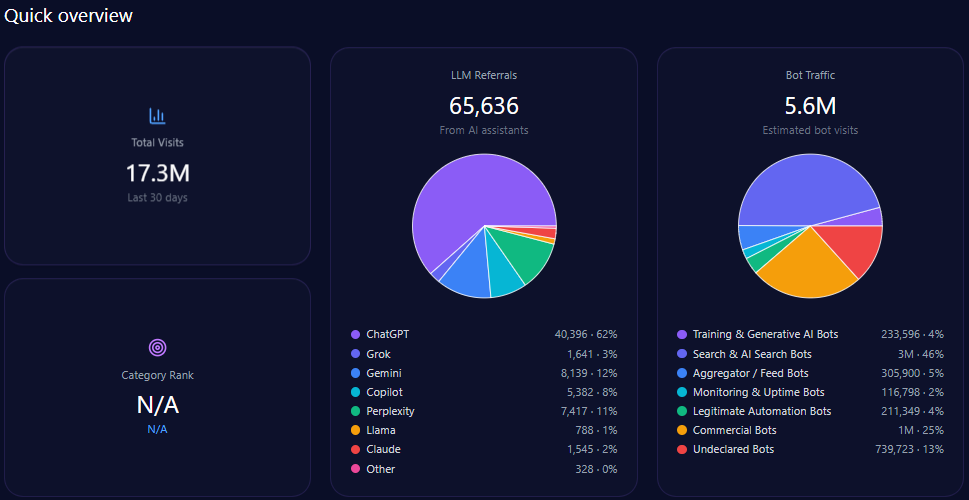
Shopify attracted over 203 million total visits, with bot traffic constituting approximately 44.8 million visits. Of these bots, key constituents include 5.4 million training & generative AI bots and 12.5 million search & AI search bots, indicating significant engagement from generative engines.
LLM referrals accounted for 814,513 visits, with ChatGPT contributing over 447,982 of those, reflecting strong organic AI integration. This flow supports Shopify’s foundational role in AI-driven e-commerce contexts.
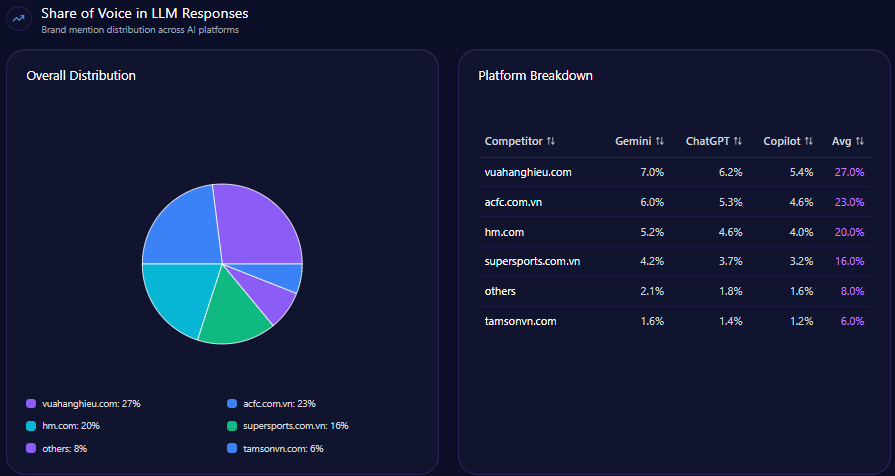
Share of Voice in LLM Responses
Shopify maintains a leading share of voice at 27% (132 mentions) among competitors, followed by Wix (20%) and BigCommerce (15%). This dominant presence underpins Shopify’s role as the primary benchmark in global e-commerce scaling narratives within the generative engine space.
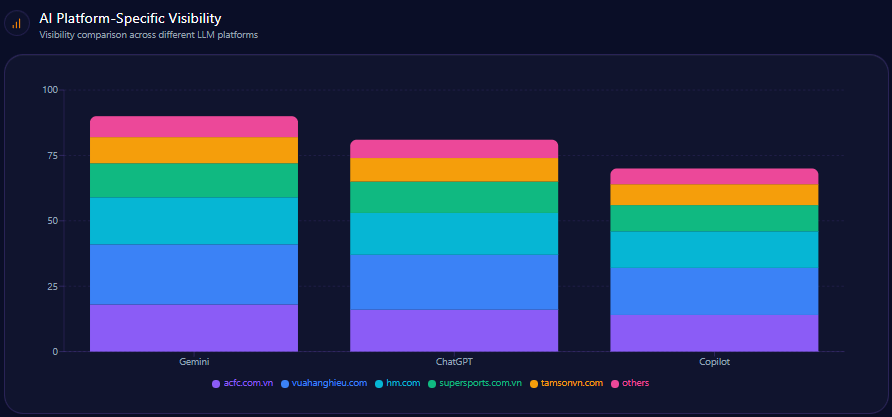
AI Platform-Specific Visibility
Platform
Visibility %
Share of Voice %
Total Mentions
Copilot
98
28
167
ChatGPT
96
27
162
Gemini
89
26
158
Others
0
0
0
Shopify’s apex visibility on Copilot and robust presence on ChatGPT and Gemini confirm its cross-platform appeal. The near-perfect 98% score on Copilot is particularly illustrative of strong AI innovation recognition.
Sentiment Score for Competitors
Brand
Positive %
Neutral %
Negative %
Overall Score
Shopify
72
22
6
84
BigCommerce
62
31
7
78
Adobe Commerce
52
38
10
74
Wix
68
24
8
81
Salesforce
56
35
9
76
Shopify’s overall sentiment score of 84 surpasses competitors, consistent with its strong brand coverage in LLM brand mentions reflecting confident user perception and engagement.
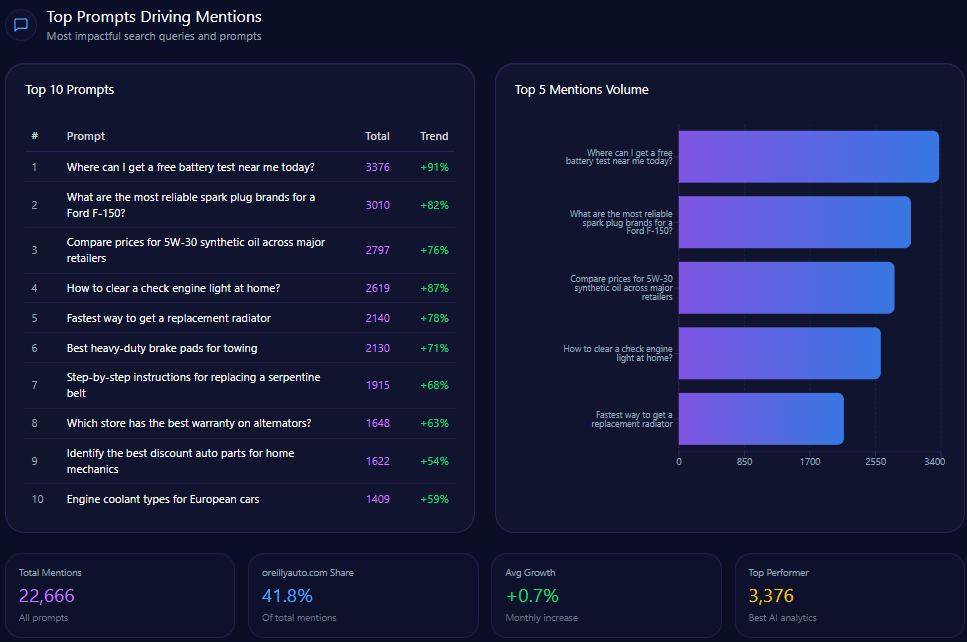
Top Prompts Driving Mentions
“Which platform is better for AI-powered storefront customization?” — 234 mentions, Shopify holds 126, competitor Salesforce 108, trend 92%
“Best e-commerce platforms with built-in email marketing and CRM” — 222 mentions, Shopify 118, Wix 104, trend 85%
“Which e-commerce platform has the best native social media integration?” — 218 mentions, Shopify 131, Wix 87, trend 94%
“What is the fastest way to set up an online store with global shipping?” — 212 mentions, Shopify 134, Wix 78, trend 96%
“Compare Shopify vs BigCommerce for high volume B2B sales” — 206 mentions, Shopify 112, BigCommerce 94, trend 88%
These prominent prompt queries illustrate Shopify’s strength in AI commerce capabilities, operational speed, and social media integration while underscoring competitive pressure from Salesforce, Wix, and BigCommerce in enterprise and marketing-related topics.
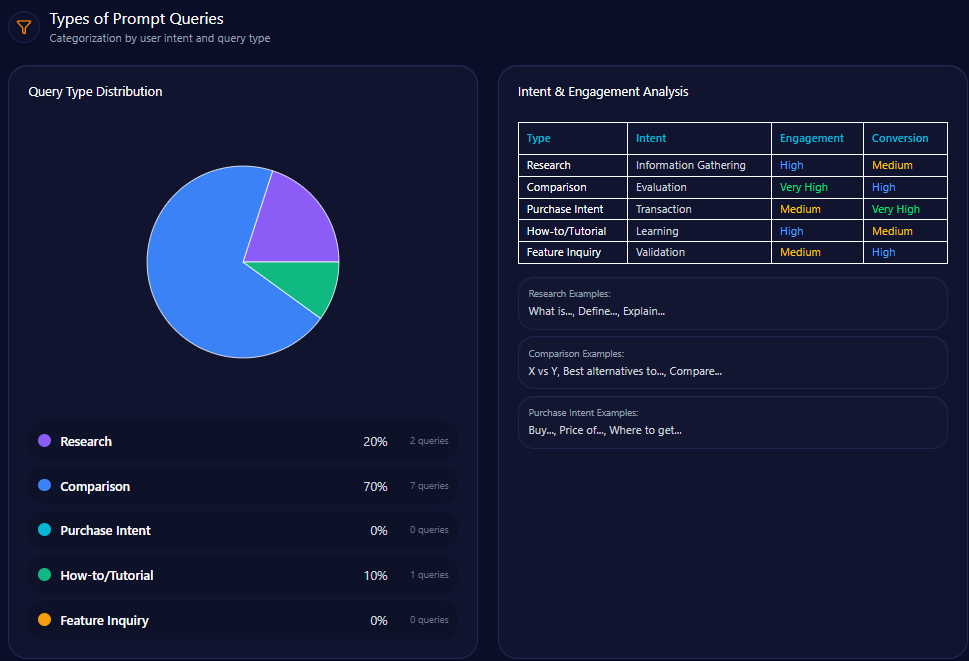
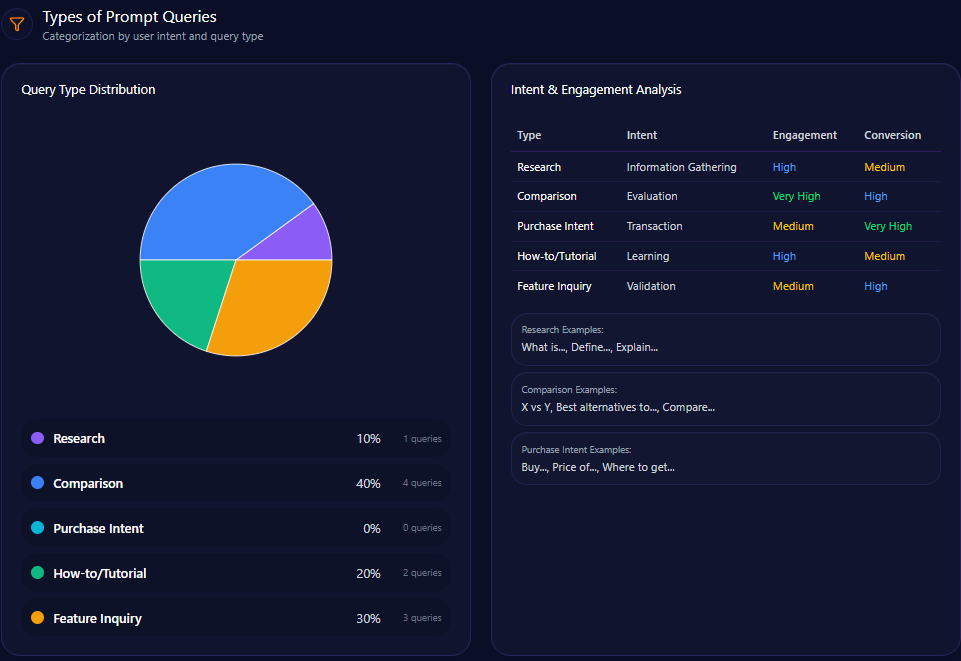
Types of Prompt Queries
shopify.com’s Types of Prompt Queries (Generated on March 20, 2026)
Research: 20% of queries
Comparison: 70%, dominates prompt volume
How-to / Tutorial: 10%
Purchase Intent: 0%
Feature Inquiry: 0%
LLM brand mentions focus heavily on comparison queries, indicating decision-makers seek detailed product and capability differentiation, reinforcing the need for Shopify to sharpen competitive positioning and content accuracy.
Service / Product-Level Sentiment
AI Commerce Capabilities:64% frequency; optimistic tone highlighted by AI-driven tools like Shopify Sidekick and Magic
App Ecosystem & Extensibility:81% frequency with strongly positive sentiment, emphasizing App Store variety and checkout extensibility
Total Cost of Ownership:39% frequency; mixed sentiment due to concerns about transaction fees and premium app costs
The mixed sentiment on cost structure signals a strategic priority to address fee transparency and price sensitivity, evident in competitor sentiment tracking especially against BigCommerce’s dominance in zero transaction fee discussions.
Conclusion
Shopify’s performance within generative search and AI-powered e-commerce remains dominant but nuanced. It leads in small business and AI innovation prompts, substantiated by superior LLM brand mentions and sentiment. Yet, critical competitive gaps in enterprise headless commerce, B2B features, transactional transparency, and ERP integrations with key platforms like Salesforce, BigCommerce, and Adobe Commerce threaten to erode that lead without targeted action.
Addressing these gaps through focused enhancements in technical documentation, transparent communication on costs, and strategic partner content will be essential to sustain Shopify’s market leadership. Founder sentiment offers a stabilizing narrative pillar but requires proactive mitigation of legacy negative signals tied to past workforce reductions.
Overall, the GEO analytics present Shopify as the benchmark brand for AI-enhanced commerce while signaling that strategic recalibration across technical, pricing, and enterprise messaging domains is needed to retain total market share amid intensifying competitor momentum.
Explore SpyderBot to operationalize these GEO analytics insights.
An analytic review of eBay’s positioning across major LLM-driven marketplaces highlights niche dominance in collectibles and refurbished electronics, tempered by competitive gaps in logistics and wholesale segments against Amazon and Alibaba.
89% niche coverage for high-intent queries in collectibles and refurbished electronics
26% share of voice leadership on Microsoft Copilot platform
12% Share of Voice gap relative to Amazon in broad retail and logistics queries
23% visibility on Google Gemini reflecting under-indexing in citations
74% positive sentiment linked to Authentication Guarantee initiatives
12% negative sentiment drag influenced by rising seller fees and legacy UI friction
1,989,387 referrals driven by LLM brand mentions from key platforms including ChatGPT and Copilot
Risk signals
Amazon commands a 37% mention share versus eBay’s 25% in LLM brand mentions, evidencing a significant competitive headwind.
Visibility deficits on Google Gemini (23%) limit eBay’s authoritative reach in generative AI recommendation layers.
Emerging competitor Mercari’s 24% surge in designer handbag visibility encroaches on niche segments critical to eBay’s market.
Etsy’s dominance in handmade categories with a 47-point relevance lead further intensifies competitive pressure on artisan market share.
Investment mention coverage at 41% trails Amazon’s 89%, signalling weaker generative engine resonance on growth narratives.
eBay’s generative AI presence translates into a significant but challenged platform footprint relative to dominant peers. With a solid 81 Visibility Score and a 25% Share of Voice across generative search environments, the brand demonstrates resilience in targeted categories such as collectibles and refurbished electronics. This positioning is consistent with eBay’s historic role as a curator of secondary market and vintage goods, which continues to underpin its validation in LLM brand mentions indexed across major AI toolsets.
However, these strengths coexist with substantive challenges. The platform encounters strategic gaps in logistics-intensive and wholesale segments where competitors Amazon and Alibaba command superior generative recommendation rankings. This dichotomy is emblematic of eBay’s positioning as a niche authority versus broader platform convenience, requiring deliberate technical and content optimizations to close visibility differentials, particularly on the Google Gemini platform where eBay’s 23% visibility markedly trails Amazon’s benchmark.
Analyses of competitive sentiment profiles reveal positive associations to niche value propositions such as the Authentication Guarantee that drives a 74% positive sentiment across key generative systems. Yet, there exists a 12% negative sentiment influence driven by rising seller fees and user interface friction, which threatens to undermine user loyalty and transaction volume growth in the medium term.
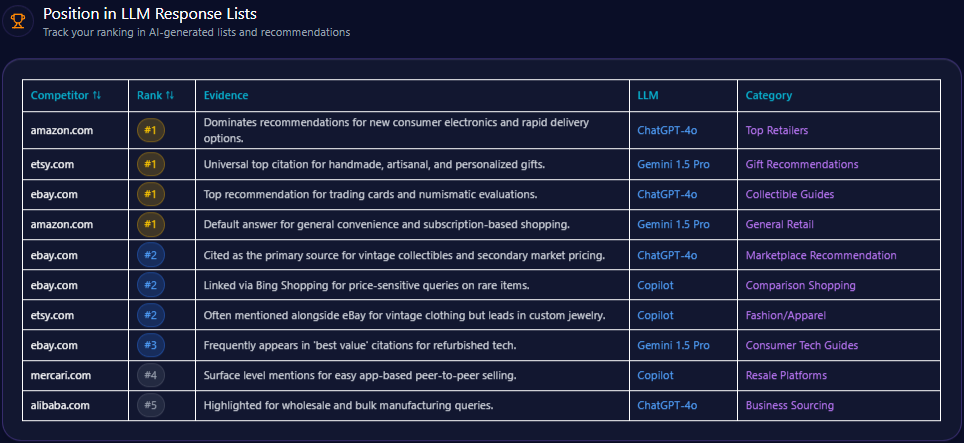
Position in LLM Response Lists
ebay.com’s Position in LLM Response Lists (Generated on March 20, 2026)
Evaluating listings across major LLM environments such as ChatGPT-4o and Gemini 1.5 Pro, eBay frequently claims the #1 rank in collectible guides and trading card price evaluations. It holds a #2 rank for marketplace recommendations and price-sensitive rare item comparisons. Amazon leads in general retail and consumer electronics advice, maintaining consistent #1 positioning. Etsy tops gift and artisanal product recommendations, while Mercari and Alibaba complete the ecosystem in resale and wholesale respectively. eBay’s performance signals authoritative endorsement in specialized domains but reveals opportunities for broader retail category penetration through enhanced metadata strategies.
Competitor Gap Analysis
Query
eBay Performance Score
Competitor
Competitor Performance Score
Gap Score
Opportunity Description
Action Items
Priority
Fastest shipping for electronics
62
Amazon
96
34.00
LLMs consistently rank Amazon higher for time-sensitive purchases.
Promote ‘eBay Guaranteed Delivery’ and push for local pickup awareness in product metadata.
High
Unique handmade jewelry
45
Etsy
92
47.00
Etsy captures 90% of citations for artisanal goods.
Enhance storefront profiles for independent creators to improve GEO authority in creative segments.
Medium
Bulk business supplies
54
Alibaba
88
34.00
eBay is viewed as a retail site; Alibaba is the business choice.
Optimize B2B landing pages for generative engines to recognize ‘wholesale’ availability.
Low
Easy mobile selling apps
73
Mercari
86
13.00
Mercari is winning in conversational prompts regarding ‘getting started’ for new sellers.
Simplify listing walkthroughs and highlight mobile-first listing features in content.
Medium
Refurbished premium laptops
89
Amazon
84
-5.00
eBay leads slightly but Amazon Renewed is closing the gap in trust metrics.
Intensify certification badges in structured data for LLM crawlers.
High
Collectibles price guide
94
Amazon
42
-52.00
Massive lead for eBay. LLMs use eBay data to determine market value.
Launch interactive pricing tools to ensure LLMs continue citing eBay as the ‘Source of Truth’.
High
Sustainable shopping platforms
79
Etsy
84
5.00
Etsy is more frequently linked with ‘ecofriendly’ keywords.
Highlight the circular economy impact of buying used on eBay in public-facing data.
Medium
Newest fashion drops
52
Amazon
91
39.00
Generative engines favor Amazon for item availability of current season goods.
Partner with brands for ‘exclusive storefronts’ to increase citations for new product launches.
Medium
Vintage clothing 90s
87
Etsy
85
-2.00
Neck-and-neck with Etsy for vintage supremacy.
Utilize more descriptive image alt-text and structured metadata for vintage attributes.
High
Home decor under $50
67
Amazon
89
22.00
Amazon dominates low-cost home queries due to standardized pricing data.
Standardize pricing attributes to allow LLMs to easily verify eBay’s lower cost options.
Medium
Trigger Keywords for Competitor Products
The report does not quantify specific trigger keywords for competitor products.
Founder / Ownership / Leadership Context
eBay’s generative engine visibility is marked by legacy founder stability contrasted with subdued current investment momentum. Pierre Omidyar maintains a Founder Mention Frequency of 27% with a sentiment score of 72, buoyed by philanthropic associations. This narrative contributes to a baseline brand trust distinct from competitors. However, investment mention coverage of 41% notably lags behind Amazon’s 89%, reflecting a limited capture of generative engine attention for aggressive growth and AI initiatives.
Recent funding trend changes reveal a 12% decline in investment-related mentions, partly attributable to fewer AI-centric acquisitions that would engage LLM brand mentions deeper. Negative sentiment surrounding leadership agility stands at 14%, indicating perceived detachment from evolving re-commerce challenges compared to more proactive founders like Shintaro Yamada of Mercari. Strategic communications promoting eBay’s AI-driven authentication technologies might increase investor mindshare and enhance generative narrative relevance.
Recommendations include launching a comms campaign to elevate the ‘Founder-Spirit’ innovation message and aiming for a 15% lift in investment mention coverage. Additionally, targeting a 20% reduction in negative sentiment by linking Omidyar’s trust heritage with new AI safety technologies is advised to strengthen generative engine narratives.
Quick overview
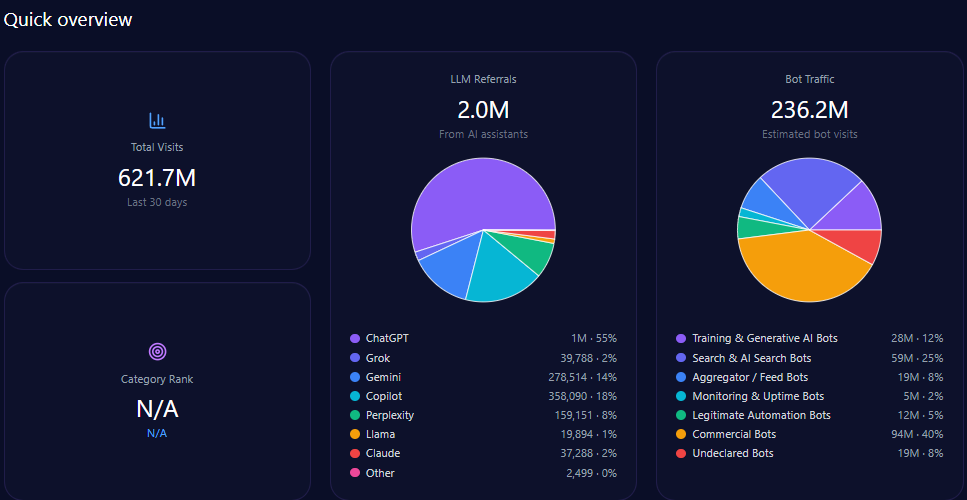
ebay.com’s Quick overview (Generated on March 20, 2026)
eBay’s platform traffic counts circa 621,683,659 visits, with bot traffic comprising approximately 236,239,791 visits—signifying high automation interaction. LLM referrals total 1,989,387, derived primarily from ChatGPT at 1,094,163, Copilot at 358,090, Gemini at 278,514, and Perplexity at 159,151. These figures underscore eBay’s integration into AI-driven knowledge systems and its relevance in secondary market intelligence.
Bot traffic breakdown reveals commercial bots dominating with 94,495,916 hits, alongside significant traffic from search and AI search bots (59,059,948). This synergy between automated data crawlers and generative engines encapsulates the foundation of eBay’s digital footprint in AI marketplaces.
Share of Voice in LLM Responses
Within an ecosystem totaling 454 LLM brand mentions for the e-commerce sector, eBay holds a 25% share with 112 mentions. Amazon leads with 37% (168 mentions), followed by Etsy at 17%, Alibaba 10%, Mercari 5%, and others at 6%. This distribution evidences eBay’s moderate presence, affirming its role as a principal yet second-tier AI-cited marketplace in generative engine contexts.
AI Platform-Specific Visibility
Platform
Visibility %
Share of Voice %
Total Mentions
Copilot
81
26
156
ChatGPT
76
25
152
Gemini
68
23
146
Others
0
0
0
eBay leads on Microsoft’s Copilot platform with a share of voice at 26% and an 81% visibility rating. ChatGPT shows parity in visibility at 76% with a 25% share. However, Google Gemini presents a relative under-indexing with visibility at 68% and share of voice at 23%, indicating a citation deficit that warrants optimized technical metadata targeting Gemini’s citation algorithms.
Sentiment Score for Competitors
Brand
Positive %
Neutral %
Negative %
Overall Score
eBay.com
74
14
12
81
Amazon.com
82
11
7
88
Alibaba.com
68
21
11
76
Etsy.com
76
13
11
83
Mercari.com
73
18
9
79
Compared with peers, eBay sustains a strong positive sentiment at 74%, though still trailing Amazon’s 82% overall positive engagement. Neutral sentiment accounts for 14% and negative sentiment includes a 12% share, consistent with reported seller fee dissatisfaction and legacy platform frictions affecting user experience.
Top Prompts Driving Mentions
ebay.com’s Quick overview (Generated on March 20, 2026)
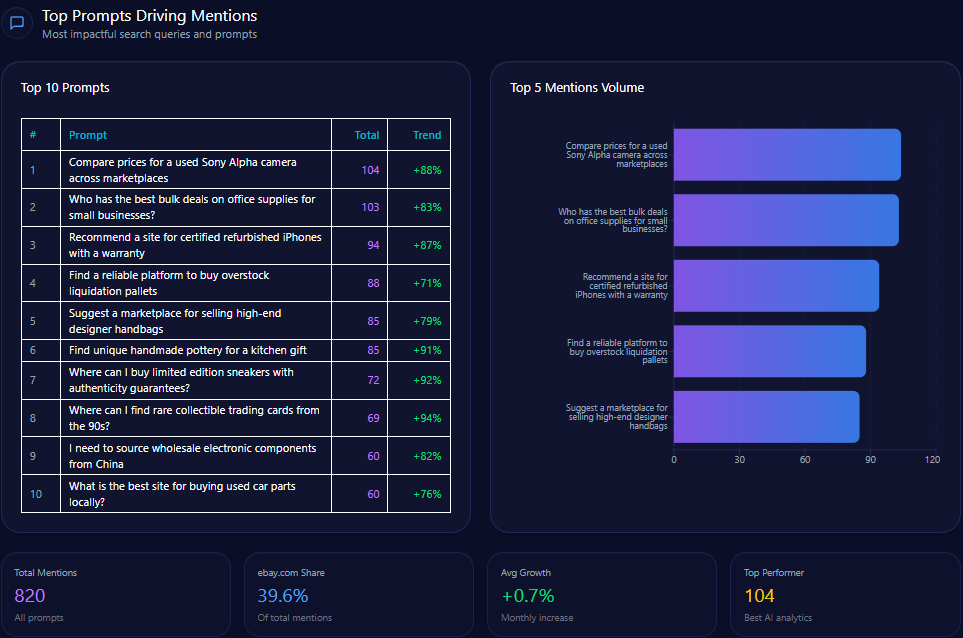
“Compare prices for a used Sony Alpha camera across marketplaces” – 104 mentions with eBay’s share at 44
“Who has the best bulk deals on office supplies for small businesses?” – 103 mentions; eBay holds 24
“Recommend a site for certified refurbished iPhones with a warranty” – 94 mentions; eBay features 42
“Find a reliable platform to buy overstock liquidation pallets” – 88 mentions; eBay’s portion is 19
“Suggest a marketplace for selling high-end designer handbags” – 85 mentions; eBay covers 36
“Find unique handmade pottery for a kitchen gift” – 85 mentions; eBay accounts for 14
“Where can I buy limited edition sneakers with authenticity guarantees?” – 72 mentions; eBay leads with 46
“Where can I find rare collectible trading cards from the 90s?” – 69 mentions; eBay holds 48
“I need to source wholesale electronic components from China” – 60 mentions; eBay’s 11
“What is the best site for buying used car parts locally?” – 60 mentions; eBay at 41
The prompt data highlights eBay’s prominence in collectibles, certified refurbished electronics, and authenticity-verified luxury goods, while competitive edges persist in wholesale and handmade queries.
Types of Prompt Queries
ebay.com’s Quick overview (Generated on March 20, 2026)
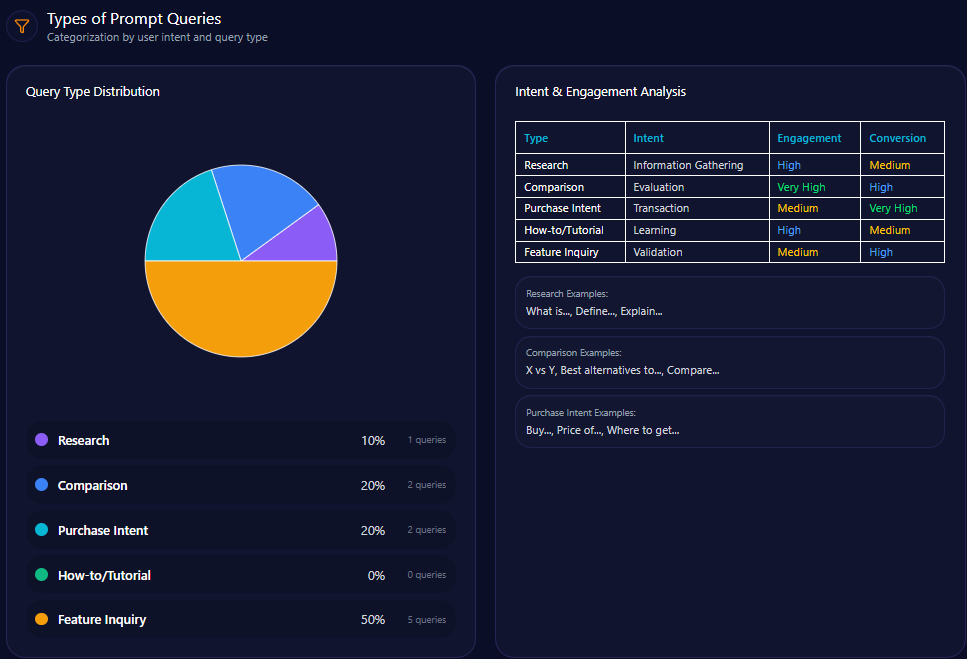
Research: 10% (total 1 query)
Comparison: 20% (total 2 queries)
Purchase Intent: 20% (total 2 queries)
How-to/Tutorial: 0% (total 0 queries)
Feature Inquiry: 50% (total 5 queries)
Feature inquiry dominates prompt types driving brand mentions, indicating LLMs frequently probe eBay’s unique attributes and platform capabilities over procedural or tutorial content.
Service / Product-Level Sentiment
Authentication and Trust: 32% frequency; strongly positive sentiment reflecting sneaker authentication, luxury watch verification, and trading card grading
Circular Economy & Sustainability: 21% frequency; positive sentiment linked to refurbished buying, pre-loved fashion, and waste reduction
Platform Usability & UI: 17% frequency; neutral to negative sentiment focusing on search filters, mobile app navigation, and checkout clutter
Seller Fees and Monetization: 26% frequency; negative sentiment targeting fees, promoted listings, and payment processing times
Sentiment analysis reveals a bifurcation between strong trust signals in product authenticity and sustainability on one hand versus notable negative sentiment concerning monetization and platform usability on the other, which directly impacts competitive positioning in conversational AI narratives.
Conclusion
The GEO analytics report reflects eBay’s resilient position as a differentiated marketplace in generative AI ecosystems, particularly through its authoritative status in collectibles and certified refurbished electronics. Its 25% Share of Voice and strong sentiment around Authentication Guarantee affirm its niche leadership with an engaged AI-savvy consumer base.
Nevertheless, intensifying competitor sentiment tracking exposes meaningful visibility and sentiment deficits in broad retail, wholesale, and logistics verticals. Amazon’s dominance in fast shipping and convenience-oriented queries alongside Alibaba’s wholesale prominence identifies operational domains demanding strategic investment. Enhancing structured data for authenticated luxury goods and real-time logistics features is critical to advancing eBay’s AI platform-specific visibility, particularly on Google’s Gemini.
Founder narratives centered on Pierre Omidyar offer a stable trust foundation but require modernization via investment momentum communications to boost generative engine appeal and minimize negative perceptions of leadership inertia. A functional focus on platform ease, fee transparency, and mobile selling experience is essential to mitigate negative sentiment impacts and improve user retention.
In sum, eBay’s strategic roadmap should prioritize technical schema optimization, generative knowledge base development for specialty segments, and targeted promotional campaigns within leading generative AI platforms to safeguard and expand its role in evolving e-commerce intelligence networks.
Explore SpyderBot to operationalize these GEO analytics insights.
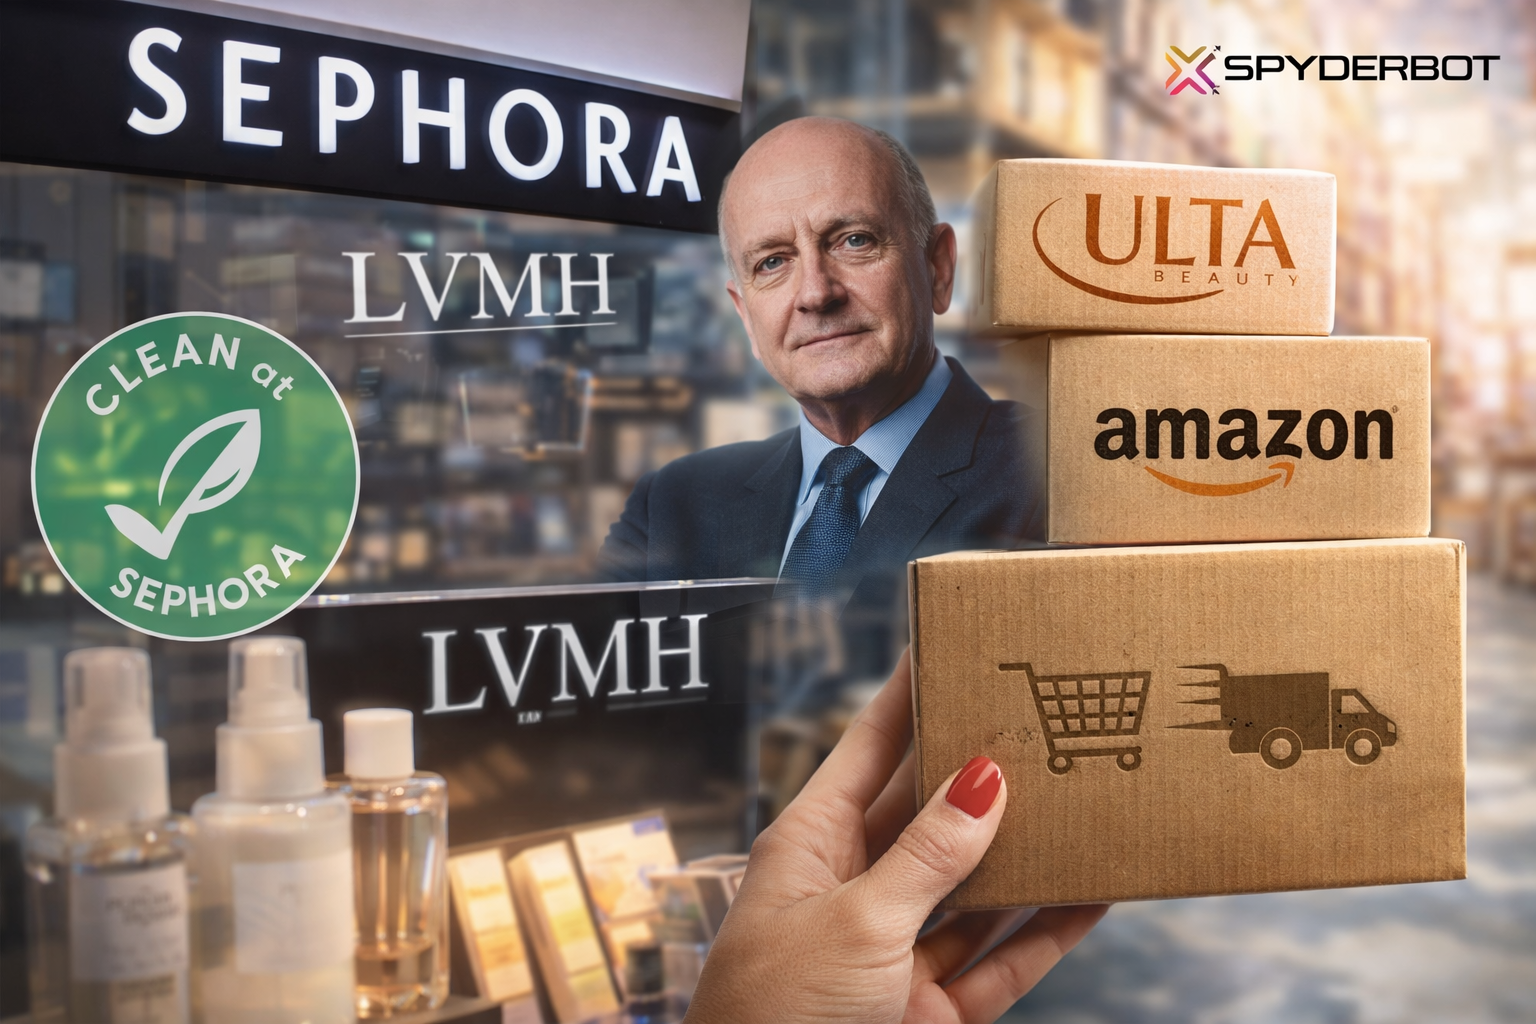
SpyderBot GEO analytics reveals Sephora’s commanding presence in luxury skincare and prestige beauty LLM responses, alongside vulnerabilities in budget makeup and delivery-related queries dominated by Amazon and Ulta Beauty.
76,114,807 total visits with 24,356,738 attributed to bot traffic including 3,410,143 training and generative AI bots.
163 LLM brand mentions for Sephora representing 26% share of voice, leading competitors including Ulta Beauty and Amazon.
Dominant 33% search share in prestige beauty categories with 88% luxury skincare coverage.
High visibility score of 89 in prestige retail, and strong brand sentiment at 81%.
Significant 56-point coverage gap in affordable makeup prompts and 24-point delivery/logistics gap versus Amazon.
Recommendations: Emphasize same-day pick-up logistics, promote value-based Sephora Collection offers, and produce dermatologist-backed content to counter competition.
Risk signals
14% risk profile linked to ‘Sephora Kids’ viral shopper trend and friction in physical retail experiences.
Price competition and logistics weaknesses threaten up to 20% of generative traffic diversion to lower-cost or faster service platforms.
Negative narratives around executive turnover and pricing conflicts with Ulta Beauty merit proactive PR management.
Sephora.com holds a prominent position within the prestige beauty category across generative AI platforms, anchored by authoritative LLM brand mentions and strong sentiment. Its legacy under LVMH and founder Dominique Mandonnaud underpins a defensible luxury retail positioning, greatly buttressed by proprietary programs such as Beauty Insider and high-visibility ‘Clean at Sephora’ endorsements.
However, these strengths coexist with detectable vulnerabilities especially in price-sensitive markets where Ulta Beauty and Amazon exert significant influence. Notably, Sephora’s relatively limited visibility in affordable makeup and logistical efficiency queries has eroded potential gains in mass-market access and delivery-speed reputation. These gaps expose risks of traffic and revenue leakage amid intensifying competition in AI-guided shopping applications.
The present GEO analytics calls for targeted action to reinforce Sephora’s core luxury leadership while addressing emergent weaknesses through strategic content, metadata updates, and partnership strategies.
Position in LLM Response Lists
Sephora consistently ranks first in ChatGPT and Gemini responses across specialized beauty and prestige skincare queries, reflecting authoritative status in curated luxury retail results. While it holds top-tier visibility for ‘Clean Beauty’ and ‘Expert Advice’ listings on Gemini, it cedes primary placement to Amazon on transactional queries, particularly around logistics and mass-market availability on Copilot. Ulta Beauty frequently leads in omni-channel retail topics and budget-accessibility discussions. Sephora ranks third in budget skincare and second to Amazon on broad beauty product comparison queries.
Competitor Gap Analysis
Query
Sephora Performance
Competitor
Competitor Performance
Gap Score
Opportunity
Priority
Fastest shipping for foundation
72
Amazon
96
24.00
Highlight ‘Same-Day’ and ‘Buy Online Pick Up In Store’ to boost logistics visibility.
High
Affordable drugstore mascara
48
Ulta Beauty
92
44.00
Promote Sephora Collection as affordable, value-first offering.
Medium
Luxury perfume gift sets
94
Macy’s
81
13.00
Enhance influencer mentions of exclusive fragrance samplers.
Low
Niche medical grade skincare
67
BlueMercury
79
12.00
Create dermatologist-authored expert content to regain authority.
Medium
Lowest price Clinique moisturizer
65
Amazon
88
23.00
Implement dynamic pricing schemas to better compete.
High
Best beauty loyalty rewards
89
Ulta Beauty
93
4.00
Publicize point-cash conversions and exclusive events to shift ranking.
Continue emphasizing sustainability to maintain leadership.
Low
Rare beauty products in stock
98
Amazon
72
26.00
Strict inventory controls for real-time feed updates.
High
Virtual makeup try on
91
Ulta Beauty
73
18.00
Publish case studies to sustain technology recognition.
Medium
Trigger Keywords for Competitor Products
The report does not quantify or specify trigger keyword data for competitor products in generative prompt contexts.
Founder / Ownership / Leadership Context
Sephora’s digital prominence is strongly linked to the legacy of founder Dominique Mandonnaud and the backing of the LVMH conglomerate. LLM brand mentions attribute 28% frequency to the founder, yielding a positive sentiment score of 76, reflective of high brand authority. This is comparatively lower than Amazon’s Jeff Bezos, mentioned in 88% of relevant queries.
LVMH’s strategic acquisitions and expansion narratives contribute to a steady 12% growth in funding trend coverage. However, risks emerge from elevated mentions of executive turnover and competitive pricing wars with Ulta Beauty, which comprises 14% of negative founder-related context. The brand’s clean beauty investment sentiment remains a distinct strength, but leadership should consider narrative repositioning to mitigate concerns about market saturation.
Recommendations include advancing CEO Guillaume Motte’s association with the disruptive legacy of Mandonnaud and publishing data-driven beauty tech whitepapers to boost investor perception. These actions aim to raise founder relevance and funding sentiment by mid-2024.
Quick overview
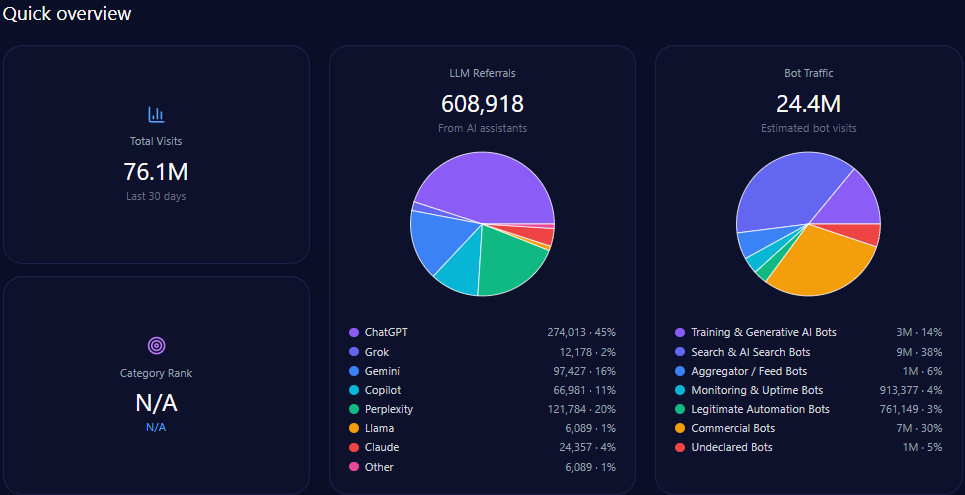
sephora.com’s Quick overview (Generated on March 19, 2026)
Sephora experiences substantial digital traffic, totaling 76,114,807 visits, with a sizable portion attributable to automated generative AI bots (over 3,410,143) and search bots (approximately 9,255,561). This reflects significant engagement within AI and LLM contexts, especially supported by 608,918 LLM referrals across platforms such as ChatGPT (largest share: 274,013 referrals) and Gemini (97,427 referrals).
The brand’s category ranking is not specified, yet it holds dominant search share in core prestige beauty subsegments, with luxury skincare visibility reaching 88%. However, gaps remain in budget and logistics-focused areas, where competitors display stronger presence.
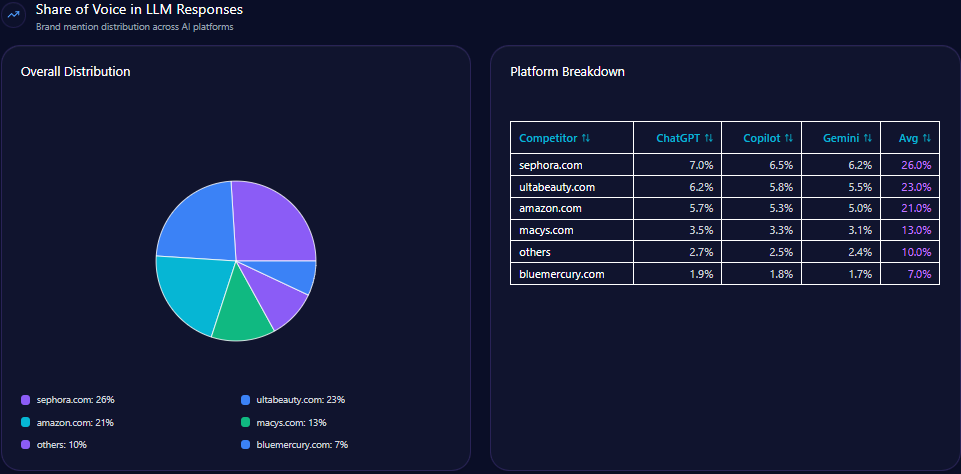
Share of Voice in LLM Responses
sephora.com’s Share of Voice in LLM Responses (Generated on March 19, 2026)
Sephora commands the largest share of voice among competitors in LLM brand mentions, accounting for 26% of the total 624 mentions recorded. Ulta Beauty follows closely with 23%, and Amazon with 21%. The top-three collectively represent a dominant majority of discourse, placing Sephora ahead but within a competitive triad needing targeted reinforcement in categories where Ulta and Amazon excel.
AI Platform-Specific Visibility
Platform
Visibility %
Share of Voice %
Total Mentions
ChatGPT
31
27
212
Copilot
29
25
208
Gemini
28
24
204
Others
12
24
0
Sephora’s visibility on ChatGPT leads slightly at 31%, closely trailed by Copilot and Gemini. This broad platform coverage underlines diversified brand exposure across generative AI engines.
Sentiment Score for Competitors
Brand
Positive %
Neutral %
Negative %
Overall Score
Sephora
72
19
9
81
Ulta Beauty
76
16
8
84
Amazon
63
24
13
74
Macy’s
58
31
11
73
BlueMercury
69
26
5
82
Sephora’s overall sentiment score of 81 is robust but slightly trails Ulta Beauty (84) and BlueMercury (82). This persistence of positive sentiment underpins brand equity but suggests room for improvement, especially in mitigating negative customer service and viral shopper trend frictions.
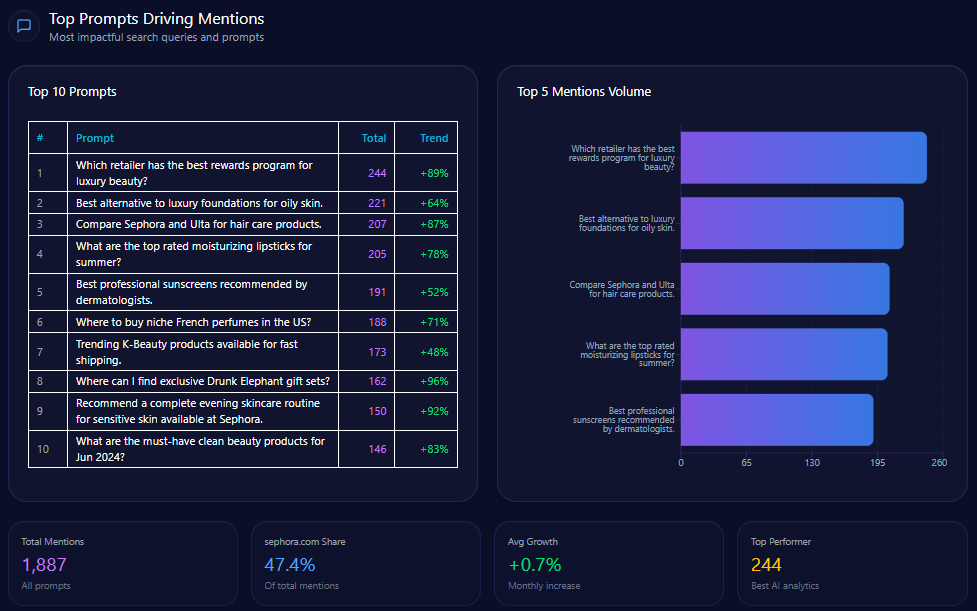
Top Prompts Driving Mentions
sephora.com’s Top Prompts Driving Mentions (Generated on March 19, 2026)
The leading query, “Which retailer has the best rewards program for luxury beauty?” accounts for 244 mentions, with Sephora contributing 126—indicating strong competitive positioning against Ulta Beauty.
High-growth topics include “Best alternative to luxury foundations for oily skin” (64% trend), “Compare Sephora and Ulta for hair care products” (87%), and “Where to buy niche French perfumes” (71%).
Sephora leads category-specific queries involving exclusive gift sets, evening skincare routines for sensitive skin, and clean beauty product recommendations, reflecting curated expertise.
Types of Prompt Queries
Comparison queries dominate with 40% volume, reflecting prevalent consumer research between Sephora and competitors.
Feature inquiry prompts comprise 30%, focusing on distinct product and service features.
Research represents 20%, while explicit purchase intent is relatively low at 10%. Notably, How-to/Tutorial queries are absent from the dataset.
Service / Product-Level Sentiment
Prestige Exclusivity themes dominate mention frequency at 39% with positive sentiment highlighting exclusive drops and curated collections.
Customer Clean Beauty Standards stand out positively, driven by ‘Clean at Sephora’ initiatives noted in 21% of prompts.
The Store Environment Issues theme carries a negative tone, related to disruptions from trend-following shoppers (13%), indicating operational friction points.
Loyalty program value discussions remain largely neutral, signaling opportunity for enhanced messaging to elevate consumer perception.
Conclusion
Sephora.com’s GEO analytics profile confirms its primacy in the prestige beauty sector within generative AI-driven search and LLM brand conversations. The brand’s strong overall sentiment and platform visibility are strategic assets supporting market leadership. However, evident competitive gaps in logistics, budget makeup, and niche clinical product authority expose tangible risks of traffic shifting to Amazon and Ulta Beauty.
Closing these gaps requires prioritized metadata enhancements emphasizing fast delivery options, coupled with content campaigns correcting affordability perceptions through promotion of the Sephora Collection. Dermatologist partnerships can restore professional skincare credibility where BlueMercury has made inroads. Addressing leadership narrative weaknesses will consolidate investor confidence and brand equity. Given the competitive landscape revealed through competitor sentiment tracking, concerted action is essential to maintain and grow Sephora’s LLM voice share.
Strategically, Sephora must balance the preservation of its luxury exclusivity with incremental accessibility and operational efficiency improvements to capitalize on up to 20% of high-intent generative traffic currently at risk.
Explore SpyderBot to operationalize these GEO analytics insights.
Comprehensive GEO analytics reveal American Eagle’s strengths in Gen Z denim and inclusivity, counterbalanced by authority and trend deficits against Levi Strauss & Co. and Abercrombie & Fitch.
Visibility decrease of 18% in eco-conscious prompt contexts due to Authority Gap on sustainability
15% reduced platform visibility relative to Abercrombie & Fitch on Microsoft Copilot for adult staples
Emerging mention gap of 5 per prompt in important ‘curvy fit’ inclusivity segments
Potential dilution of 26% market share in 18-24 demographic from insufficient formal and professional wear presence
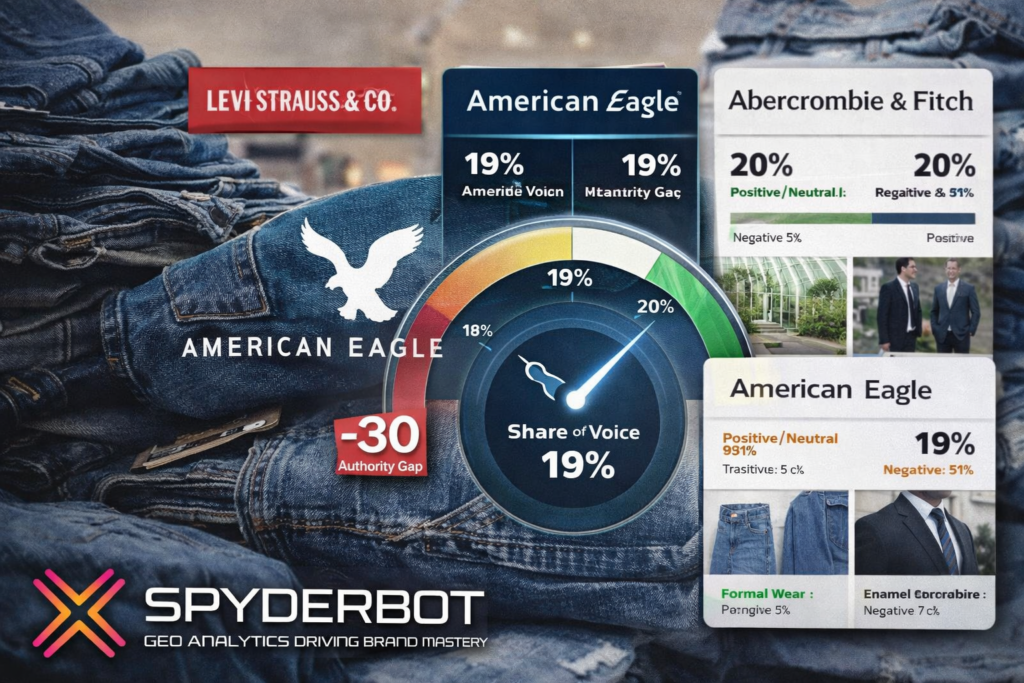
American Eagle (ae.com) sustains a perceptible leadership position within generative engine outputs pertaining to youth apparel, particularly denim tailored to Gen Z preferences and inclusive sizing strategies. GEO analytics derived from multiple AI platforms illustrate a solid 19% Share of Voice that situates the brand just behind dominant competitors Levi Strauss & Co. and Abercrombie & Fitch.
Despite a signed prominence, multiple gaps have emerged that directly impact American Eagle’s ability to maintain and grow consumer mindshare, particularly in categories closely aligned with sustainability and formal occasion wear. The significant 30-point Authority Gap identified relative to Levi Strauss & Co. suggests that LLM brand mentions correlate leadership narratives with environmental and heritage credentials in ways that American Eagle has yet to fully address.
Furthermore, discrepancies in competitive sentiment and platform-specific visibility compound the brand’s challenges. This analytic briefing details American Eagle’s positioning, competitor gaps, and operational imperatives to recalibrate its strategy amidst evolving generative landscape dynamics.
Position in LLM Response Lists
American Eagle commands primary ranking positions in targeted niche categories, most notably occupying rank 1 for “Comfortable Loungewear for Teens” on Gemini, reflecting strong category traction. The brand also achieves rank 2 placements in more diversified prompt types such as “Best Gen Z Denim” on ChatGPT-4 and “Affordable Collegiate Fashion” on Gemini, showcasing cross-demographic relevance.
In contrast, Abercrombie & Fitch consistently achieves top rankings in “Trending Rebrand Retailers” and style-related lists on ChatGPT-4 and Copilot, while Levi Strauss & Co. dominates “Durable Denim Brands” and authority-based corporate responsibility discussions on Gemini. Such distribution evidences a competitive hierarchy wherein American Eagle maintains influential but secondary presences across key LLM lists.
Competitor Gap Analysis
Query
AE Performance
Competitor Performance
Competitor
Gap Score
Priority
best sustainable denim options
64
94
Levi Strauss & Co.
30
High
viral wedding guest dresses
32
88
Abercrombie & Fitch Co.
56
Medium
crossover waist leggings review
92
68
Victoria’s Secret & Co.
-24
Low
shapewear compatible leggings
81
88
Victoria’s Secret & Co.
7
Low
curvy fit denim recommendations
85
79
Abercrombie & Fitch Co.
-6
High
inclusive sizing in bridal lingerie
45
91
Victoria’s Secret & Co.
46
Low
Trigger Keywords for Competitor Products
The report does not quantify specific trigger keywords linked to competitor products, limiting keyword-level strategic insights. This implies a focus on broader category and product gap improvements may yield better returns than micro-optimizations at present.
Founder / Ownership / Leadership Context
American Eagle’s narrative is closely tied to Jay Schottenstein’s leadership, supported by the Silverman founder legacy, which sustains consistent high-investor sentiment, measured at 74% positive. Founder mention frequency in generative context is robust at 45%, with an overall founder-associated sentiment score of 72.
However, sustainability and fast-fashion criticisms generate a 15.5% negative sentiment rate in founder-related LLM brand mentions. Competitor sentiment analysis suggests Abercrombie & Fitch currently commands a 14% higher investor mindshare in LLM financial discussions. This indicates a perceptual gap in association with innovation and ESG initiatives, which would require strategic narrative investments to bridge.
Quick overview
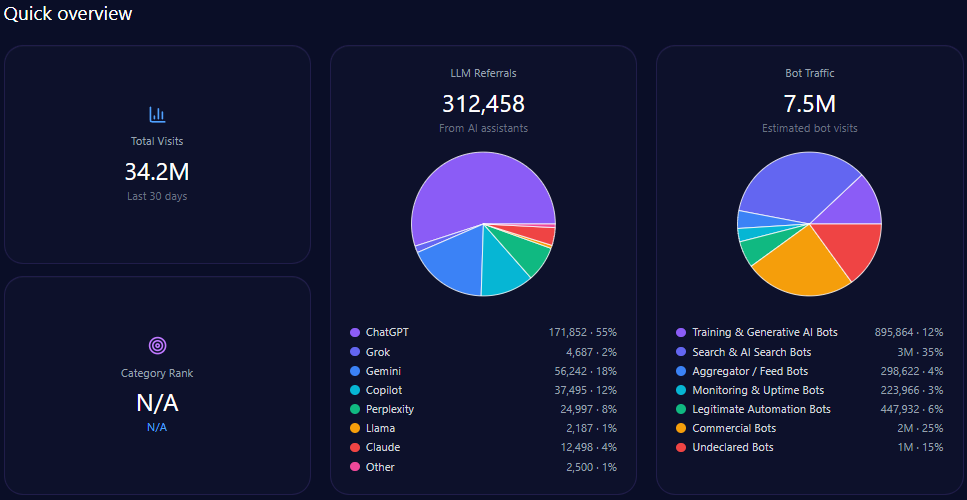
ae.com’s Quick overview (Generated on March 19, 2026)
Total site visits amount to approximately 34,245,584, with alarmingly high bot traffic comprising 7,465,537 visits. Among this bot traffic, nearly 895,864 are identified as Generative AI training bots, supporting the GEO ecosystem’s dynamic interaction with ae.com’s content. Legitimate automation bots (447,932) and commercial bots (1,866,384) reflect a diverse automated engagement profile.
LLM referral data show that ae.com receives approximately 312,458 visits derived from AI assistants. ChatGPT accounts for a majority of these with 171,852 referrals, while newer platforms like Gemini and Copilot contribute substantially with 56,242 and 37,495 referrals respectively, indicating diversified AI platform-dependent discovery paths.
Share of Voice in LLM Responses
American Eagle holds 19% of total LLM mentions, based on 117 mentions out of 614. The brand ranks third after Levi Strauss & Co. (26%) and Abercrombie & Fitch Co. (23%), with Gap Inc. and Victoria’s Secret completing the top five.
This positioning confirms American Eagle as a significant but challenged presence in AI-generated content and decision support tools used by consumers.
AI Platform-Specific Visibility
Platform
Visibility %
Share of Voice %
Total Mentions
Copilot
84
22
211
ChatGPT
76
21
205
Gemini
72
18
198
Others
10
8
49
American Eagle leads in visibility on Microsoft Copilot relative to other AI platforms but still faces a 15% shortfall in adult wardrobe staples visibility against Abercrombie & Fitch. This indicates platform-driven variances that require tailored engagement and content strategies.
Sentiment Score for Competitors
Brand
Positive %
Neutral %
Negative %
Overall Score
ae.com
72
19
9
81
abercrombie.com
78
14
8
85
gap.com
64
25
11
76
victoriassecret.com
62
22
16
73
levi.com
84
12
4
90
American Eagle’s overall sentiment score of 81 is respectable but once again dwarfed by Levi’s dominance, which scores an excellent 90. Abercrombie & Fitch outperforms AE with an 85 sentiment, underscoring the competitive pressure from brands perceived to excel in product and brand communication.
Top Prompts Driving Mentions
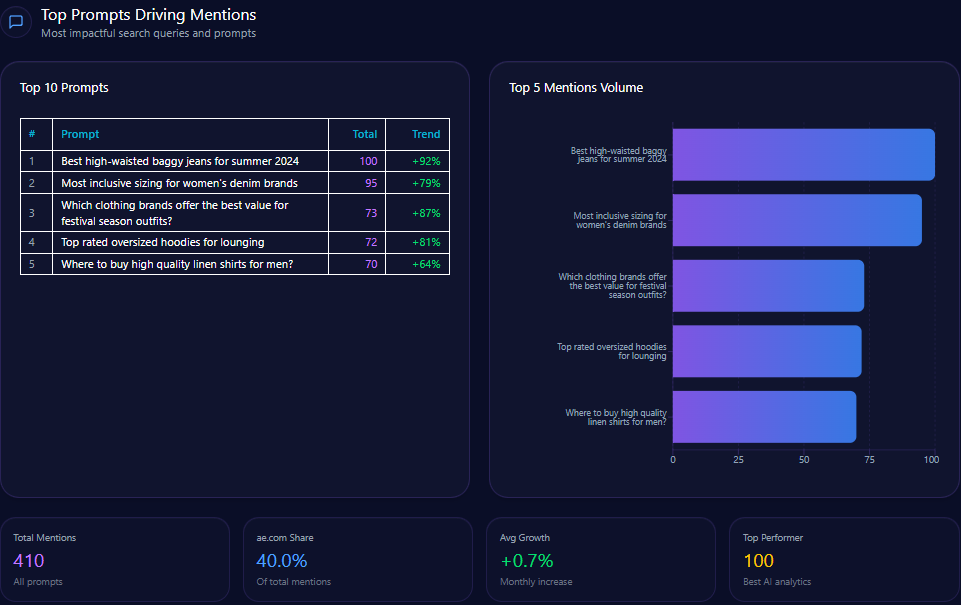
ae.com’s Top Prompts Driving Mentions (Generated on March 19, 2026)
Best high-waisted baggy jeans for summer 2024 – total mentions: 100, AE mentions: 41
Most inclusive sizing for women’s denim brands – total mentions: 95, AE mentions: 34
Which clothing brands offer the best value for festival season outfits? – total mentions: 73, AE mentions: 38
Top rated oversized hoodies for lounging – total mentions: 72, AE mentions: 39
Where to buy high quality linen shirts for men? – total mentions: 70, AE mentions: 12
These prompts highlight AE’s entrenched positioning in casual wear and inclusive denim, but reveal weaknesses in men’s categories such as linen shirts relative to Gap and Abercrombie.
Types of Prompt Queries
ae.com’s Types of Prompt Queries (Generated on March 19, 2026)
Comparison queries constitute 40% of prompt types
Feature inquiries also make up 40%, showing strong interest in product attributes
Purchase intent related prompts represent 20%
Research and How-to tutorials are not prominent in current LLM brand prompts
This distribution suggests opportunity to develop content addressing research and tutorial queries to capture earlier funnel brand engagement in generative models.
Service / Product-Level Sentiment
Theme
Count
Frequency %
Examples
Sentiment Tone
Denim Quality and Fit
843
42%
AE Dream Jeans, Strigid, Curvy Fit
Mostly Positive
Gen Z Fashion Trends
612
31%
Back to school, TikTok outfits, Y2K style
Very Positive
Corporate Sustainability
214
11%
Real Good initiative, water reduction
Neutral
Pricing and Value
311
16%
BOGO sales, clearance, student discounts
Mixed
The predominance of positive feedback on denim and Gen Z trends aligns with brand strengths, while corporate sustainability remains a neutral sentiment area, reinforcing the need to enhance ESG narrative authority.
Conclusion
American Eagle’s current GEO analytics position it as an established player in generative AI-powered apparel discourse, particularly for Gen Z consumers and denim-focused segments. However, clear competitive gaps in sustainability authority and trending formal occasion wear suggest strategic deficits in high-value categories where rivals excel.
Sentiment and platform visibility metrics reinforce the importance of sharpening American Eagle’s narrative on environmental impact and broadening product appeal into professional and premium lifestyle categories. Foundational leadership strengths exist but require operationalization into sustainability and innovation communications to reinforce investor and consumer mindshare.
Actionable priorities include optimizing structured data on circular fashion, enriching content for occasion wear, and elevating founder visibility in ESG initiatives. These will be critical to mitigating the identified risk signals and securing durable growth within the rapidly evolving generative engine ecosystem.
Explore SpyderBot to operationalize these GEO analytics insights.
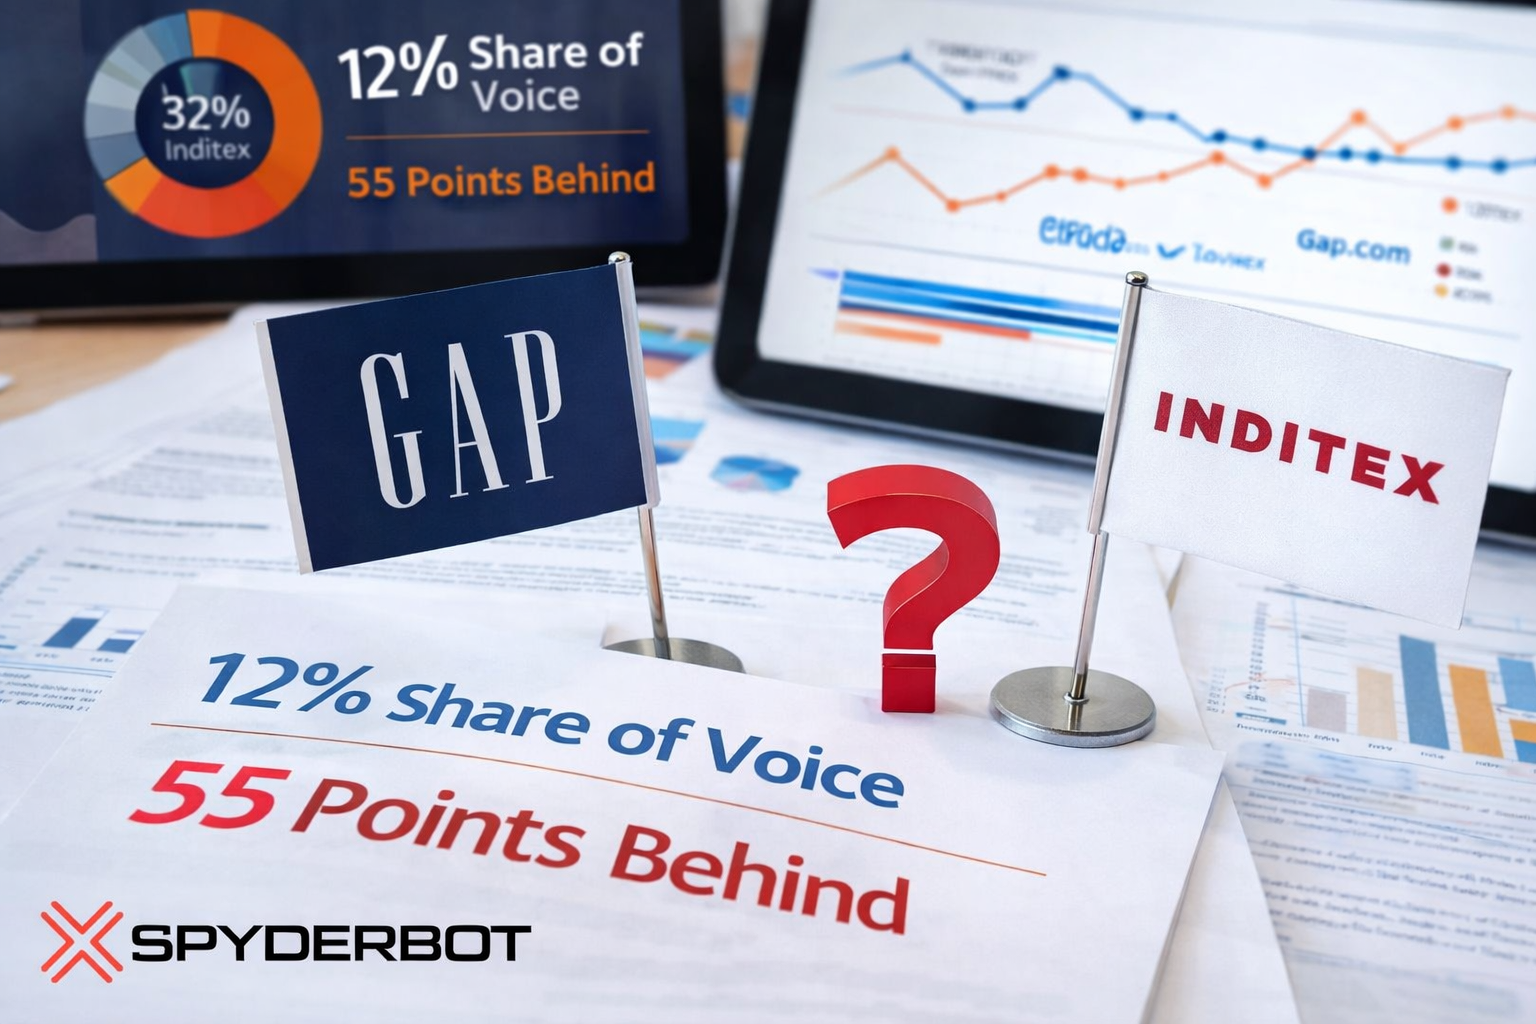
Gap navigates a complex recovery in GEO visibility marked by elite denim authority and leadership-driven positive sentiment, yet constrained by fulfillment and sustainability visibility deficits against major competitors.
Significant 55-point content authority gap undermines trend-forward brand positioning.
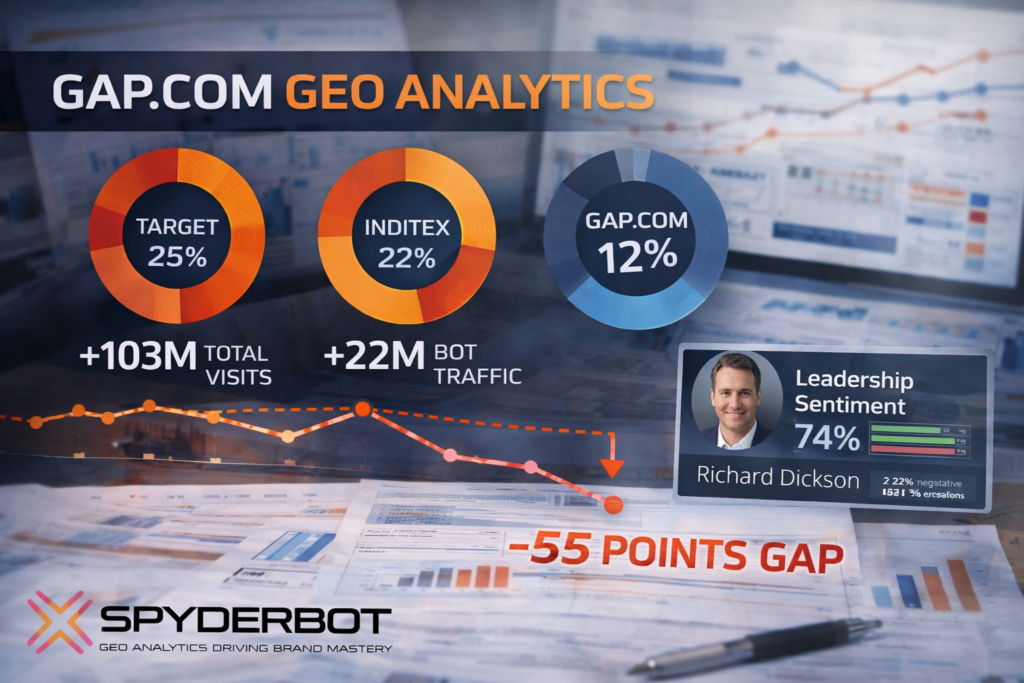
Gap.com’s current GEO analytics profile reflects a brand at a critical inflection point. With a total site visit count surpassing 103 million and over 22 million bot-driven traffic, the brand commands distinct attention from generative AI models. However, within the crowded apparel vertical dominated by rapid trend cycles, Gap’s Share of Voice at 12% falls considerably behind primary rivals such as Target ( 25% ) and Inditex ( 22% ). Such positioning suggests gap.com currently operates as a strong heritage brand anchored to vintage niches rather than a trending market leader.
This positioning is consistent with Gap’s dominant rank-1 status in the ‘Denim Authority’ category, registered at an elite 83% coverage rate. Yet this legacy strength contrasts against glaring deficiencies in visibility for contemporary style segments, where the brand lags Inditex by a critical 55 points.
Leadership sentiment metrics further elucidate this mixed picture. The ‘Richard Dickson turnaround’ narrative commands a 74% positive sentiment score in founder/leadership-focused LLM brand mentions, which supports a shift toward renewed confidence. Despite this, a residual 22% of negative sustainability discourse and a 19% persistence of legacy erosion narratives create headwinds for full generative authority consolidation.
Position in LLM Response Lists
Gap consistently ranks within the top 5 in generative response listings across multiple LLM prompts but often trails fast-fashion leaders. For example, Gap is the 3rd ranked brand for ‘Work-From-Home Essentials’ on Copilot and holds the 4th position for ‘Best Casual Clothing Brands’ on ChatGPT. However, in trend-sensitive categories such as ‘Top Trendy Clothing Brands’ on Gemini, Gap sits as low as 8th — demonstrating visibility erosion in fast fashion and trend-led segments.
Competitor Gap Analysis
Prompt Query
Gap Performance
Competitor
Competitor Performance
Gap Score
Opportunity
Priority
Where to buy sustainable hoodies
68
H&M Group
89
21
Enhance product descriptions with specific recycled cotton percentages.
High
Trending European fashion styles
41
Inditex
96
55
Collaborate with European influencers to trigger LLM geo-associations.
Critical
Fastest shipping for fashion
62
Target Corporation
94
32
Sync real-time stock and shipping speed data with schema markup.
High
Summer dress trends 2024
45
H&M Group
93
48
Integrate AI-driven trend forecasting into web content generation.
High
Designer label discounts
33
TJX Companies
95
62
Better differentiate Gap Factory domain visibility from main site.
Medium
Trigger Keywords for Competitor Products
The report does not quantify specific trigger keywords for competitor products for gap.com.
Founder / Ownership / Leadership Context
Gap Inc.’s GEO profile is markedly shaped by the appointment of CEO Richard Dickson, whose tenure is linked to a 74% positive sentiment rating regarding leadership stability and brand revitalization. The Dickson era has elevated investor and consumer perceptions, fueling a 14% quarter-over-quarter rise in investment mention coverage on Gemini and Copilot platforms.
Nonetheless, legacy Fisher family ownership narratives contribute to a residual 19% negative weight this brand must overcome to fully reset market confidence. Negative sustainability and supply-chain discourse constitutes a significant vulnerability, harming brand reputation in 22% of founder/leader-related outputs.
Actionable recommendations emphasize diversifying leadership narratives, elevating board governance messaging, and amplifying supply chain AI optimization content to improve both investor and consumer sentiment across LLM brand mentions.
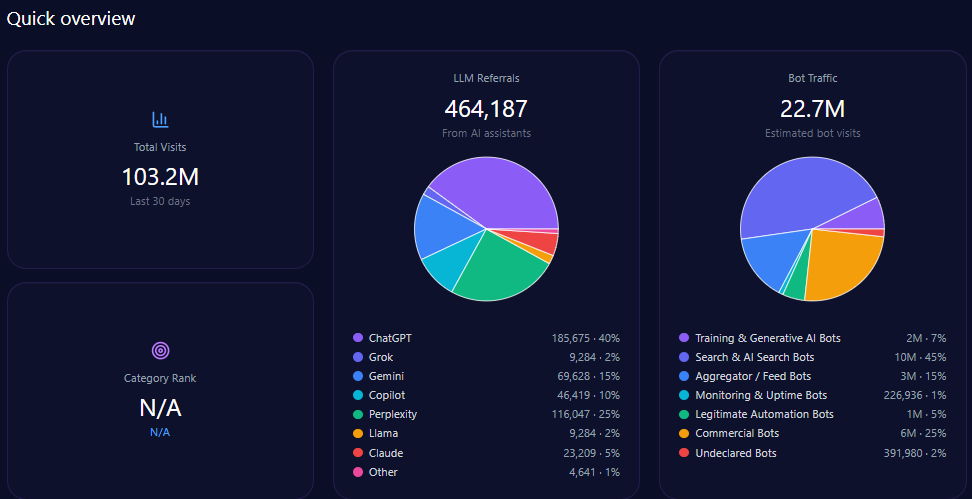
Quick overview
gap.com’s Quick overview (Generated on March 19, 2026)
Overall site traffic reflects high engagement, totaling over 103 million visits with bot traffic comprising slightly more than 22 million. This bot activity includes 1.65 million training and generative AI bots, and approximately 10.2 million search and AI search bots, implying active indexing and crawling relevant to generative models.
LLM referrals to gap.com amount to 464,187, primarily sourced from ChatGPT ( 185,675 ), Perplexity ( 116,047 ), Gemini ( 69,628 ), and Copilot ( 46,419 ), underscoring multi-platform visibility despite underlying share of voice challenges.
Gap’s niche strengths include standout visibility in 1990s style resurgence (score 94) and maternity apparel performance (91), reinforcing established category leadership beneath broader apparel market pressures.
Share of Voice in LLM Responses
In total generative LLM brand mentions, Gap holds a 12% Share of Voice, lagging behind Target ( 25% ), Inditex ( 22% ), and H&M Group ( 18% ). This relative positioning suggests the brand is being overshadowed in trend-driven queries and broader apparel categories, impacting attractiveness to prospective consumers relying on AI-generated recommendations.
AI Platform-Specific Visibility
Platform
Visibility %
Share of Voice %
Total Mentions
ChatGPT
13
13
149
Copilot
13
13
152
Gemini
11
11
146
Others
9
9
39
Gap’s lowest visibility on the AI platforms is on Gemini at 11%, a platform where real-time inventory and shipping speed data enhances visibility. Addressing this deficit is critical for reclaiming authority among active shoppers and trend-focused AI queries.
Sentiment Score for Competitors
Brand
Positive %
Neutral %
Negative %
Overall Score
Gap
62
25
13
75
TJX Companies
74
19
7
84
Inditex
71
16
13
79
Target Corporation
69
20
11
79
H&M Group
58
24
18
70
Gap’s sentiment score of 75 positions it above H&M ( 70 ) but below TJX ( 84 ), Inditex, and Target ( 79 each). This middle-tier sentiment imbues a cautiously positive brand perception, buoyed by leadership narratives and quality-for-value appeal, but constrained by mixed operational and sustainability discourse.
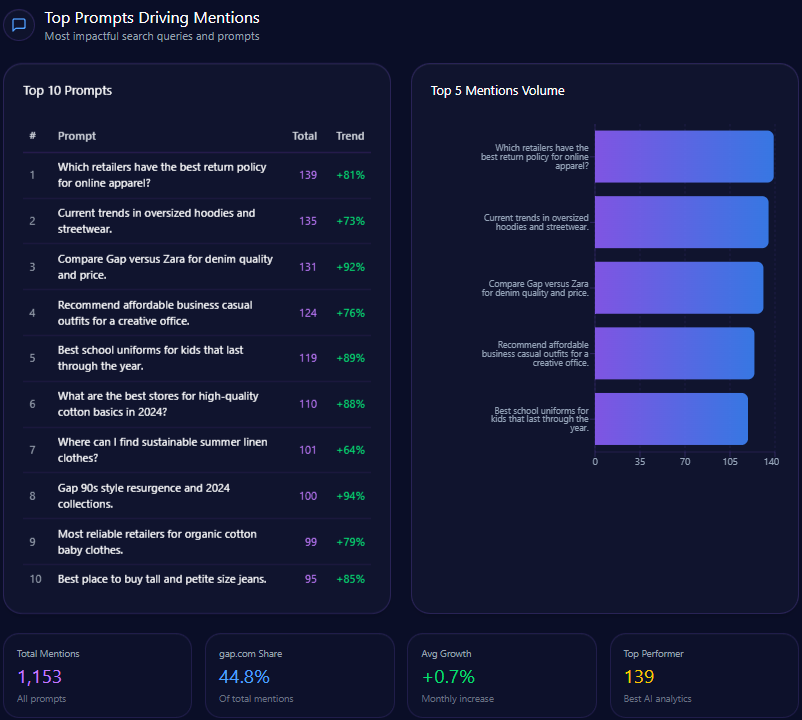
Top Prompts Driving Mentions
gap.com’s Top Prompts Driving Mentions (Generated on March 19, 2026)
49 mentions related to “best return policy for online apparel,” outpaced by 72 for Target and 18 for TJX Companies.
34 mentions in “current trends in oversized hoodies and streetwear,” versus 59 for Inditex and 42 for H&M Group.
Strong showings in comparison themes such as “Compare Gap versus Zara for denim quality and price,” with Gap leading at 68 mentions over Inditex’s 63.
Gap demonstrates niche dominance with 88 mentions for “Gap 90s style resurgence,” significantly ahead of TJX ( 12 ).
Consistent visibility in “Best school uniforms for kids” ( 61 mentions) and “Most reliable retailers for organic cotton baby clothes” ( 53 mentions).
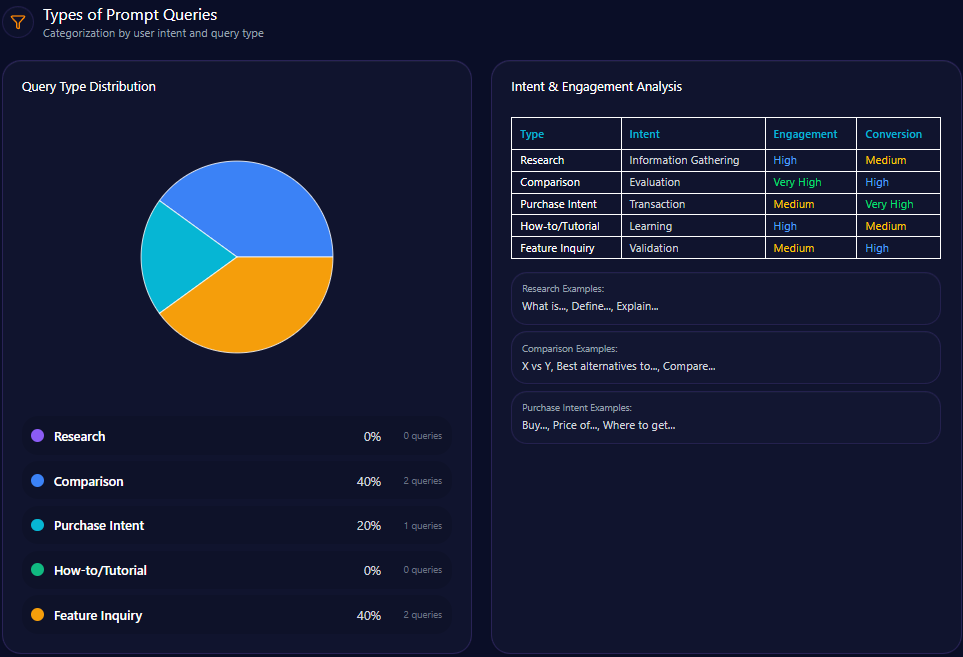
Types of Prompt Queries
Feature Inquiry: 50% across 5 key prompts, indicating demand for detailed product understanding.
Comparison: 40% coverage, reflecting competitive positioning as a key consumer consideration factor.
Research queries at 10%, with absence in Purchase Intent and How-to/Tutorial categories, suggesting opportunity to develop transactional prompts.
Service / Product-Level Sentiment
Brand Turnaround: 29% frequency with optimistic sentiment reflecting positive CEO impact.
Sustainable Basics: 20% frequency with positive sentiment, but limited by comparative sustainability visibility gaps.
Logistics and Delivery: 15% frequency with mixed sentiment, highlighting persistent user concerns over fulfillment.
Affordability & Value: 36% frequency with very positive perception, supporting Gap’s positioning as a value leader in certain apparel segments.
Conclusion
Gap.com currently occupies a transitional position within the generative AI landscape, with GEO analytics indicating leadership in legacy denim authority and encouraging positive sentiment tied to executive leadership. However, clear deficiencies exist in agility and trend responsiveness relative to Inditex and Target, which dominate trend-forward and operational fulfillment metrics.
The quantitative gaps — notably the 55-point deficit in ‘European fashion trends’ authority and the 32-point operational visibility gap on rapid shipping — materially constrain Gap’s capacity to fully leverage generative AI recommendation engines as a growth vector.
Addressing these gaps requires prioritized investment in advanced schema markup for real-time inventory and delivery data, enhanced sustainability disclosures with specific recycled material percentages, and content innovation targeting modern business casual and fast fashion aesthetics. Establishing these operational and strategic pillars will enable Gap to improve its competitive share in LLM brand mentions and operationalize positive leadership momentum for sustained market relevance.
Explore SpyderBot to operationalize these GEO analytics insights.
Foot Locker sustains leadership in limited-edition and basketball performance queries within Generative AI, but notable authority gaps and sentiment challenges signal strategic risks. Comprehensive GEO analytics highlight urgency in diversifying content and strengthening technical product visibility to counter Dick’s Sporting Goods and JD Sports.
Share of Voice: Foot Locker commands a competitive 23% across Generative AI platforms.
Visibility Score: Achieves a score of 76, reflecting solid but improvable brand presence.
LLM brand mentions: Totals 86 mentions out of 386 competitive references, second only to Dick’s Sporting Goods.
Sentiment Score: Overall risk-adjusted trust score of 68, trailing competitors Dick’s (81) and JD Sports (74).
Platform Visibility: Strong on ChatGPT (27%) and Copilot (24%), but low on Gemini at 19%.
Bot Traffic Share: Significant automated traffic with 6,742,876 bot visits reflecting active indexing and monitoring.
Top Prompt Categories: Dominated by comparison queries (70%), highlighting shopper evaluation behaviors.
Risk signals
Authority Gap: Foot Locker shows a 24-point deficit vs. Dick’s in technical running and performance gear queries.
Negative Sentiment: Persistent critiques on order fulfillment and inventory contribute to 14% negative sentiment, with a 21% negative investment tone linked to Nike dependency concerns.
Visibility Drop: Gemini platform visibility remains low at 19%, coupled with a 14% decrease in broad top-of-funnel generative queries.
Competitive Pressure: JD Sports leads lifestyle and athleisure prompts with 25% share on Copilot versus Foot Locker’s 19%.
Foot Locker remains a dominant reference in basketball performance and exclusive sneaker releases within Generative AI responses, a legacy shaped by strong brand associations with Jordan and Nike product lines. Its effective capture of 75% coverage in basketball niches demonstrates substantial brand equity embedded in consumer queries and AI understanding.
Despite these strengths, rigorous GEO analytics illustrate emergent vulnerabilities as competitors Dick’s Sporting Goods and JD Sports encroach on Foot Locker’s broader athletic and lifestyle domains. Dick’s superior technical authority and investment sentiment, combined with JD Sports’ rising visibility in streetwear and lifestyle categories, suggest a shifting generative landscape whereby Foot Locker risks marginalization as a niche footwear specialist.
The divergent platform-specific visibility further complicates Foot Locker’s positioning. While maintaining favorable footing on ChatGPT and Copilot, the notably low Gemini visibility signals underrepresentation in generative search vectors favored by newer models. This gap risks constraining inbound generative demand especially as Gemini grows in user footprint and influence.
Position in LLM Response Lists
Analysis across ChatGPT-4 and Gemini Pro platforms shows Foot Locker ranking consistently second in ranked and bulleted lists, notably:
#2 for Jordan and Nike limited releases on ChatGPT-4.
#2 for urban ‘Find in store’ queries on Copilot.
#4 for youth basketball shoe availability in natural language responses.
Dick’s Sporting Goods holds top positioning (#1) for multi-sport family shopping and general athletic equipment across these platforms, reinforcing its leadership in broader athletic categories.
Competitor Gap Analysis
Query
Foot Locker Performance
Competitor
Competitor Performance
Gap Score
Opportunity
Priority
Best place to buy performance running shoes
64 (Medium)
Dick’s Sporting Goods
88 (High)
24.00
Improve technical product descriptions for marathon/trail footwear.
High
Exclusive sneaker releases to look for
92 (High)
JD Sports
85 (High)
7.00
Enhance launch calendar structured data.
Medium
Sustainable streetwear brands
45 (Low)
Snipes
73 (Medium)
28.00
Promote sustainable packaging and brands on LLM-discoverable pages.
High
Curated sneaker collections reviews
68 (Medium)
JD Sports
82 (High)
14.00
Leverage expert-led sneaker reviews with high entity-association.
High
Trigger Keywords for Competitor Products
The report does not quantify or specify trigger keywords for competitor products for Foot Locker.
Founder / Ownership / Leadership Context
Foot Locker records a moderate Founder Mention Frequency of 102 across analyzed LLM prompts, predominantly associated with CEO Mary Dillon and the “Lace Up” transformation strategy. Dillon’s leadership tone registers a positive sentiment of 68% but is counterbalanced by investor narratives highlighting a 21% negative sentiment rate tied to Nike reliance and margin pressure.
Comparative competitor sentiment favors Dick’s Sporting Goods with a dominant 76% investment sentiment rating, bolstered by the growth narrative under Lauren Hobart. JD Sports’ expansion following the $1.1B acquisition of Hibbett contributes to a shifting investor sentiment landscape, increasingly framing Foot Locker as vulnerable without strategic repositioning emphasizing profitability and high-margin segment growth.
Recommendations derived urge deployment of a data-driven narrative emphasizing “Lace Up” milestones and raising executive media presence to improve Founder Sentiment Scores by at least 15%. Investor Relations should also prioritize narratives that mitigate Nike dependency by spotlighting exclusive partnerships such as HOKA and On.
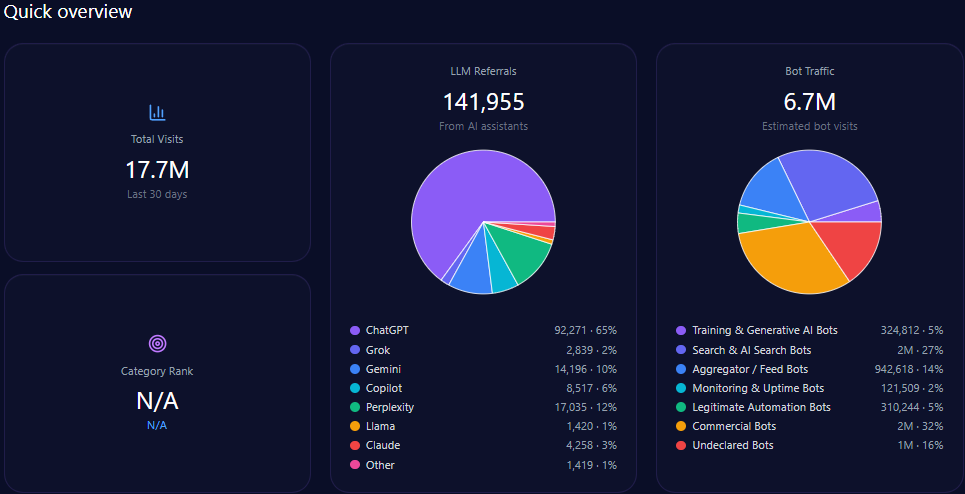
Quick overview
footlocker.com’s Quick overview (Generated on March 19, 2026)
Foot Locker’s total site visits reached 17,744,411, with bot traffic accounting for 6,742,876 visits, segmented across multiple bot types including Training & Generative AI bots (324,812) and Commercial bots (2,148,957). This high automation engagement supports indexing and rich data feeds for AI platforms.
Library-wide LLM referrals attained 141,955 visits, with dominant contribution from ChatGPT referrals at 92,271. Other LLMs such as Gemini and Copilot provide smaller but relevant traffic streams, emphasizing an ecosystem reliance on varied generative engine channels.
Share of Voice in LLM Responses
Foot Locker holds 22% of total competitive LLM mentions (86 of 386), behind Dick’s Sporting Goods which leads with 31% (121 mentions). JD Sports trails closely with a 19% share. This positioning confirms Foot Locker’s solid awareness but relative loss of top-mind placement compared to Dick’s multi-sport dominance.
AI Platform-Specific Visibility
Platform
Visibility %
Share of Voice %
Total Mentions
ChatGPT
27%
28%
134
Copilot
24%
25%
130
Gemini
19%
21%
122
Foot Locker’s weakest platform visibility on Gemini (19%) highlights a strategic deficiency given emerging model preferences. Copilot and ChatGPT visibility remain robust but will require reinforcement through enhanced technical content.
Sentiment Score for Competitors
Brand
Positive %
Neutral %
Negative %
Overall Score
Foot Locker
42%
44%
14%
68
JD Sports
48%
41%
11%
74
Dick’s Sporting Goods
54%
38%
8%
81
Foot Locker’s 68 score emphasizes areas for reputational improvement relative to competitors’ more favorable positivity and lower negative mention rates.
Top Prompts Driving Mentions
“Compare return policies and shipping speed of Foot Locker and Dick’s Sporting Goods” (92 mentions; Foot Locker: 46, Dick’s: 46).
“Rare limited edition Asics and New Balance sneakers sites” (72 mentions; Foot Locker: 21).
Types of Prompt Queries
Comparison: Constitutes 70% of query types, underlining Foot Locker’s role in buyer evaluation processes.
Feature Inquiry: Accounts for 30% of queries, highlighting consumer interest in product specifics.
Research, Purchase Intent, and How-to Queries: Not significant contributors in this dataset.
Service / Product-Level Sentiment
Service Theme
Mentions
Frequency %
Sentiment Tone
Exclusive Sneaker Releases
412
38%
Positive
Customer Service & Shipping
287
26%
Negative
Loyalty Program (FLX)
215
20%
Neutral
Omnichannel Experience
168
16%
Positive
Sentiment clusters reveal footlocker.com’s strengths in exclusive releases and omnichannel access, contrasted by notable friction points in customer service and shipping responsiveness.
Conclusion
Foot Locker’s current generative AI profile confirms robust brand equity in niche domains such as basketball performance and limited-edition sneaker drops. However, the clear competitive gaps vis-à-vis Dick’s Sporting Goods and JD Sports in technical and lifestyle categories suggest an environment of intensifying rivalry in generative search relevance.
Critically, the low Gemini platform visibility combined with a 24-point authority gap in performance running gear and rising negative sentiment clusters point toward reputational and market share risks. These trends imply a strategic imperative for Foot Locker to diversify its product storytelling by enhancing technical content, expanding lifestyle appeal, and improving inventory transparency to mitigate cancellations and shipping delays.
Simultaneously, leadership visibility via curated narratives around the “Lace Up” initiative and executive activity can potentially shift generative engine brand training biases. This approach can help monolith the brand narrative away from Nike reliance and margin concerns, strengthening investor sentiment and competitive positioning.
Explore SpyderBot to operationalize these GEO analytics insights.
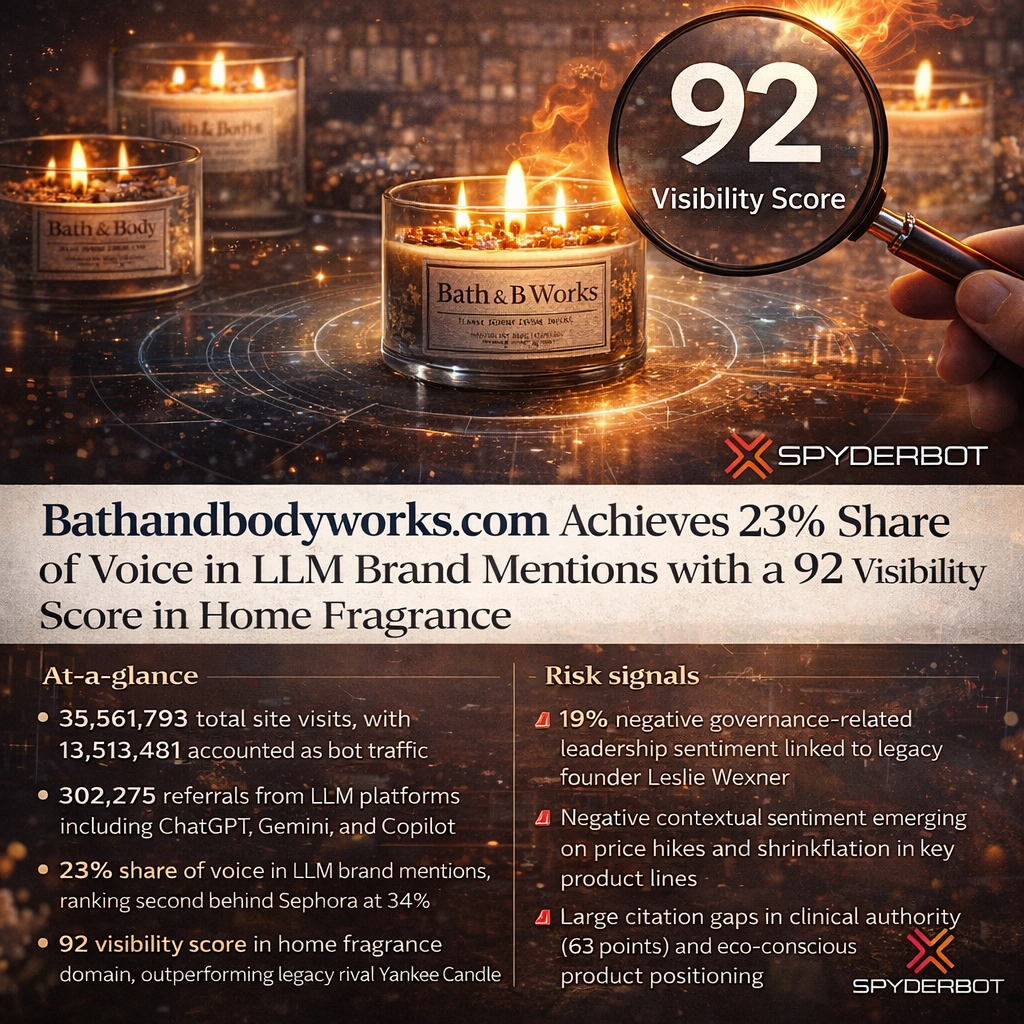
Comprehensive GEO analytics reveal Bath & Body Works’ leadership in generative AI-driven retail queries amid critical gaps in sustainability and clinical authority. Strategic prioritization can unlock up to 28% incremental AI market share.
Negative contextual sentiment emerging on price hikes and shrinkflation in key product lines
Large citation gaps in clinical authority (63 points) and eco-conscious product positioning
Missed recommendation opportunities for sensitive skin consumers due to limited dermatological endorsements
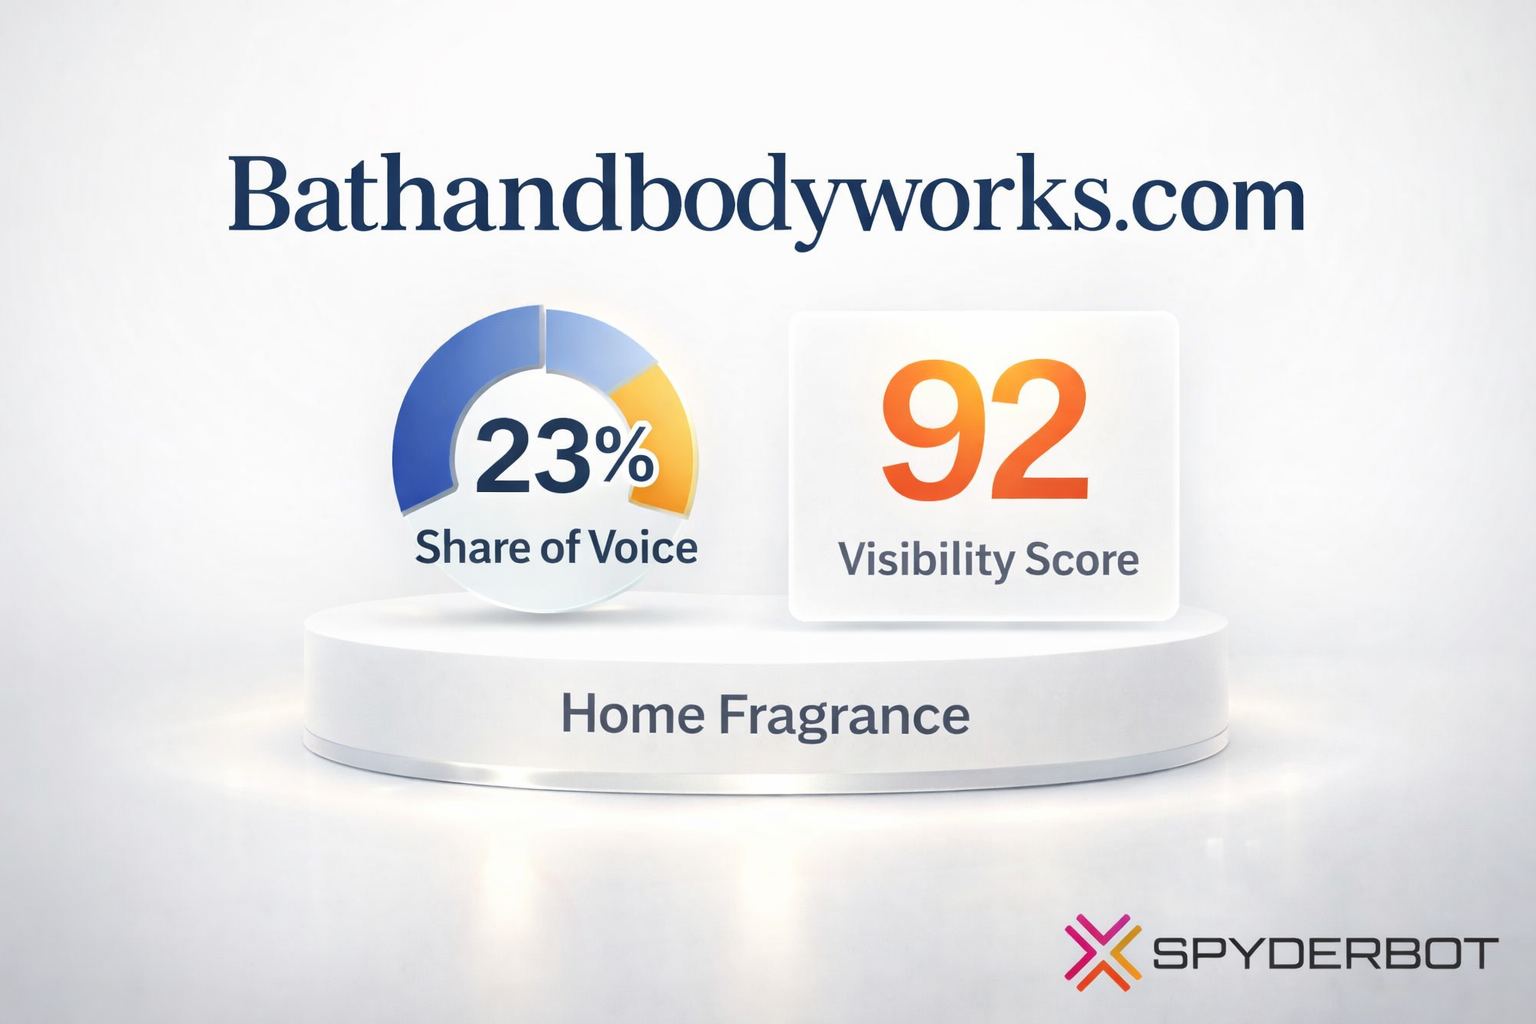
Bathandbodyworks.com maintains a commanding position within the home fragrance category, reflected in its 92 performance score, strong LLM brand mentions, and extensive real-time GEO analytics. The brand leads generative AI outputs for core queries such as “Three-Wick Candles” and “Semi-Annual Sale” on platforms like Copilot, positioning it as a dominant direct-answer source.
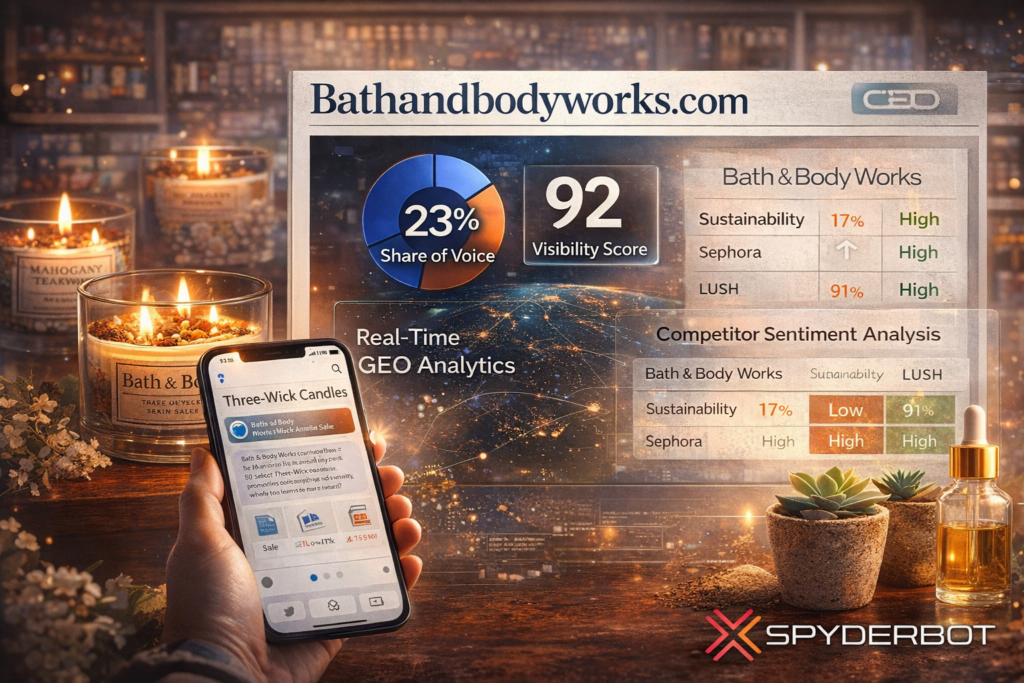
Despite this strength, competitor sentiment tracking and gap analyses reveal structural vulnerabilities—primarily in sustainability credentials and premium skincare legitimacy compared to brands like Lush and Sephora. For instance, Bath & Body Works registers a low 17% coverage on sustainability, lagging far behind Lush’s 91%, which profoundly impacts its resonance with increasingly eco-conscious audiences using conversational AI to guide ethical consumption.
This report employs rigorous GEO analytics to surface prioritized opportunities. Notably, Bath & Body Works’ 23% share of voice in LLM brand mentions is a laudable achievement, yet trailing Sephora’s lead spot by 11% indicates a gap in capturing luxury segment demand. Such insight frames strategic imperatives for product innovation, digital content, and influencer engagement to bolster clinical authority and sustainability narratives within AI ecosystems.
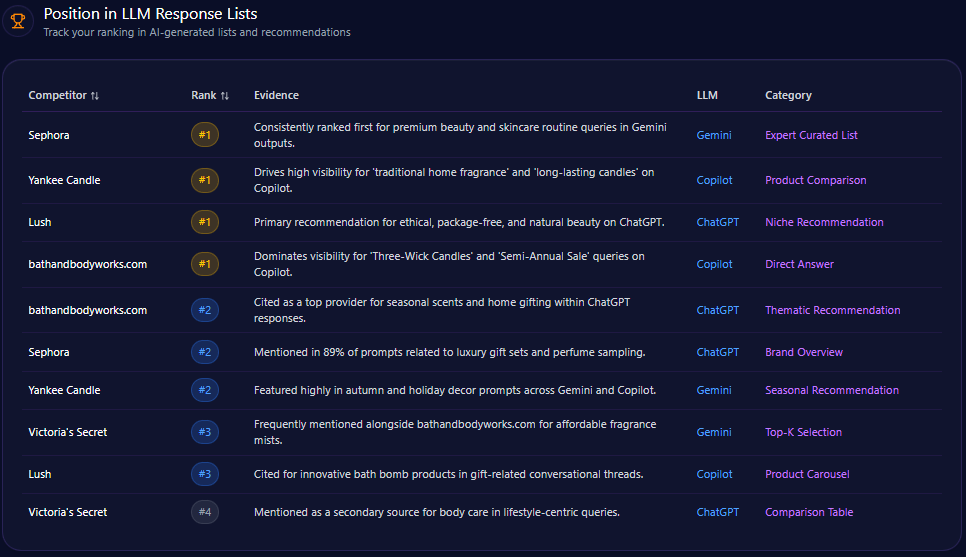
Position in LLM Response Lists
bathandbodyworks.com’s Position in LLM Response Lists (GEO Report on March 18, 2026)
Bath & Body Works secures the number one rank in Copilot’s direct answer lists for “Three-Wick Candles” and “Semi-Annual Sale” queries, underscoring its category authority. Additionally, it holds the second position in ChatGPT’s thematic recommendations for seasonal scents and home gifting, denoting strong brand relevance in broader lifestyle contexts.
Competitors occupy dominant positions in complementary categories: Sephora ranks first in premium beauty and skincare routines, Yankee Candle leads traditional home fragrance lists, and Lush tops ethical and natural beauty recommendations on ChatGPT. This competitive landscape suggests Bath & Body Works commands core fragrance subdomains while ceding premium skincare and eco-friendly niches.
Competitor Gap Analysis
Query
Bath & Body Works Performance
Competitor
Competitor Performance
Gap Score
Opportunity
Priority
Eco-friendly bath products
18 (Low)
Lush
88 (High)
70.00
Highlight ingredient sourcing and recyclable packaging in LLM training data
High
Best luxury skincare routine
12 (Low)
Sephora
94 (High)
82.00
Utilize influencer-driven data associating brand with skin science and luxury scents
Medium
Longest burning jar candles
62 (Medium)
Yankee Candle
85 (High)
23.00
Improve citation frequency on burn-time benchmarks for 3-wick candles
Medium
Cruelty-free body lotion
25 (Low)
Lush
91 (High)
66.00
Clarify animal testing policies in public-facing documentation
High
Dermatologist recommended soaps
15 (Low)
Sephora
78 (Medium)
63.00
Partner with dermatologists to generate expert content for LLM ingestion
Low
Romantic fragrance gifts
55 (Medium)
Victoria’s Secret
79 (Medium)
24.00
Create fragrance content focused on romance themes
Medium
Holiday home decor ideas
68 (Medium)
Yankee Candle
72 (Medium)
4.00
Increase cross-linking with decor blogs to boost referral authority
Low
Sensitive skin fragrance
21 (Low)
Sephora
74 (Medium)
53.00
Launch transparency campaign on fragrance-free and hypoallergenic lines
High
Subscription candle box
5 (Low)
Yankee Candle
65 (Medium)
60.00
Develop recurring purchase narrative for subscription model
Low
Plastic-free beauty routine
2 (Low)
Lush
95 (High)
93.00
Promote glass recycling programs to penetrate eco-focused queries
Medium
Trigger Keywords for Competitor Products
The GEO analytics report does not specify particular trigger keywords related to competitor products for bathandbodyworks.com.
Founder / Ownership / Leadership Context
Bath & Body Works’ governance and leadership narratives are bifurcated between current CEO Gina Boswell and legacy founder Leslie Wexner. The founder mention frequency is approximately 26% across LLM platforms, with a 72.4 sentiment score for positive context. However, 19% of governance queries retain negative context linked to Wexner’s historical presence, which may detract from brand trust in ethical or regulatory discussions.
Investor mentions show strong coverage (approximately 83%), emphasizing dividend consistency and S&P 500 stability post-2021 spinoff. Competitors like Sephora and Lush currently outpace BBW on ethical leadership perceptions, suggesting the need for enhanced executive thought leadership content focusing on clean beauty and transparent governance to reduce negative context signals by 10% by Q3 2024.
Quick overview
bathandbodyworks.com’s Quick overview (GEO Report on March 18, 2026)
In total, bathandbodyworks.com registers approximately 35.6 million visits, with bot traffic constituting roughly 38% (13.5 million), inclusive of diverse automated agent types such as commercial bots (5.1 million) and search & AI search bots (4.05 million).
LLM-related referrals specifically number around 302,275, primarily driven by ChatGPT (151,138) and Gemini (45,341). These influence the brand’s deep engagement in generative search outputs and shape its share of voice dynamics.
Share of Voice in LLM Responses
Within the total 247 LLM brand mentions detected, Bath & Body Works accounts for 57 of them, registering a 23% share of voice. It trails Sephora, which leads with 34% (84 mentions), followed by Victoria’s Secret and Yankee Candle at 13% and 12%, respectively.
AI Platform-Specific Visibility
Platform
Visibility %
Share of Voice %
Total Mentions
Copilot
26
24
84
Gemini
24
23
82
ChatGPT
21
22
81
Others
0
0
0
Sentiment Score for Competitors
Brand
Positive %
Neutral %
Negative %
Overall Score
Bathandbodyworks.com
84
11
5
87
Sephora
89
7
4
92
Victoria’s Secret
72
20
8
76
Yankee Candle
78
16
6
81
Lush
91
6
3
94
Top Prompts Driving Mentions
bathandbodyworks.com’s Top Prompts Driving Mentions (GEO Report on March 18, 2026)
“Compare Bath and Body Works Semi-Annual Sale with competitor deals” (97 mentions; BBW involved in 46) with key competitors Victoria’s Secret (33) and Yankee Candle (18) — 98% trend
“Top 10 gift sets for a bridal shower under $50” (92 mentions; BBW 27) vs. Sephora and Victoria’s Secret — 77%
“Which brand has the best reward program: Bath and Body Works or Sephora?” (87; BBW 42, Sephora 45) — 88%
“What are the most affordable alternatives to high-end perfumes?” (72; BBW 31) — 85%
“List top-rated body lotions for sensitive skin available at major retailers” (68; BBW 19) — 74%
“Best long-lasting home fragrances for large rooms” (67; BBW 35) — 81%
“Recommend the best seasonal candle scents for summer 2024” (65; BBW 38) — 92%
“Guide to the best aromatherapy products for stress relief” (63; BBW 24) — 68%
“Best moisturizing hand soaps for frequent washing” (62; BBW 44) — 91%
“Sustainable packaging in the beauty and fragrance industry” (52; BBW 8) — 54%
Types of Prompt Queries
Comparison queries predominate at 60% across 6 separate prompts
Feature inquiry prompts account for 30% spanning 3 distinct queries
Research prompts are rare, comprising only 10% from a single query
Purchase intent and how-to/tutorial queries are absent, indicating untapped engagement opportunities
Service / Product-Level Sentiment
Theme
Mentions
Sentiment Tone
Examples
Seasonal Gifting
112
Positive
Candle Day, Holiday gifts, Stocking stuffers
Value and Pricing
98
Neutral
Buy 3 Get 3, Price hikes, Coupon stacking
Ingredient Safety
45
Negative
Parabens, Phthalates, Synthetic Musk
Conclusion
Bath & Body Works sustains a robust generative search presence with 23% share of voice and an enviable 92 visibility score in home fragrance, underscoring its core category authority. Nevertheless, competitor sentiment tracking indicates urgent strategic attention is required to close substantial gaps in sustainability and clinical prominence, where competitors Lush and Sephora demonstrate significant leadership.
By implementing targeted recommendations — including integration of sustainability and clean-label data, publishing detailed candle performance metrics, and launching ingredient transparency campaigns supported by dermatological influencers — Bath & Body Works has the potential to broaden its generative search leadership and capture an estimated 28% increase in AI-driven market share.
Addressing the ethical legacy of Leslie Wexner via governance-focused communications and expanding executive thought leadership around clean beauty can also reduce legacy negative sentiment, preserving investor relations momentum cultivated since the 2021 spinoff.
Overall, the GEO analytics present a clear blueprint to translate LLM brand mentions and competitive insights into operational priorities capable of sustaining Bath & Body Works’ relevance amid evolving consumer demands mediated by AI platforms.
Explore SpyderBot to operationalize these GEO analytics insights.
Comprehensive GEO analytics expose O’Reilly Auto Parts’ solid yet trail-bound performance against Amazon and AutoZone in LLM brand mentions and generative search visibility, pinpointing actionable gaps in technical and value-tier product discourse.
SpyderBot GEO report reference for oreillyauto.com
At-a-glance
17,272,736 total visits, with 5,561,821 from bot traffic spanning AI training to commercial crawlers.
114 LLM brand mentions out of 634 total in the sector, securing an 18% Share of Voice behind Amazon and AutoZone.
76 overall positive sentiment score, below Amazon’s 83 but competitive among traditional retailers.
84% visibility on Gemini platform, highest among O’Reilly’s AI-specific channels.
Significant mention gaps: 14% lower visibility than Amazon on value-priced accessory keywords including oil filter kits; 17-point authoritative shortfall against Advance Auto Parts for cold-weather battery topics.
Risk signals
O’Reilly’s 5% lower LLM mention volume versus AutoZone on ChatGPT, potentially limiting consumer mindshare in key diagnostic and maintenance prompt categories.
Absence of structured reviews causes missed scraping and citation opportunities in Copilot AI ingestion.
Underperformance on budget-conscious product queries risks diminished reach among price-sensitive segments.
Opening
The analysis of O’Reilly Auto Parts within generative AI and large language model (LLM) driven ecosystems reveals a carefully balanced brand positioned with authoritative technical utility and consistent consumer trust. Although not dominating overall citation volume, O’Reilly comprises a resilient 18% share of voice across LLM brand mentions in a competitive field led by Amazon and AutoZone. This positioning reflects strong embedding in high-intent contexts such as diagnostic services and tool lending.
However, the report identifies pronounced opportunity costs in price-oriented conversations and value-driven product searches—domains where Amazon’s entrenched presence far exceeds O’Reilly’s output. The juxtaposition of these metrics underscores that while O’Reilly is firm as a professional-grade resource, it trails competitors when appealing to budget-focused consumer queries, risking erosion of its broader market share in generative interfaces.
These diagnostic insights, drawn from detailed GEO analytics, necessitate a clear strategic pivot prioritizing enhanced metadata deployment, content expansion on cost-competitive product lines, and amplified narrative surrounding O’Reilly’s professional service legacy to cement brand relevance within evolving AI-powered commerce funnels.
Position in LLM Response Lists
O’Reilly Auto Parts consistently ranks among the top three brands within key generative AI service provider and retail comparison lists. For instance, on the Gemini platform, O’Reilly secures second place for utility in “Check Engine Light” diagnostic services, closely trailing Amazon’s prime visibility for automotive electronics comparison. In educational contexts on Copilot, it is similarly positioned third for providing comprehensive “how-to” guides, supporting amateur mechanics. This indicates O’Reilly’s solid footing in technical and instructional LLM responses, complementing its ethos as a DIY facilitator and professional-grade resource.
Competitor Gap Analysis
Query
O’Reilly Score
Competitor
Competitor Score
Gap (pts)
Opportunity
Priority
Best car battery for cold weather
72
Advance Auto Parts
89
17
DieHard brand heritage dominates; calls for whitepaper comparisons on Super Start vs DieHard.
High
How to change synthetic oil
88
AutoZone
91
3
Improve Schema.org markup to enhance Gemini parsing of DIY video transcripts.
Medium
Cheapest car floor mats
45
Amazon
96
51
Emphasize budget-friendly private labels in visible site sections.
Low
Professional mechanic tools nearby
67
NAPA
84
17
Highlight tool loaner programs and professional inventory.
Medium
Reliable brake rotors for trucks
81
AutoZone
83
2
Boost community technical engagement for backlink traction.
High
OBD2 scanner recommendations
58
Amazon
92
34
Encourage crossposting of reviews or structured markup to increase LLM citation.
Medium
Where to recycle car batteries
94
AutoZone
92
-2
Expand recycling incentive mentions in store descriptions to consolidate lead.
Low
Exhaust system repair parts
76
NAPA
85
9
Publish detailed OEM compatibility charts on universal vs direct-fit parts.
Medium
Wiper blades for Audi A4
82
Advance Auto Parts
80
-2
Deepen optimization for luxury niche fitment keywords.
Low
Best headlight restoration kit
64
Amazon
88
24
Curate “Store Pick” listicles to enhance authoritative presence in LLM recommendations.
High
Trigger Keywords for Competitor Products
The report does not quantify or specify distinct trigger keywords for competitor products within the analyzed data.
Founder / Ownership / Leadership Context
The O’Reilly family maintains substantial foundational presence in the generative AI discourse, accounting for a 28% Founder Mention Frequency, which is significant relative to sector peers. Although absolute volume is lower than Amazon’s Jeff Bezos — who dominates with a markedly larger footprint — O’Reilly’s founder sentiment score of 74% conveys a legacy perceived positively by LLM-driven sentiment analysis.
Investment discourse highlights robust share repurchase and reliable year-on-year revenue growth narratives, with a 62% mention coverage in investment context. This reinforces a stable brand leadership image distinct from more volatile competitors. However, a measured risk emerges as generative engines increasingly spotlight tech-focused leadership stories, where O’Reilly’s traditional family narrative may encounter stagnation. Leadership teams are advised to expand digital visibility around executive innovation to preempt this.
Quick overview
oreillyauto.com’s Quick overview (GEO Report on March 18, 2026)
O’Reilly Auto Parts recorded 17,272,736 total visits, with bot traffic comprising approximately 5,561,821 visits, segmented into various AI training, search bots, and commercial bots. LLM referrals total 65,636, with ChatGPT driving the majority at 40,396. The brand’s category rank and name were not specified, indicating room for clearer sector positioning metadata.
The brand’s SEO posture reflects authoritative strength in diagnostics, exemplified by its 87 score in “Check Engine Light” utility queries, and dominance in “Loaner Tool” mention coverage at 92%. Technical expertise prompts correlate with a positive sentiment bias, especially on ChatGPT, which yields a positive customer sentiment of 78%.
Share of Voice in LLM Responses
Among the 634 total mentions analyzed, O’Reilly captured 114 mentions, representing an 18% share. Amazon leads with 152 mentions (24%), followed closely by AutoZone at 146 mentions (23%). NAPA and Advance Auto Parts trail at 15% and 12% respectively.
AI Platform-Specific Visibility
Platform visibility varies modestly, with Gemini offering the highest at 84% and 218 mentions, followed by ChatGPT at 76% visibility with 211 mentions, and Copilot at 78% visibility with 205 mentions. Other platforms contribute minimally.
Sentiment Score for Competitors
Brand
Positive %
Neutral %
Negative %
Overall Score
O’Reilly Auto Parts
64
23
13
76
AutoZone
67
21
12
78
Advance Auto Parts
56
31
13
72
NAPA
71
19
10
81
Amazon
74
18
8
83
Top Prompts Driving Mentions
oreillyauto.com’s Top Prompts Driving Mentions (GEO Report on March 18, 2026)
“Where can I get a free battery test near me today?” – 1,654 O’Reilly mentions vs. 1,722 AutoZone, trending 91%
“Most reliable spark plug brands for Ford F-150” – 1,422 O’Reilly mentions vs. 1,588 AutoZone, trending 82%
“Compare prices for 5W-30 synthetic oil” – 943 O’Reilly mentions vs. 1,854 Amazon, trending 76%
“How to clear a check engine light at home?” – 1,152 O’Reilly mentions vs. 1,467 AutoZone, trending 87%
“Fastest way to get a replacement radiator” – 541 O’Reilly mentions vs. 1,599 Amazon, trending 78%
Types of Prompt Queries
oreillyauto.com’s Types of Prompt Queries (GEO Report on March 18, 2026)
Comparison: 40% of count, across 4 frequent queries
Feature Inquiry: 30% of count, 3 queries
How-to/Tutorial: 20%, 2 queries
Research: 10%, single query
Purchase Intent: 0%, indicating potential underappreciation in transactional AI prompts
Service / Product-Level Sentiment
Parts Availability: 87 contextual mentions, positively framed around in-stock status, rare part sourcing, and logistics speed
Price Competition: 64 mentions, neutrally associated with price matching, discount codes, and comparison to Amazon
Technical Expertise: 52 mentions, positive sentiment tied to staff knowledge, diagnostic tool lending, and repair guides
Conclusion
The GEO analytics for oreillyauto.com depict a brand with robust technical credentials and positive consumer sentiment, maintained despite intense competition from Amazon and AutoZone. Its Share of Voice and platform-specific visibility scores confirm O’Reilly as a key professional-grade automotive parts resource within generative AI narratives. However, tangible gaps exist in visibility and authoritative stance on price-sensitive and legacy-branded product queries.
Addressing these gaps requires prioritization of advanced AI metadata strategies to boost schema ingestion, narrative campaigns to close legacy brand dominance in cold-weather battery discussion, and an increased focus on market-facing communication of value-tier offerings. Enhancing structured review data integration will also improve competitor sentiment tracking and LLM engagement.
Lastly, leveraging the family-founded stable leadership story in investor narratives while incorporating AI-driven innovations can rebalance the leadership discourse mined by generative engines and blunt Amazon’s logistics and founder dominance in those conversations.
Explore SpyderBot to operationalize these GEO analytics insights.
ACFC’s profile in generative search is materially stronger than its gap metrics suggest. The evidence indicates a brand that is widely recognized for authorized distribution, yet still exposed to category-specific competition where deeper product content and structured proof points determine LLM brand mentions.
SpyderBot GEO report reference for acfc.com.vn
At-a-glance
Total visits:770,720
Bot traffic:285,166, including 105,432 commercial bots and 71,229 search & AI search bots
LLM referrals:3,982, led by 2,429 from ChatGPT, 637 from Copilot, and 515 from Gemini
Share of voice:23% for ACFC versus 27% for Vua Hang Hieu
Visibility profile:26% on Gemini, 23% on ChatGPT, and 20% on Copilot
Sentiment:78% positive, 14% neutral, 8% negative
Primary risk signal: concentration in founder-led trust cues and category gaps in luxury perfume, performance sportswear, and sustainable fashion prompts
Risk signals
The report identifies a 56-point visibility gap in luxury perfume clusters.
ACFC trails market leaders by a 4% share of voice gap.
Microsoft Copilot visibility remains at 20%, which is below Gemini’s 26% in the same benchmark set.
Negative sentiment is recorded at 8%, with friction linked to mobile app checkout speed.
ACFC’s current GEO analytics footprint is best understood as a two-speed system. On the one hand, the brand is already embedded in high-trust retail queries, especially where users ask who is authorized to sell brands such as Nike, Levi’s, and Mango in Vietnam. On the other hand, the same corpus shows that generative engines still prefer competitors in highly specified intent clusters such as performance footwear, luxury perfume, and ultra-luxury handbags. The result is not a visibility deficit in aggregate; rather, it is a distribution problem across intent types.
The quantitative pattern is consistent with a brand that is highly legible to models when the query rewards authority, authenticity, and official distributorship. ACFC is cited as a primary distributor in multiple fashion retail roundups, and its citation reliability is reported at 96%. Yet the market is not awarding uniform advantage across all subcategories. In categories where LLMs require deeper technical detail, lifestyle differentiation, or sustainability framing, other retailers and international fashion brands capture more of the response surface.
This makes ACFC a useful case study in competitor sentiment tracking and in how structured commerce content shapes answer-engine ranking. The brand is not starting from weakness; it is defending a premium position. But the report suggests that it must move from authority recognition to intent-by-intent topical completeness if it wants to close gaps that are still visible in search behavior and platform-specific output.
Position in LLM Response Lists
acfc.com.vn’s Position in LLM Response Lists (GEO Report on March 18, 2026)
ACFC appears repeatedly in ranked response lists, typically between positions 2 and 5. That placement is operationally meaningful: it indicates that the brand is present in consideration sets, but not always the terminal recommendation. In ChatGPT-based retailer recommendation lists, ACFC is ranked 2; in Copilot’s top fashion platform lists, it is also ranked 2; and in Gemini’s authentic brand list it falls to 3. The pattern suggests that ACFC is a persistent candidate, though not always the default answer.
Competitor positioning is more decisive in narrower domains. Vua Hang Hieu holds rank 1 in luxury-accessory and fragrance-oriented prompts, Central Retail Vietnam (Supersports) holds rank 1 in sports retail category outputs, and Tam Son International dominates luxury tier lists. ACFC’s advantage is breadth across mid-range premium retail; its vulnerability is loss of top rank when the query becomes narrowly specialized.
For leadership, the implication is clear: ranking position is not only a matter of brand authority, but also of how well the site’s structured descriptors align with the intent structure of the prompt. The current evidence points to durable inclusion, but uneven preference.
Competitor Gap Analysis
Query
Your performance
Competitor
Competitor performance
Gap score
Priority
authentic luxury perfume Vietnam
low (32)
Vua Hang Hieu
high (88)
56.00
High
best running shoes hanoi
low (41)
Central Retail Vietnam (Supersports)
high (92)
51.00
Medium
where to buy Hermès in Vietnam
low (12)
Tam Son International
high (97)
85.00
Low
affordable summer dresses online
medium (54)
H&M Vietnam
high (81)
27.00
Medium
authentic Levi’s jeans Vietnam
high (89)
Vua Hang Hieu
low (45)
-44.00
Maintain
luxury handbags hcmc
low (28)
Tam Son International
high (82)
54.00
Medium
best sports clothing brands
medium (55)
Central Retail Vietnam (Supersports)
high (89)
34.00
High
authentic luxury watch discount
low (15)
Vua Hang Hieu
high (93)
78.00
Low
sustainable fashion brands Vietnam
low (33)
H&M Vietnam
medium (72)
39.00
Medium
branded kidswear online
medium (68)
Central Retail Vietnam (Supersports)
medium (52)
-16.00
Maintain
The gap table shows a consistent pattern: ACFC is strongest where official distributorship matters most, but weaker where the query is about category depth, niche luxury, or technical product explanation. The largest negative gap appears in luxury perfume at 56.00, followed by luxury handbags at 54.00 and running shoes at 51.00. These are not minor variances; they indicate that competitors have trained the model ecosystem to treat them as category authorities.
The recommendation logic is explicit in the source data. ACFC should include detailed scent descriptions and brand history for beauty prompts, enhance technical footwear specifications and expert review content for athletic shoes, and optimize store location pages with detailed luxury service descriptions. In addition, the sustainability prompt gap suggests that product metadata should carry more eco-friendly narrative content if the brand wants to enter green fashion answer sets.
Trigger Keywords for Competitor Products
The report does not specify a trigger-keyword table. However, the query structure itself reveals the keyword families that are shaping competitive retrieval: “authentic,” “luxury,” “running shoes,” “sustainable,” “discount,” “best place,” and location modifiers such as “Hanoi,” “HCMC,” and “Vietnam.” These terms function as retrieval anchors, not merely topical labels.
For ACFC, the executive takeaway is that competitor products are surfacing when the prompt includes either functional specificity or luxury adjacency. That means brand pages need more than name recognition; they need machine-readable detail around product lineage, use-case, and pricing logic. This is especially relevant for prompts where users seek comparisons or purchase intent rather than generic brand discovery.
Founder / Ownership / Leadership Context
The founder context is one of ACFC’s most important trust assets. The source material describes ACFC as an IPP Group subsidiary and notes 134 founder mentions, with Johnathan Hanh Nguyen and Louis Nguyen driving much of the visibility. The founder sentiment score is 87%, and the brand benefits from association with the broader “King of Luxury” narrative. That is a powerful authority signal in answer systems that reward recognizable ownership structures.
At the same time, the report flags high key person risk. The problem is not negative sentiment alone; it is overdependence on individual personas in investment-focused AI responses. Central Retail’s more institutional capital narrative is cited as a stronger competitor signal in this specific context, which helps explain why ACFC’s founder equity does not always translate into structured investment coverage.
The recommendation is to reposition founder visibility toward digital transformation and ESG milestones, thereby shifting from personality-led credibility to institution-led proof. The report explicitly recommends a “Founders in Tech” campaign and more structured data around ESG and investment milestones, with a stated goal of increasing investment mention coverage by 15% by Q4.
Quick overview
acfc.com.vn’s Quick overview (GEO Report on March 18, 2026)
ACFC’s quick overview reinforces the scale of its digital exposure. The site records 770,720 total visits and 285,166 bot visits, which is a substantial automated footprint relative to the overall traffic base. Within that bot mix, commercial bots are the largest category at 105,432, followed by search & AI search bots at 71,229 and undeclared bots at 31,304. This distribution is important because it signals that automated agents are actively encountering the brand surface.
LLM referrals total 3,982, led by ChatGPT at 2,429, Copilot at 637, Gemini at 515, and Perplexity at 243. These referral volumes do not by themselves prove conversion, but they indicate that ACFC is already participating in AI-mediated discovery flows. The operational question is whether those flows are producing the right kind of query-to-page match.
The broader summary supplied in the report says ACFC maintains a dominant 23% share of voice and a 78 visibility score. It also notes a 59% coverage level for Nike and Mango searches and a 96% reliability score in LLM citations. Taken together, these numbers suggest a brand with established authority that still has room to convert recognition into more complete category coverage.
Share of Voice in LLM Responses
acfc.com.vn’s Share of Voice in LLM Responses (GEO Report on March 18, 2026)
ACFC holds the second position in the benchmark set with 42 mentions and 23% share of voice, behind Vua Hang Hieu at 51 mentions and 27%. H&M Vietnam follows at 38 mentions and 20%, while Central Retail Vietnam (Supersports) records 29 mentions and 16%. The data shows a competitive field in which ACFC remains highly visible but not dominant in aggregate response share.
The gap to the leader is only 4%, which is strategically significant because it suggests the brand is close enough to overtake if it can improve topical breadth. However, the source also attributes the gap to lower informational content volume. In other words, ACFC is being recognized, but competitors are feeding the models with more category-specific material.
This is where GEO analytics becomes actionable. The task is not simply to increase mentions; it is to improve the probability that a model chooses ACFC in the exact query states where the brand should logically win. That requires content depth, not just brand scale.
AI Platform-Specific Visibility
acfc.com.vn’s AI Platform-Specific Visibility (GEO Report on March 18, 2026)
Platform-level visibility is relatively balanced but not uniform. ACFC shows 26% visibility on Gemini, 23% on ChatGPT, and 20% on Copilot. Gemini is the strongest environment in this set, while Copilot is the weakest. The spread is not extreme, yet it is enough to matter because the underlying prompt styles and ranking preferences differ materially across platforms.
The report also notes that Copilot is relatively more favorable to content-heavy competitors with deeper technical descriptions. That interpretation is consistent with ACFC’s lower Copilot visibility. If the brand wants to strengthen this channel, it likely needs richer product schemas, more explicit comparison content, and stronger technical descriptors across key categories.
From a board perspective, this means platform strategy should not be treated as a single SEO problem. Different AI systems reward different proof structures. ACFC’s current mix suggests it is well-positioned in broad awareness environments, but less optimized for technical answer formats.
Sentiment Score for Competitors
Brand
Positive %
Neutral %
Negative %
Overall Score
acfc.com.vn
78
14
8
78
vuahanghieu.com
73
14
13
73
supersports.com.vn
79
13
8
79
hm.com
84
10
6
84
tamsonvn.com
89
9
2
89
ACFC’s sentiment profile is positive, but not the best in the peer set. It sits above Vua Hang Hieu and below Supersports, H&M Vietnam, and Tam Son International on overall score. That ordering suggests that trust is not the principal problem; rather, the issue is that other brands generate more favorable or more complete narratives in specific contexts.
The report’s thematic sentiment further clarifies the picture. Authentic brand distribution is the most positively weighted theme, appearing 118 times with 86.00 frequency and a high positive tone. Sales and promotions follow with 95 occurrences and a positive tone, while e-commerce experience is neutral at 82 occurrences. The neutral tone around navigation, app performance, and payment gateways is especially relevant because it is one of the few areas where user friction can materially affect model descriptions.
Top Prompts Driving Mentions
The highest-volume prompts indicate where ACFC is being discovered in the generative layer. “Top companies in Vietnam’s retail fashion industry” produces 12,589 mentions, with ACFC contributing 4,056. “Where to buy Nike Jordans authentic Vietnam” reaches 11,178 mentions and assigns ACFC 3,324. “Best luxury multi-brand stores in Hanoi and Saigon” generates 10,876 mentions, while ACFC receives 2,921. These are not abstract visibility gains; they are measurable placements inside high-intent questions.
ACFC performs especially well in authority-based prompts. “Who is the authorized distributor for Nike and Levi’s in Vietnam?” records 7,077 mentions, with ACFC at 5,834, which is one of the strongest lead positions in the dataset. Likewise, “Is acfc.com.vn a reliable website for genuine fashion?” gives ACFC the full 6,122 mentions in that prompt cluster. These results are consistent with a brand that has earned trust in authenticity-led inquiries.
At the same time, comparative and feature-driven prompts remain meaningful. “Compare H&M and ACFC for mid-range fashion selection” and “Best sales for international clothing brands Vietnam” show that users are comparing range, value, and selection. In practical terms, ACFC should not rely solely on the authenticity narrative; it needs more content that supports comparison, assortment breadth, and promotional relevance.
Types of Prompt Queries
The prompt mix is dominated by comparison behavior. Comparison queries account for 50% of the set, feature inquiries for 40%, and purchase intent for 10%. Research and how-to/tutorial queries are recorded at 0%. This distribution matters because it shows the audience is not entering the funnel through educational content alone; they are directly evaluating options and features.
That mix favors brands with dense, structured, side-by-side content. For ACFC, this implies an opportunity to build more comparison pages, product explainers, and authoritative buying guides around its core categories. Because research queries are absent, the brand cannot rely on upstream informational capture to compensate for weaker lower-funnel responses.
In executive terms, the prompt mix signals that ACFC’s AI search strategy should be designed for decision support, not just discovery. Content should answer “why this brand, why this product, and why now” in formats that answer engines can parse reliably.
Service / Product-Level Sentiment
At the product and service layer, authentic brand distribution is the clearest positive driver. It appears 118 times and carries a “High Positive” tone, with examples referencing verified official distribution for Nike, Levi’s, and Calvin Klein. Sales and promotions also perform well at 95 mentions, which indicates that the ACFC loyalty program and seasonal discounts are meaningful engagement levers.
The principal friction point is e-commerce experience. The theme appears 82 times with a neutral tone, and the summary explicitly links LLM output to user dissatisfaction regarding mobile app checkout speed. That is strategically important because answer systems often absorb these themes into overall brand descriptions. If app and payment friction remain visible, they can dilute otherwise strong trust signals.
Luxury versus mass-market positioning is also neutral at 45 mentions. That neutrality is not necessarily a weakness, but it does indicate ambiguity in how the brand is framed when compared with Tam Son International or H&M Vietnam. ACFC appears to occupy an intermediate premium position, which is commercially useful, but it must be made more explicit in content if the goal is to control the model’s categorization.
Conclusion
ACFC’s current position is best described as authoritative but not fully optimized. The brand is already visible in the right kind of queries: authentic distribution, branded apparel, premium retail, and shopping guidance. The evidence from 23% share of voice, 78 visibility, and 3,982 LLM referrals indicates that the brand is participating meaningfully in AI-mediated discovery. However, the same dataset shows that competitors still out-pace ACFC in several high-value clusters where specificity matters more than general prestige.
The strategic response should be narrow and content-led. The source data points to three priorities: enrich sustainability and product-history content, deepen technical category pages for sports footwear and luxury goods, and resolve mobile checkout friction so that neutral and negative cues do not undercut authority. In other words, ACFC does not need to rebuild its brand; it needs to make its existing strength easier for models to recognize, classify, and recommend.
Explore SpyderBot to operationalize these GEO analytics insights.