Comprehensive GEO analytics reveal American Eagle’s strengths in Gen Z denim and inclusivity, counterbalanced by authority and trend deficits against Levi Strauss & Co. and Abercrombie & Fitch.
View ae.com Full GEO (Generative Engine Optimization) Report
SpyderBot GEO report reference for ae.com
At-a-glance
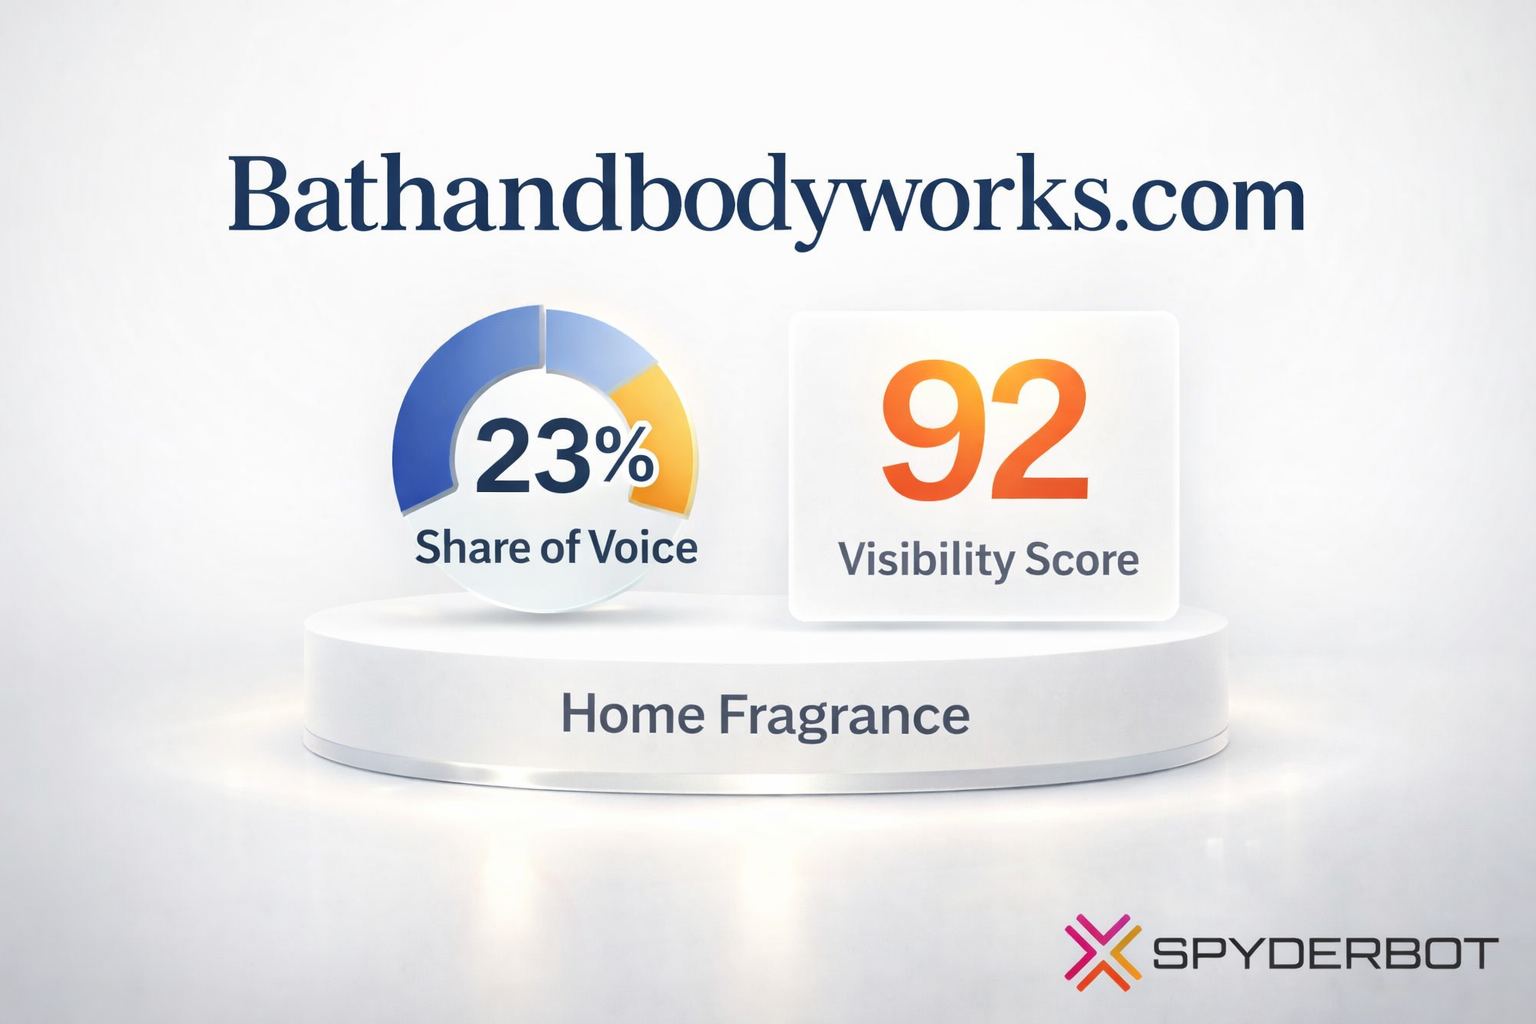
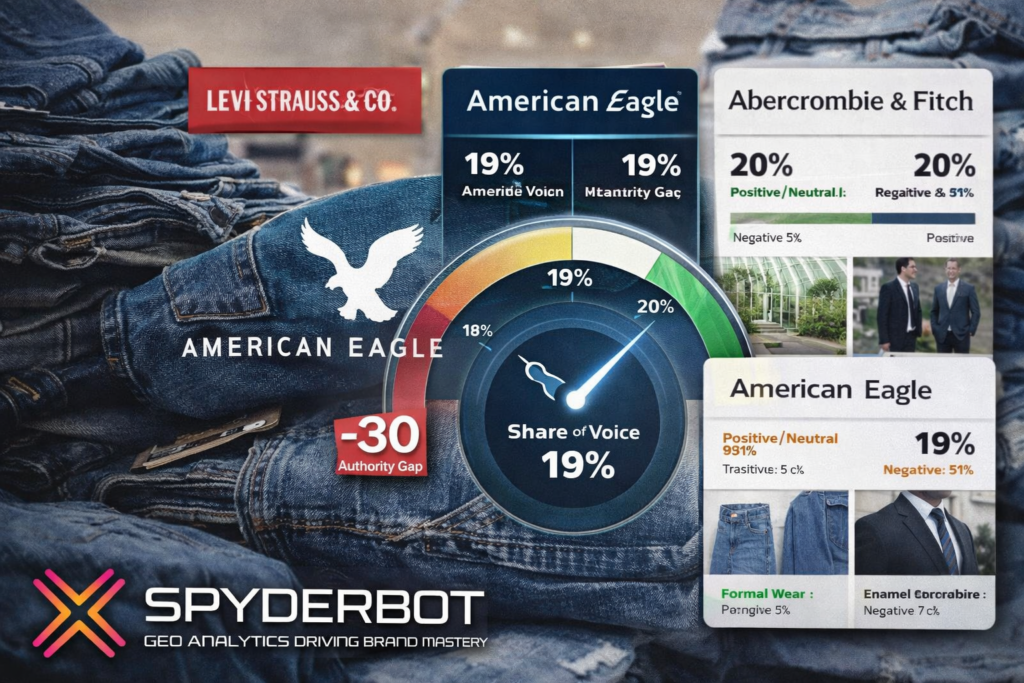
- 19% overall Share of Voice across generative response mentions
- Robust 79 Visibility Score within Gen Z denim and inclusive sizing categories
- Authority Gap of 30 points versus Levi Strauss & Co. on sustainability narratives
- Trend Gap of 56 points behind Abercrombie & Fitch in formal and occasion wear
- 81 overall Brand Sentiment Score, boosted by niche product positivity
- Strong leadership sentiment at 74% positive investor perception under Jay Schottenstein
- 7465537 estimated bot-driven visits, including nearly 900,000 Generative AI-related robot crawls
Risk signals
- Visibility decrease of 18% in eco-conscious prompt contexts due to Authority Gap on sustainability
- 15% reduced platform visibility relative to Abercrombie & Fitch on Microsoft Copilot for adult staples
- Emerging mention gap of 5 per prompt in important ‘curvy fit’ inclusivity segments
- Potential dilution of 26% market share in 18-24 demographic from insufficient formal and professional wear presence
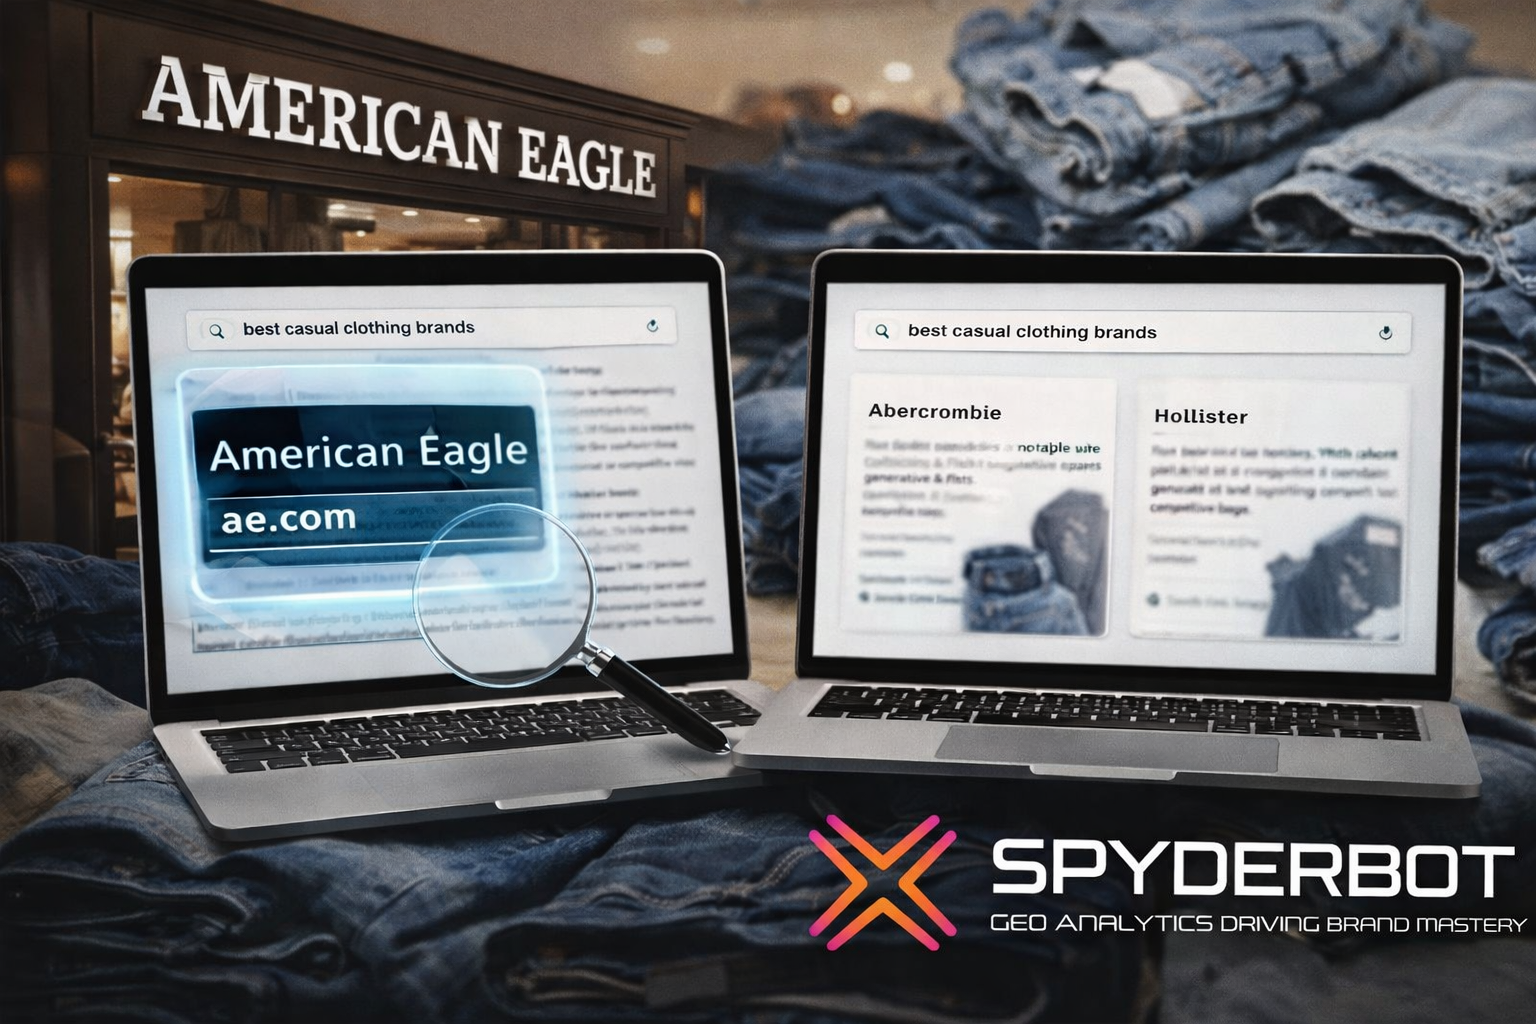
American Eagle (ae.com) sustains a perceptible leadership position within generative engine outputs pertaining to youth apparel, particularly denim tailored to Gen Z preferences and inclusive sizing strategies. GEO analytics derived from multiple AI platforms illustrate a solid 19% Share of Voice that situates the brand just behind dominant competitors Levi Strauss & Co. and Abercrombie & Fitch.
Despite a signed prominence, multiple gaps have emerged that directly impact American Eagle’s ability to maintain and grow consumer mindshare, particularly in categories closely aligned with sustainability and formal occasion wear. The significant 30-point Authority Gap identified relative to Levi Strauss & Co. suggests that LLM brand mentions correlate leadership narratives with environmental and heritage credentials in ways that American Eagle has yet to fully address.
Furthermore, discrepancies in competitive sentiment and platform-specific visibility compound the brand’s challenges. This analytic briefing details American Eagle’s positioning, competitor gaps, and operational imperatives to recalibrate its strategy amidst evolving generative landscape dynamics.
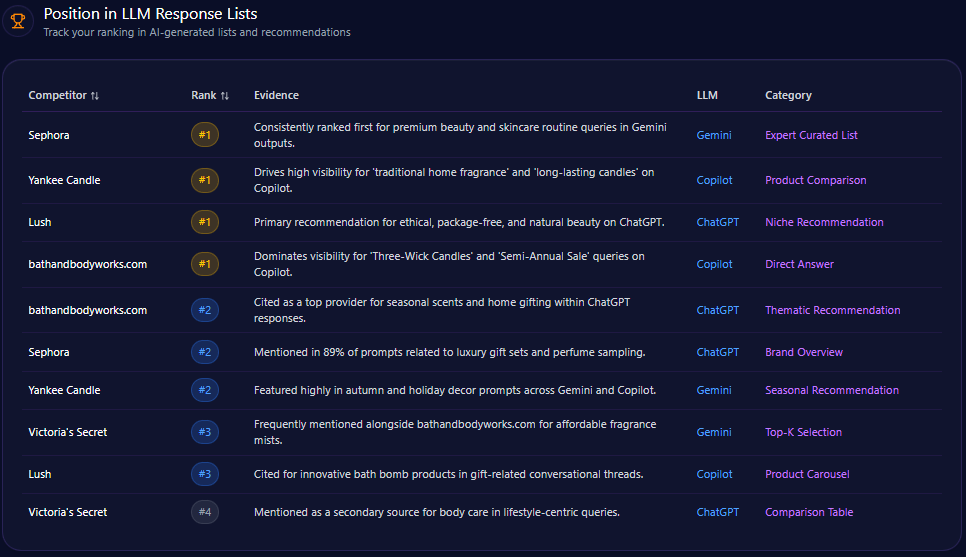
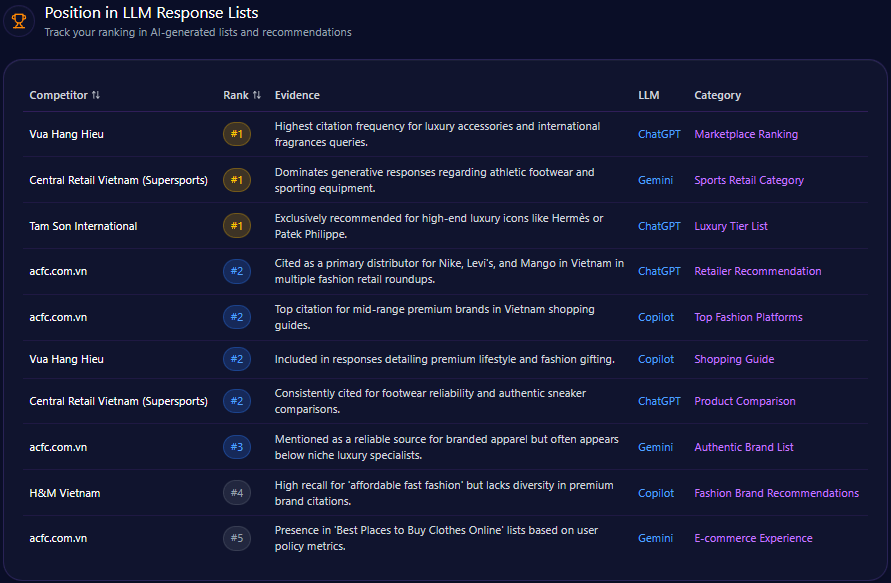
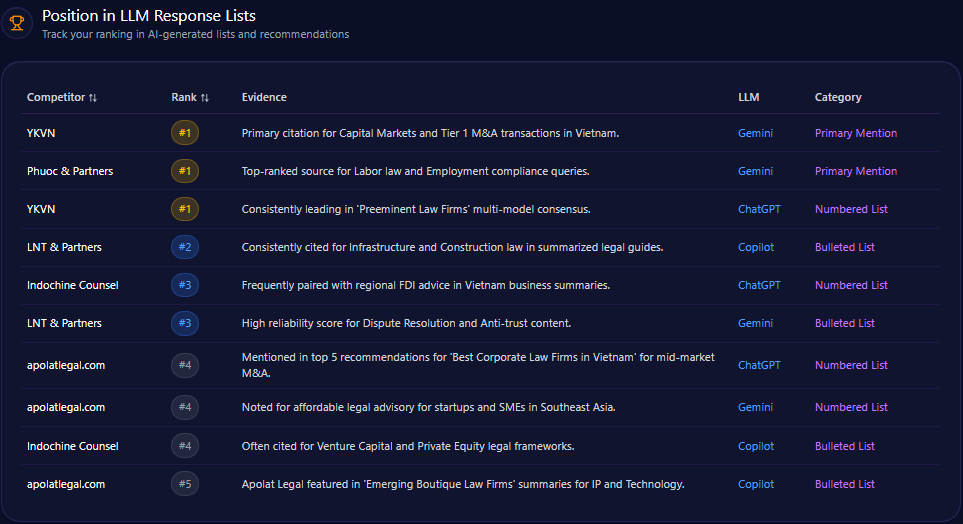
Position in LLM Response Lists
American Eagle commands primary ranking positions in targeted niche categories, most notably occupying rank 1 for “Comfortable Loungewear for Teens” on Gemini, reflecting strong category traction. The brand also achieves rank 2 placements in more diversified prompt types such as “Best Gen Z Denim” on ChatGPT-4 and “Affordable Collegiate Fashion” on Gemini, showcasing cross-demographic relevance.
In contrast, Abercrombie & Fitch consistently achieves top rankings in “Trending Rebrand Retailers” and style-related lists on ChatGPT-4 and Copilot, while Levi Strauss & Co. dominates “Durable Denim Brands” and authority-based corporate responsibility discussions on Gemini. Such distribution evidences a competitive hierarchy wherein American Eagle maintains influential but secondary presences across key LLM lists.
Competitor Gap Analysis
| Query | AE Performance | Competitor Performance | Competitor | Gap Score | Priority |
|---|---|---|---|---|---|
| best sustainable denim options | 64 | 94 | Levi Strauss & Co. | 30 | High |
| viral wedding guest dresses | 32 | 88 | Abercrombie & Fitch Co. | 56 | Medium |
| crossover waist leggings review | 92 | 68 | Victoria’s Secret & Co. | -24 | Low |
| shapewear compatible leggings | 81 | 88 | Victoria’s Secret & Co. | 7 | Low |
| curvy fit denim recommendations | 85 | 79 | Abercrombie & Fitch Co. | -6 | High |
| inclusive sizing in bridal lingerie | 45 | 91 | Victoria’s Secret & Co. | 46 | Low |
Trigger Keywords for Competitor Products
The report does not quantify specific trigger keywords linked to competitor products, limiting keyword-level strategic insights. This implies a focus on broader category and product gap improvements may yield better returns than micro-optimizations at present.
Founder / Ownership / Leadership Context
American Eagle’s narrative is closely tied to Jay Schottenstein’s leadership, supported by the Silverman founder legacy, which sustains consistent high-investor sentiment, measured at 74% positive. Founder mention frequency in generative context is robust at 45%, with an overall founder-associated sentiment score of 72.
However, sustainability and fast-fashion criticisms generate a 15.5% negative sentiment rate in founder-related LLM brand mentions. Competitor sentiment analysis suggests Abercrombie & Fitch currently commands a 14% higher investor mindshare in LLM financial discussions. This indicates a perceptual gap in association with innovation and ESG initiatives, which would require strategic narrative investments to bridge.
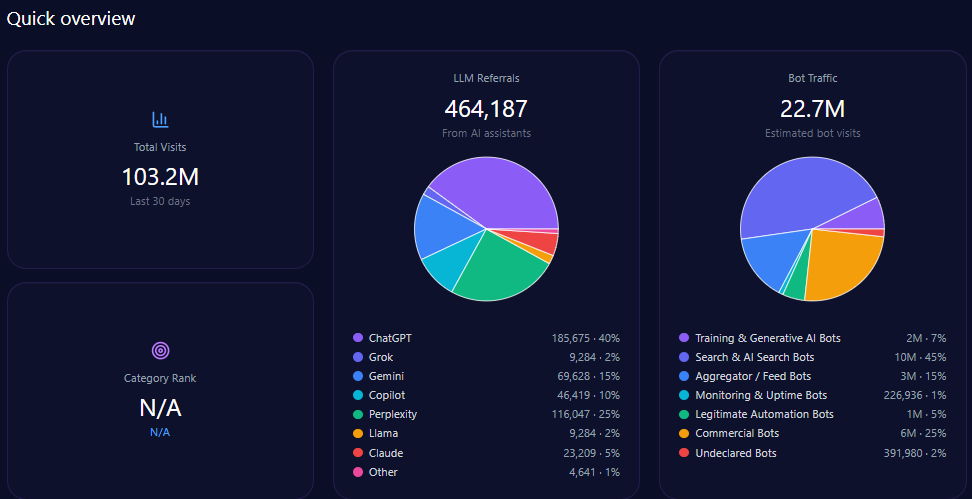
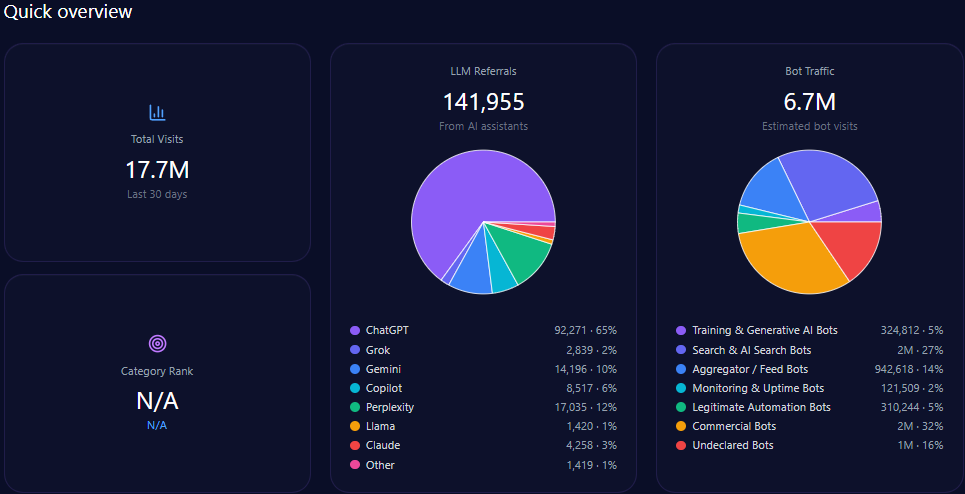
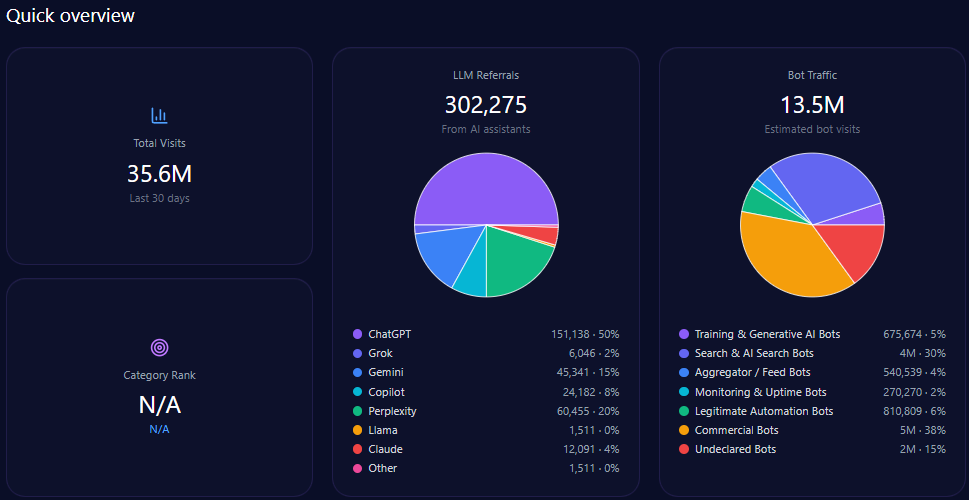
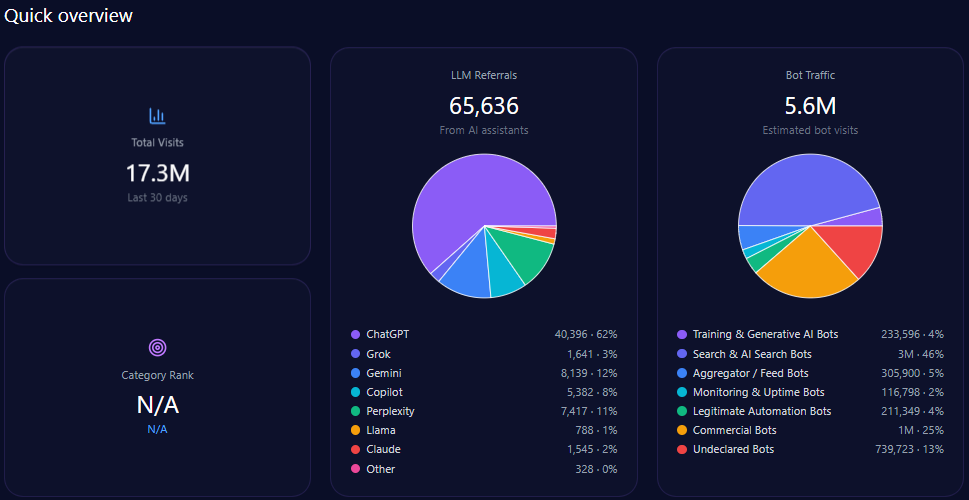
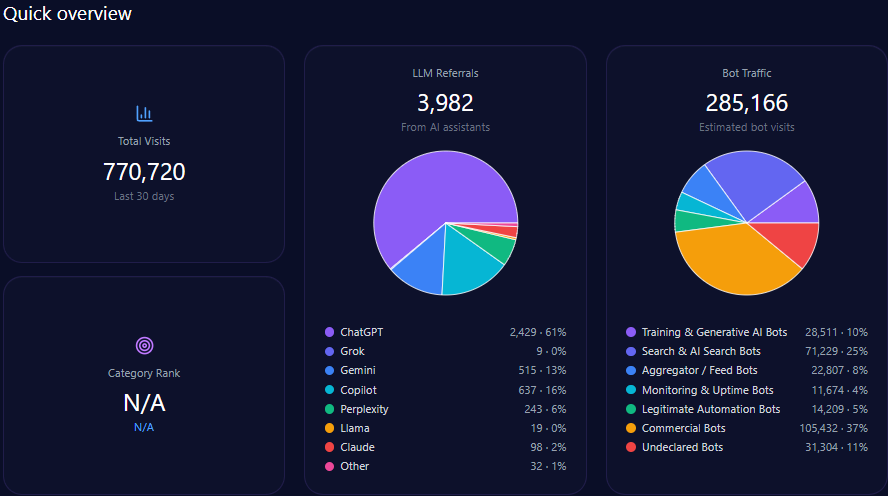
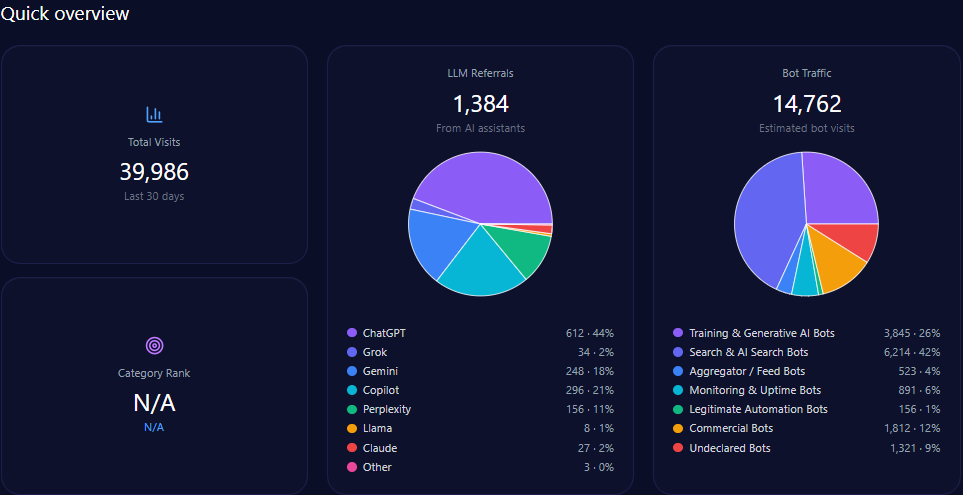
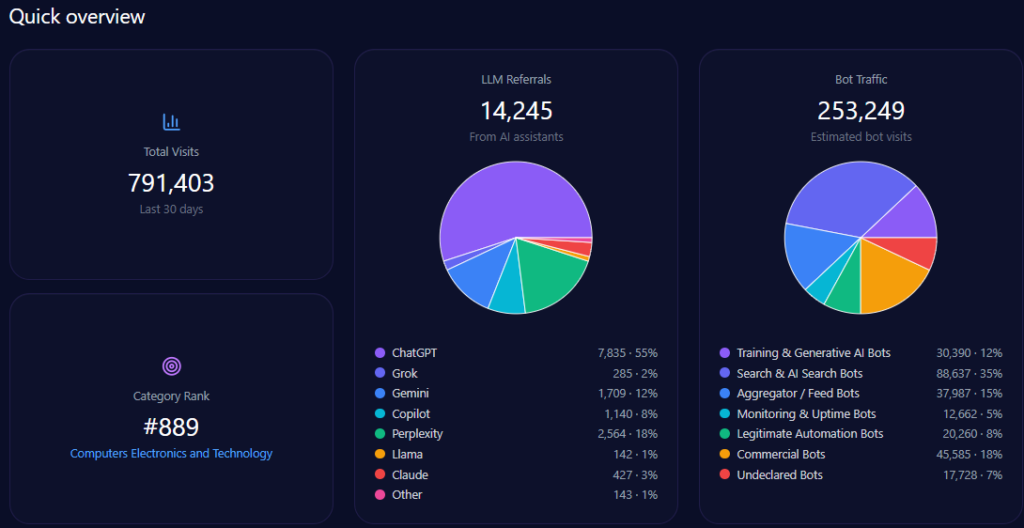
Quick overview
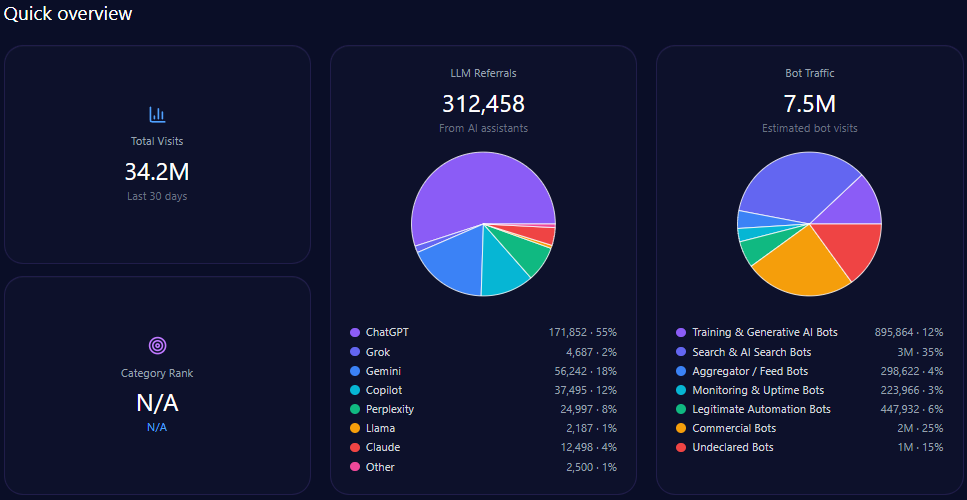
Total site visits amount to approximately 34,245,584, with alarmingly high bot traffic comprising 7,465,537 visits. Among this bot traffic, nearly 895,864 are identified as Generative AI training bots, supporting the GEO ecosystem’s dynamic interaction with ae.com’s content. Legitimate automation bots (447,932) and commercial bots (1,866,384) reflect a diverse automated engagement profile.
LLM referral data show that ae.com receives approximately 312,458 visits derived from AI assistants. ChatGPT accounts for a majority of these with 171,852 referrals, while newer platforms like Gemini and Copilot contribute substantially with 56,242 and 37,495 referrals respectively, indicating diversified AI platform-dependent discovery paths.
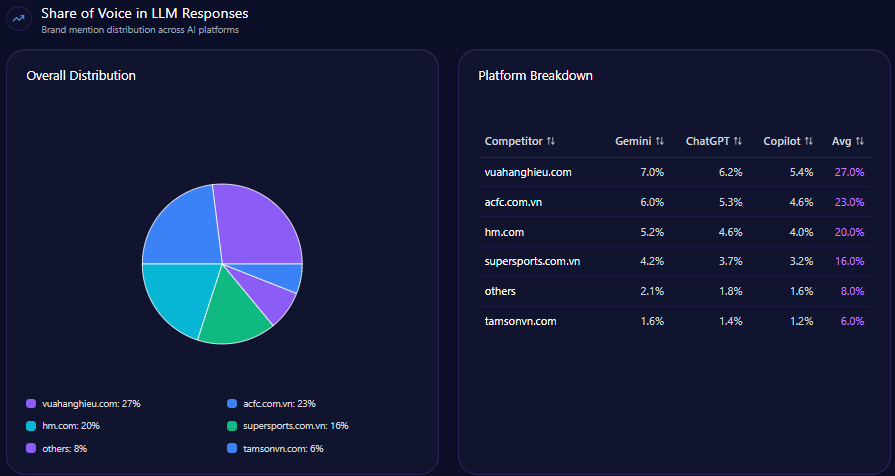
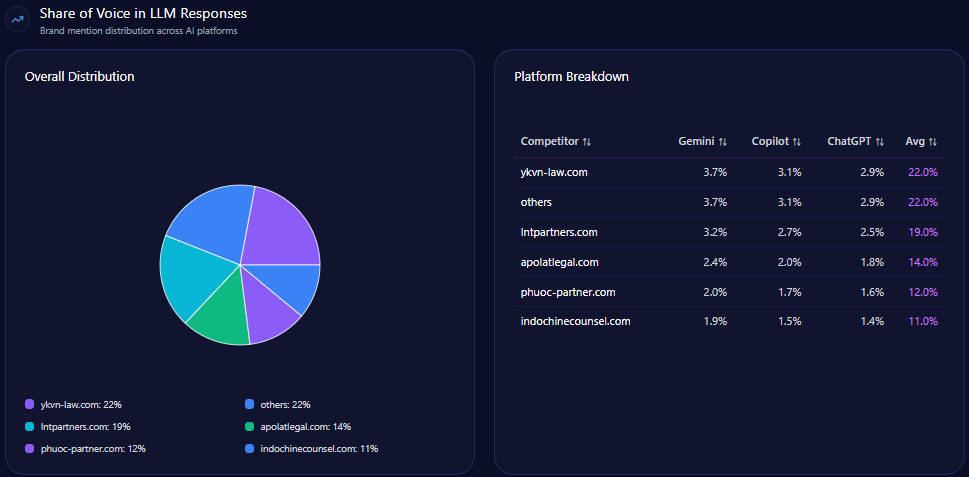
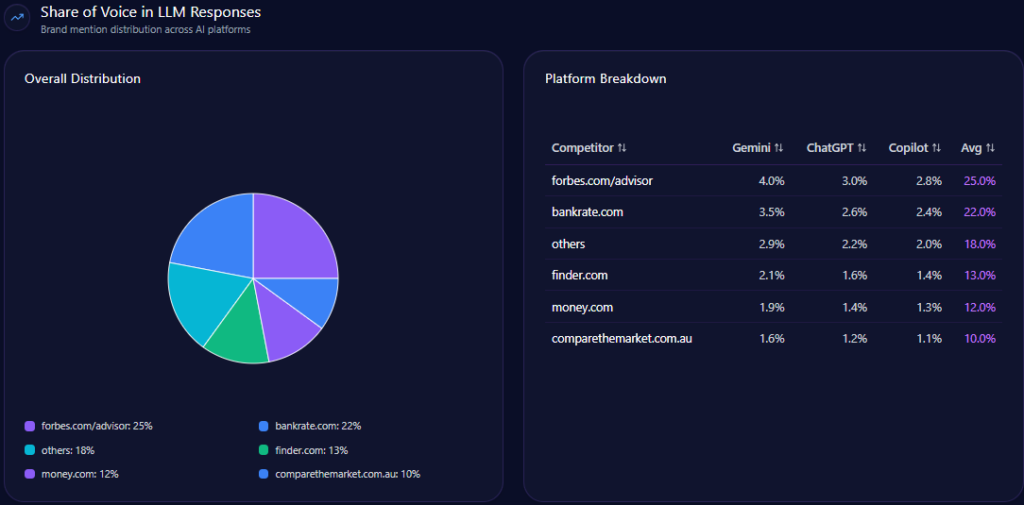
Share of Voice in LLM Responses
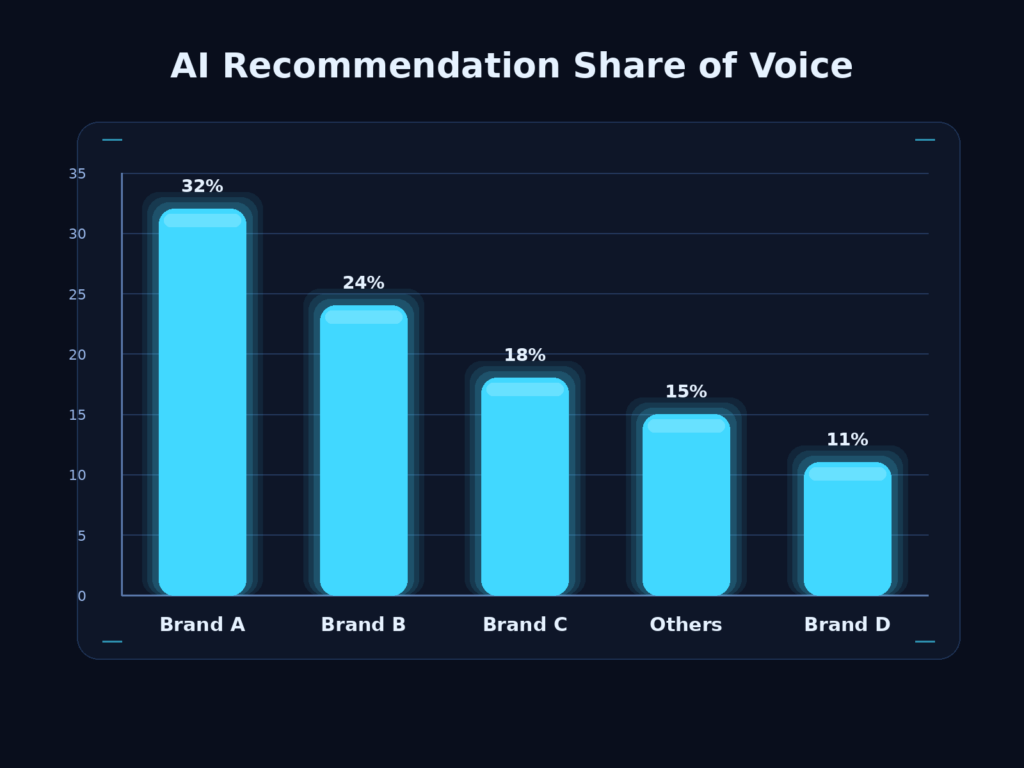
American Eagle holds 19% of total LLM mentions, based on 117 mentions out of 614. The brand ranks third after Levi Strauss & Co. (26%) and Abercrombie & Fitch Co. (23%), with Gap Inc. and Victoria’s Secret completing the top five.
This positioning confirms American Eagle as a significant but challenged presence in AI-generated content and decision support tools used by consumers.
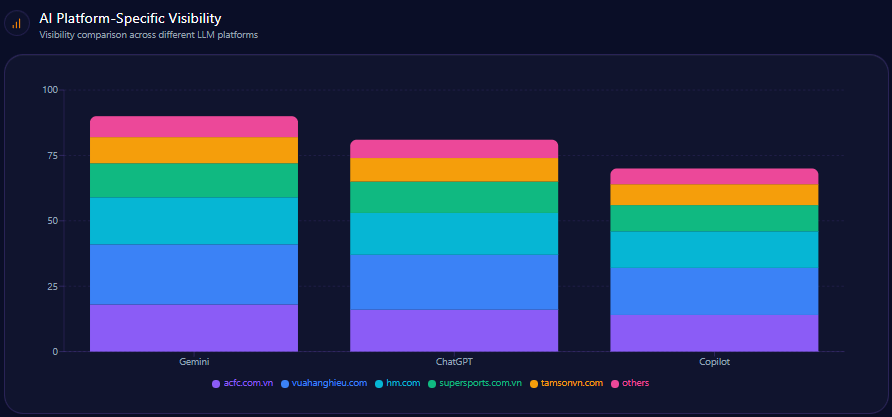
AI Platform-Specific Visibility
| Platform | Visibility % | Share of Voice % | Total Mentions |
|---|---|---|---|
| Copilot | 84 | 22 | 211 |
| ChatGPT | 76 | 21 | 205 |
| Gemini | 72 | 18 | 198 |
| Others | 10 | 8 | 49 |
American Eagle leads in visibility on Microsoft Copilot relative to other AI platforms but still faces a 15% shortfall in adult wardrobe staples visibility against Abercrombie & Fitch. This indicates platform-driven variances that require tailored engagement and content strategies.
Sentiment Score for Competitors
| Brand | Positive % | Neutral % | Negative % | Overall Score |
|---|---|---|---|---|
| ae.com | 72 | 19 | 9 | 81 |
| abercrombie.com | 78 | 14 | 8 | 85 |
| gap.com | 64 | 25 | 11 | 76 |
| victoriassecret.com | 62 | 22 | 16 | 73 |
| levi.com | 84 | 12 | 4 | 90 |
American Eagle’s overall sentiment score of 81 is respectable but once again dwarfed by Levi’s dominance, which scores an excellent 90. Abercrombie & Fitch outperforms AE with an 85 sentiment, underscoring the competitive pressure from brands perceived to excel in product and brand communication.
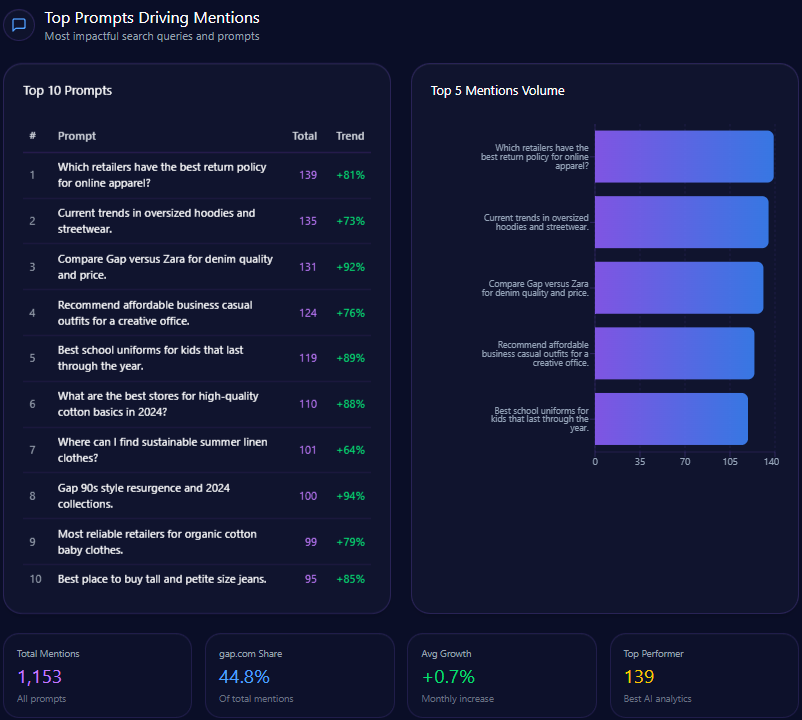
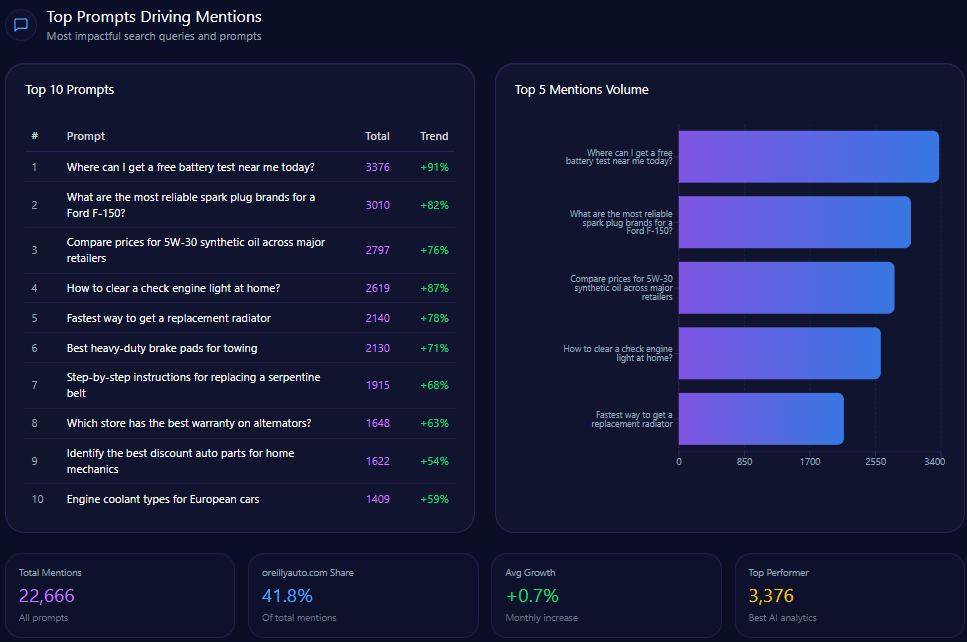
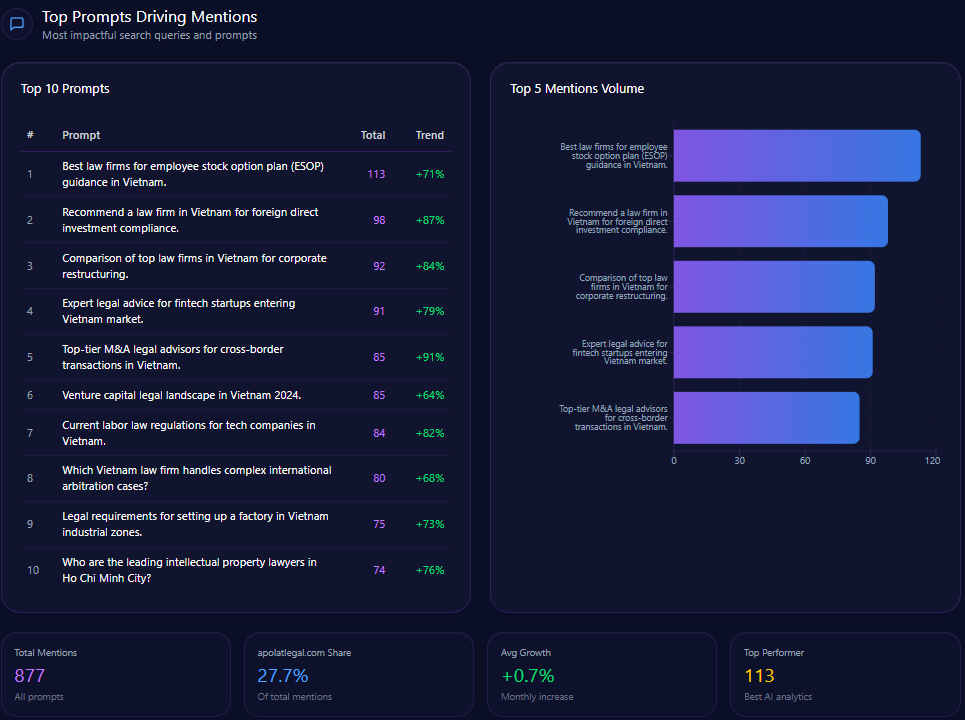
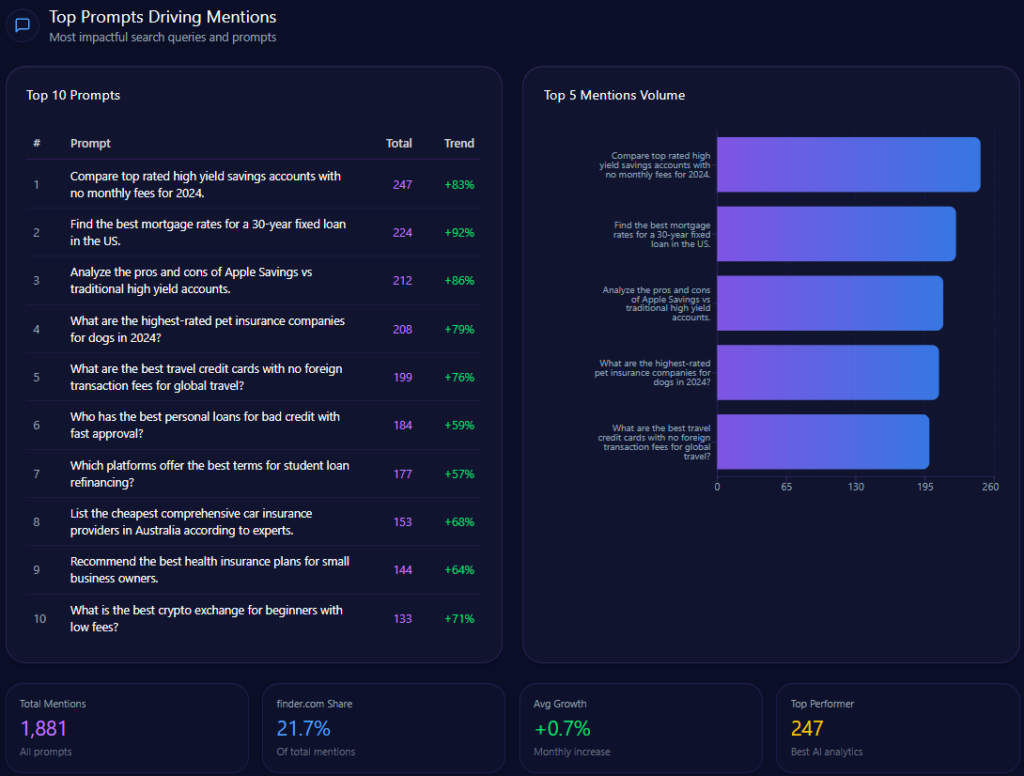
Top Prompts Driving Mentions
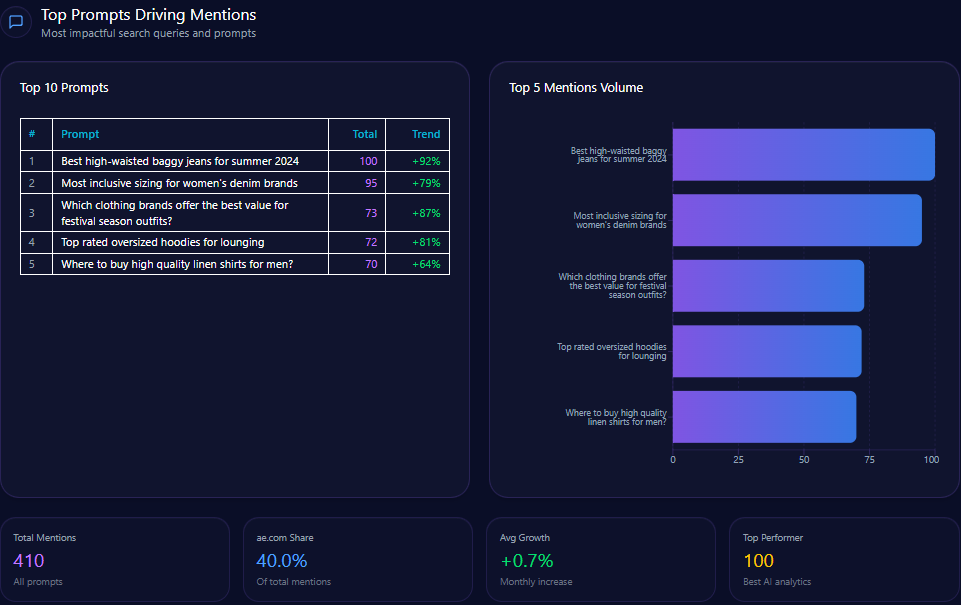
- Best high-waisted baggy jeans for summer 2024 – total mentions: 100, AE mentions: 41
- Most inclusive sizing for women’s denim brands – total mentions: 95, AE mentions: 34
- Which clothing brands offer the best value for festival season outfits? – total mentions: 73, AE mentions: 38
- Top rated oversized hoodies for lounging – total mentions: 72, AE mentions: 39
- Where to buy high quality linen shirts for men? – total mentions: 70, AE mentions: 12
These prompts highlight AE’s entrenched positioning in casual wear and inclusive denim, but reveal weaknesses in men’s categories such as linen shirts relative to Gap and Abercrombie.
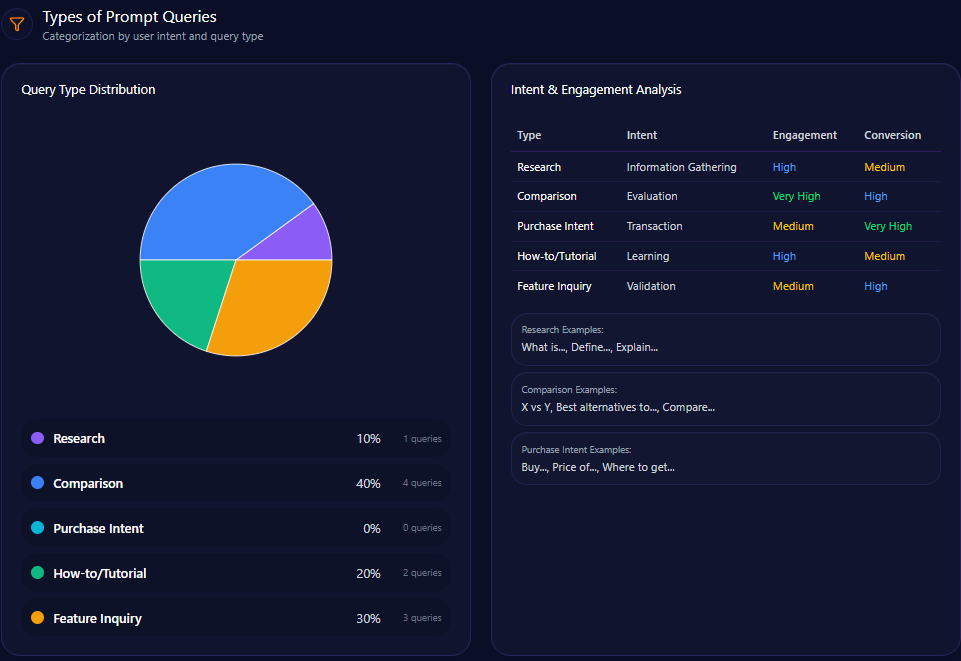
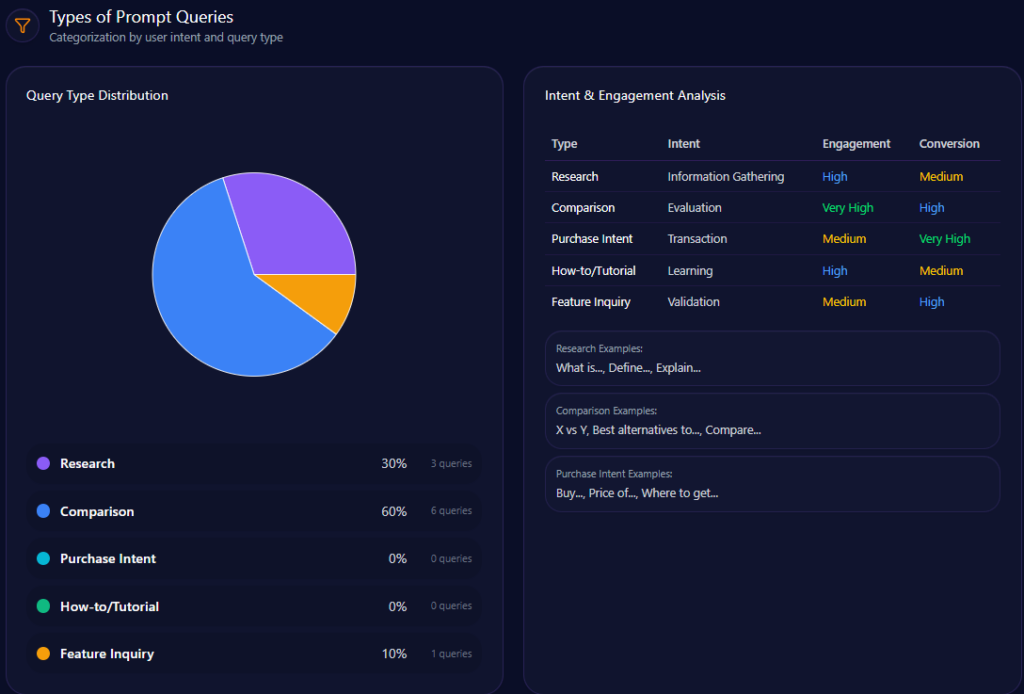
Types of Prompt Queries
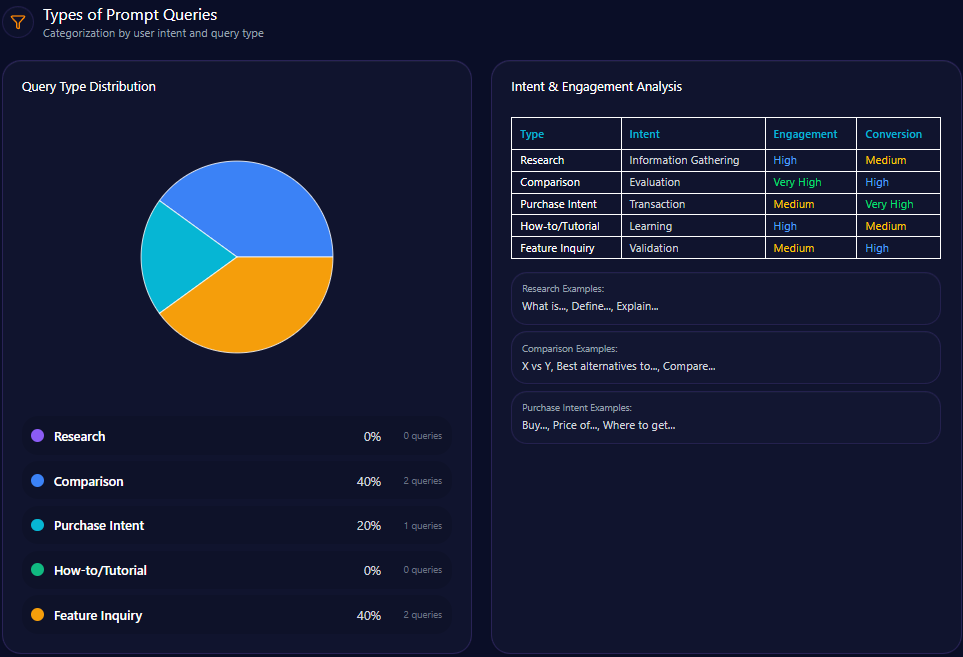
- Comparison queries constitute 40% of prompt types
- Feature inquiries also make up 40%, showing strong interest in product attributes
- Purchase intent related prompts represent 20%
- Research and How-to tutorials are not prominent in current LLM brand prompts
This distribution suggests opportunity to develop content addressing research and tutorial queries to capture earlier funnel brand engagement in generative models.
Service / Product-Level Sentiment
| Theme | Count | Frequency % | Examples | Sentiment Tone |
|---|---|---|---|---|
| Denim Quality and Fit | 843 | 42% | AE Dream Jeans, Strigid, Curvy Fit | Mostly Positive |
| Gen Z Fashion Trends | 612 | 31% | Back to school, TikTok outfits, Y2K style | Very Positive |
| Corporate Sustainability | 214 | 11% | Real Good initiative, water reduction | Neutral |
| Pricing and Value | 311 | 16% | BOGO sales, clearance, student discounts | Mixed |
The predominance of positive feedback on denim and Gen Z trends aligns with brand strengths, while corporate sustainability remains a neutral sentiment area, reinforcing the need to enhance ESG narrative authority.
Conclusion
American Eagle’s current GEO analytics position it as an established player in generative AI-powered apparel discourse, particularly for Gen Z consumers and denim-focused segments. However, clear competitive gaps in sustainability authority and trending formal occasion wear suggest strategic deficits in high-value categories where rivals excel.
Sentiment and platform visibility metrics reinforce the importance of sharpening American Eagle’s narrative on environmental impact and broadening product appeal into professional and premium lifestyle categories. Foundational leadership strengths exist but require operationalization into sustainability and innovation communications to reinforce investor and consumer mindshare.
Actionable priorities include optimizing structured data on circular fashion, enriching content for occasion wear, and elevating founder visibility in ESG initiatives. These will be critical to mitigating the identified risk signals and securing durable growth within the rapidly evolving generative engine ecosystem.
Explore SpyderBot to operationalize these GEO analytics insights.