An in-depth GEO analytics assessment of Agribank reveals dominant rural finance authority but highlights digital banking content gaps resulting in competitive pressures on AI-driven platforms.
SpyderBot GEO report reference for agribank.com.vn
At-a-glance
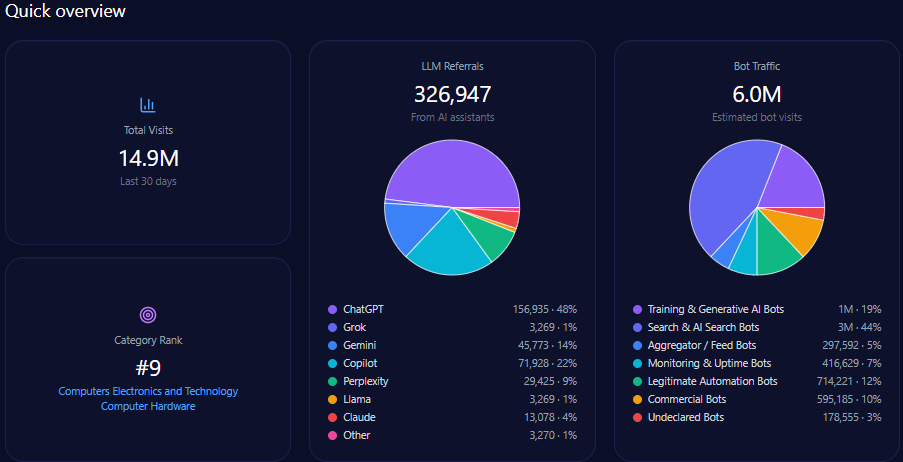
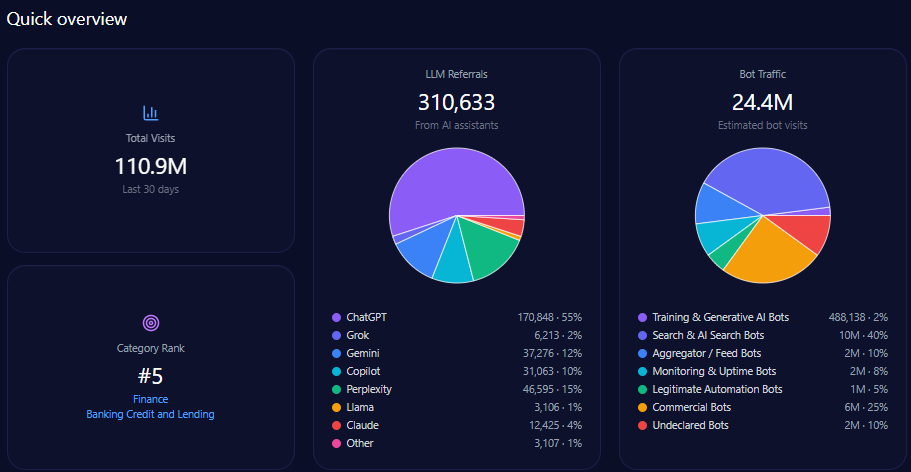
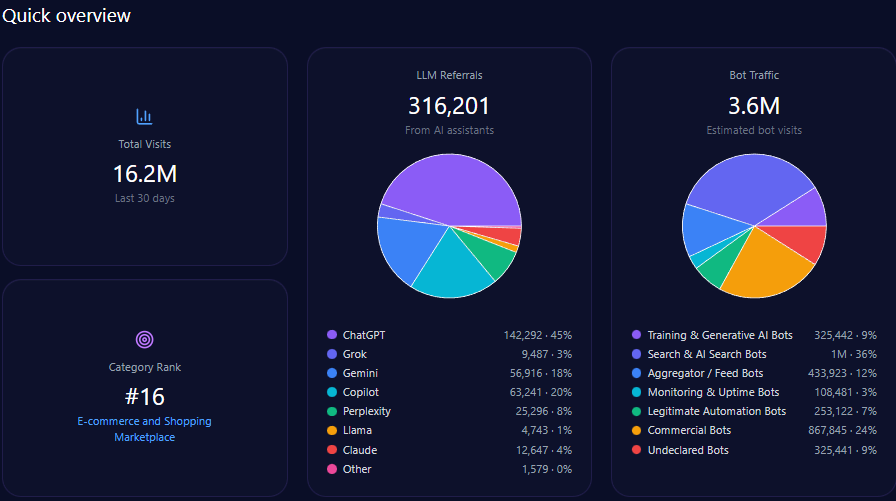
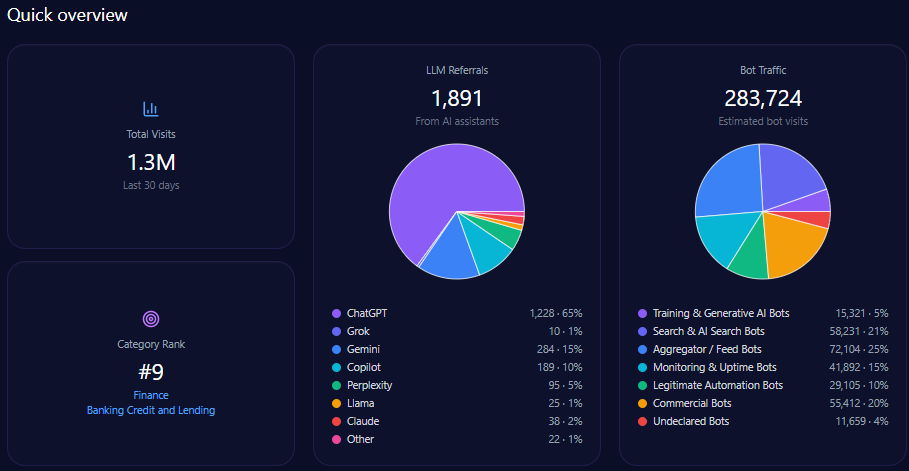
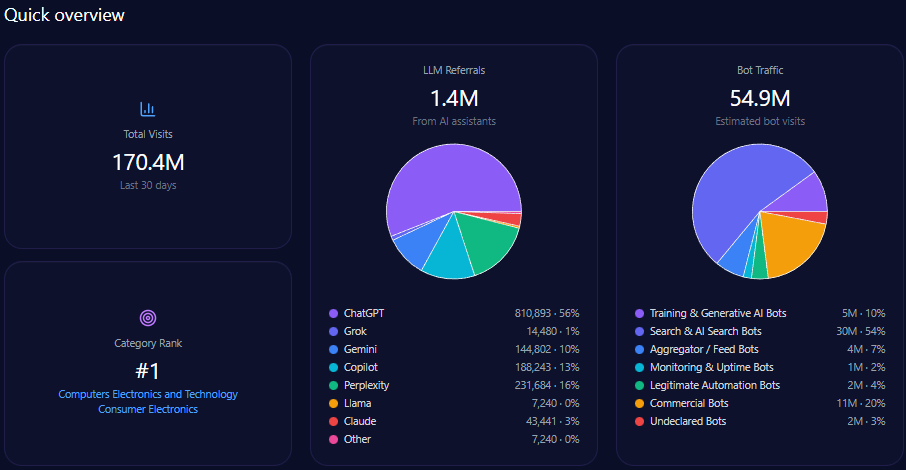
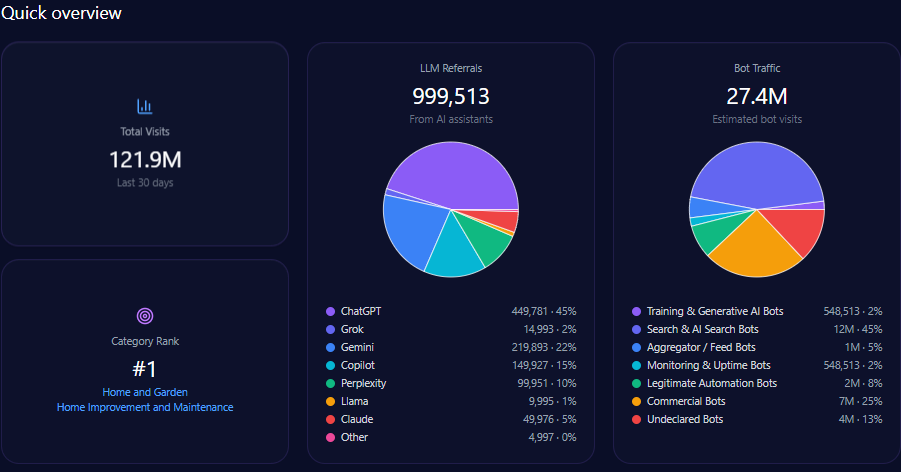
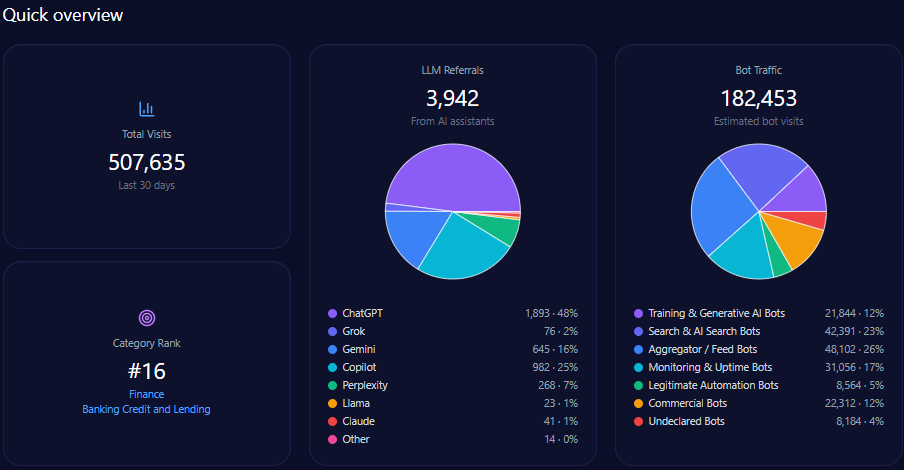
- 507,635 total visits with 182,453 from bot traffic including AI-driven and generative bots.
- 18% share of voice in LLM brand mentions across major generative engines.
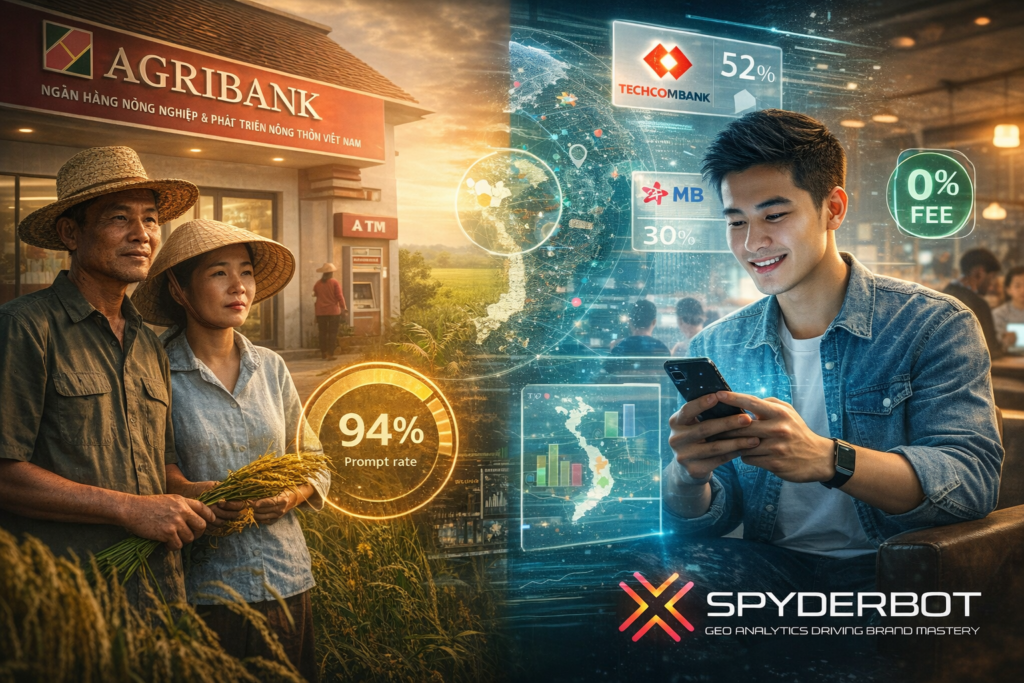
- 94% prompt coverage in agricultural and rural development queries, reflecting niche dominance.
- 30-point citation gap behind Techcombank in UI/UX digital banking references.
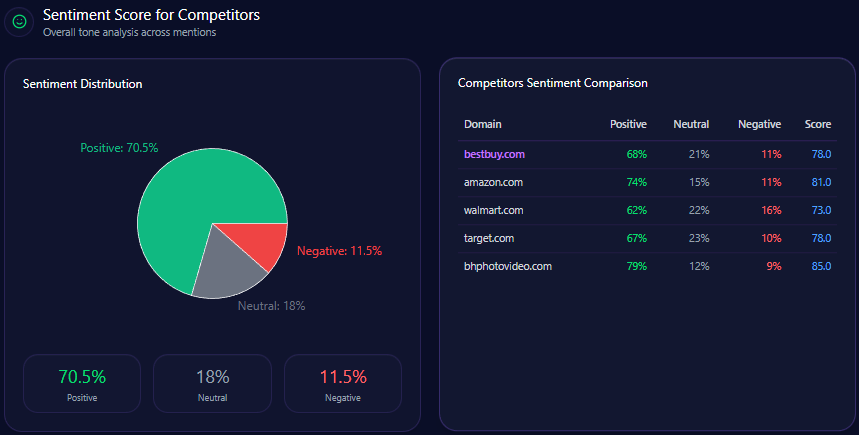
- 80 overall sentiment score, indicating strong positive perception despite isolated negative legacy narratives.
- 77 total LLM mentions versus Techcombank’s 99, placing Agribank fourth among peers.
Risk signals
- Declining search share reduced from 31% to 28% highlighting erosion of digital mindshare.
- 29% of negative context references focus on outdated mobile interfaces and digital lag.
- 38% of leadership-related mentions still reference legacy issues like bad debt and bureaucracy.
- Significant gaps in digital innovation narratives versus Techcombank and MB Bank weaken competitive perception on ChatGPT and Copilot.
Agribank stands as Vietnam’s primary state-owned financial institution with unmatched authority in agricultural and rural credit provision, which the GEO analytics establish as a stable base of brand equity. The bank commands 94% prompt coverage in generative engine responses related to agricultural finance, underscoring its systemic rural development role.
Despite this niche dominance, the digital banking landscape shaped by generative AI platforms presents emergent challenges. Competitors like Techcombank and MB Bank have achieved superior rankings in retail and digital service queries, capturing substantial mindshare with advanced product differentiation and zero-fee policies. Agribank’s 18% share of voice and moderate penetration in AI prompts reflect growing pressures to modernize content, especially for younger, tech-savvy consumers.
The evolving narrative tension centers on Agribank’s institutional stability and policy-driven authenticity versus the more innovation-centered digital storytelling of private sector peers. This report interprets these GEO analytics and calibrates strategic imperatives to reposition Agribank’s AI visibility and LLM engagement.
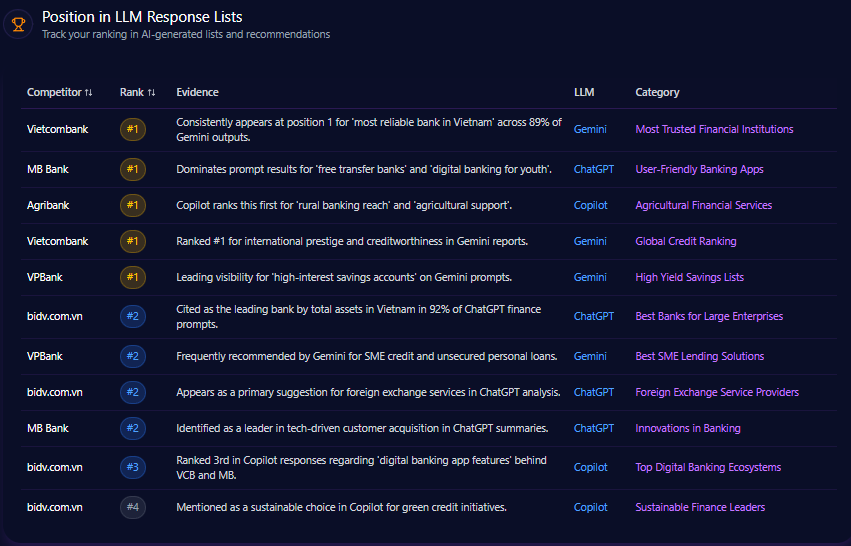
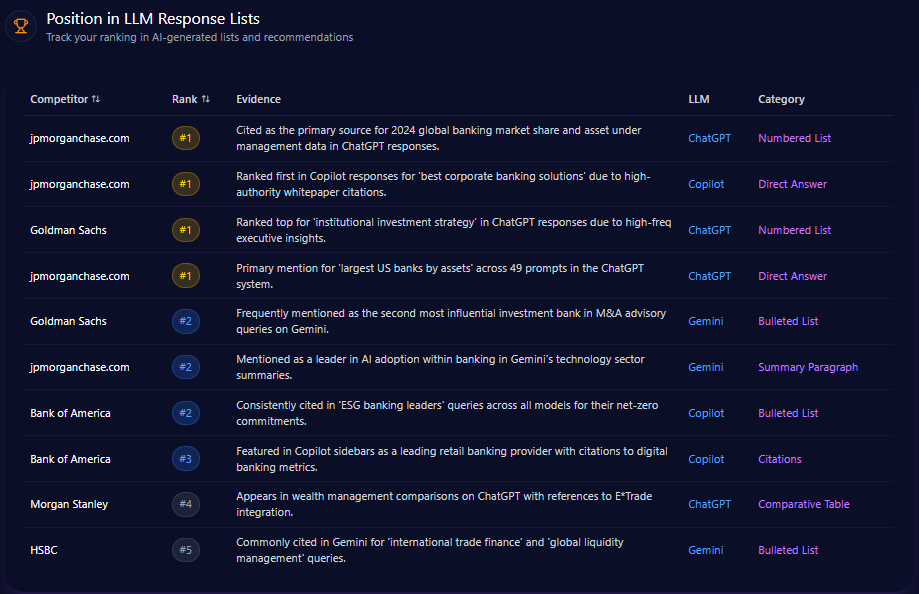
Position in LLM Response Lists
Agribank typically ranks in second or third place across major LLM response lists, solidly anchoring institutional credibility but trailing private competitors in digital experience categories. For example, ChatGPT ranks Agribank second for “primary state-owned bank for rural development” but Techcombank dominates as the #1 digital retail leader on Gemini and ChatGPT.
This consistent positioning suggests that Agribank has retained authoritative recognition within institutional and rural finance niches but lags across digital innovation and retail banking indexes which dominate consumer mindshare in generative responses.
Competitor Gap Analysis
| Query | Your Performance | Competitor | Competitor Performance | Gap | Opportunity | Priority |
|---|---|---|---|---|---|---|
| Best digital banking app in Vietnam | 64 | Techcombank | 94 | 30 | LLMs reward Techcombank for ‘zero-fee’ mentions and intuitive interface. | High |
| Credit cards with best cashback | 52 | VPBank | 96 | 44 | VPBank has higher niche card citations. | High |
| AI banking assistant Vietnam | 41 | Techcombank | 85 | 44 | Techcombank’s AI press releases enhance LLM presence. | High |
| Opening bank account online via eKYC | 67 | MB Bank | 95 | 28 | MB Bank top of mind for eKYC process. | High |
| Highest savings interest rates 2024 | 78 | VPBank | 89 | 11 | More frequent structured rate updates from VPBank. | Medium |
| Fastest business loan approval | 72 | MB Bank | 91 | 19 | MB Bank’s detailed loan workflows. | Medium |
| Foreigner friendly banking Vietnam | 58 | BIDV | 83 | 25 | BIDV cited more for bilingual support. | Medium |
Trigger Keywords for Competitor Products
Competitor focus on transactional language outpaces Agribank, with “purchase” and “buy” keywords linked to over 830 mentions across competitors named A and B, highlighting prioritization of retail ecommerce banking triggers. Agribank’s absence in this data suggests a need for targeted keyword alignment to increase AI-driven referral traffic in purchase-facilitating contexts.
Founder / Ownership / Leadership Context
Analysis of leadership-related mentions identifies Chairman Pham Duc An as a conservative figure with a neutral sentiment prevalence of 68% and low innovation attribution relative to private-sector counterparts. This leadership profile aligns with Agribank’s state-owned stability narrative but limits its e-narrative presence on transformative fintech themes.
Conversely, competitors like Techcombank and VPBank benefit from founder-led investment narratives and active capital deployment stories which dominate recent LLM brand mentions. Agribank’s investment mentions remain firmly state-driven, reinforcing institutional credibility but restricting association with innovation leadership.
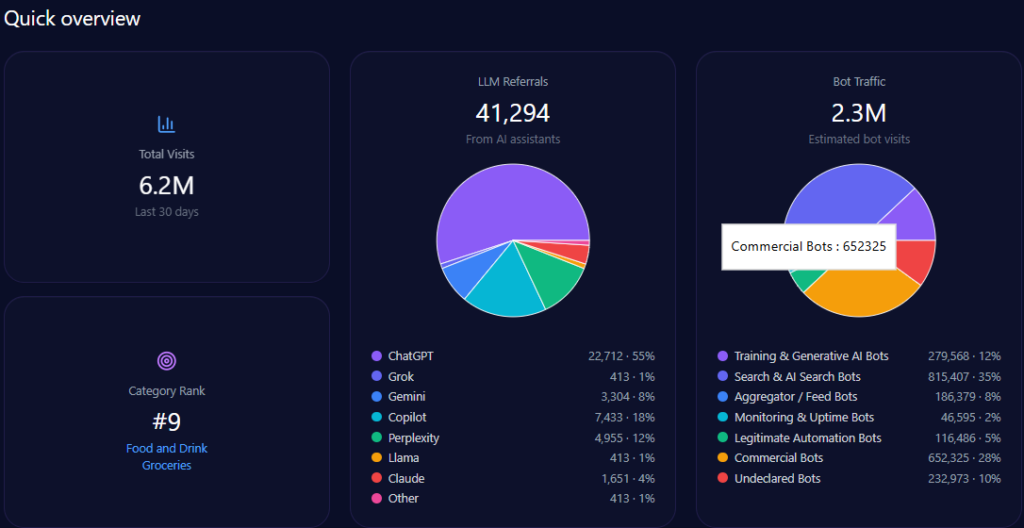
Agribank’s website traffic analysis shows 507,635 visits with a significant 182,453 visits from diverse bot traffic sources including training & generative AI bots and commercial bots. AI-driven referrals total 3,942 with ChatGPT responsible for nearly half of these at 1,893.
This bot engagement profile aligns with significant LLM referral visibility, but platform-specific data indicates underperformance on high-impact generative engines such as Copilot and ChatGPT relative to private challengers.
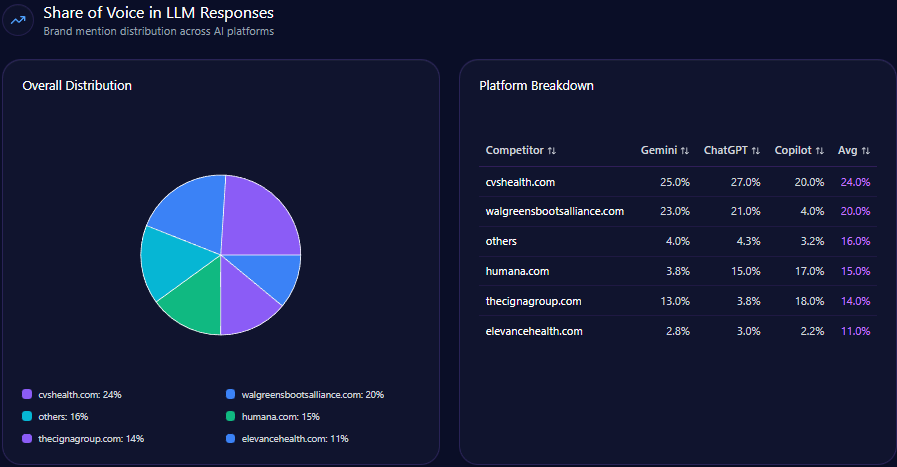
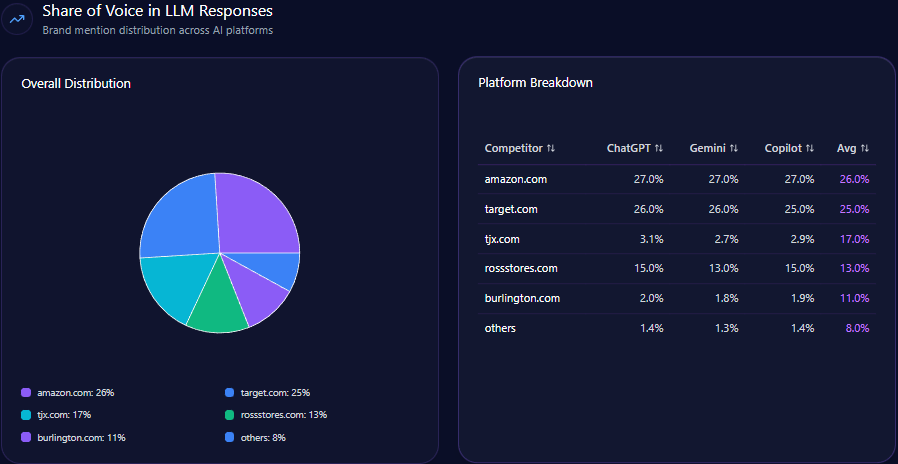
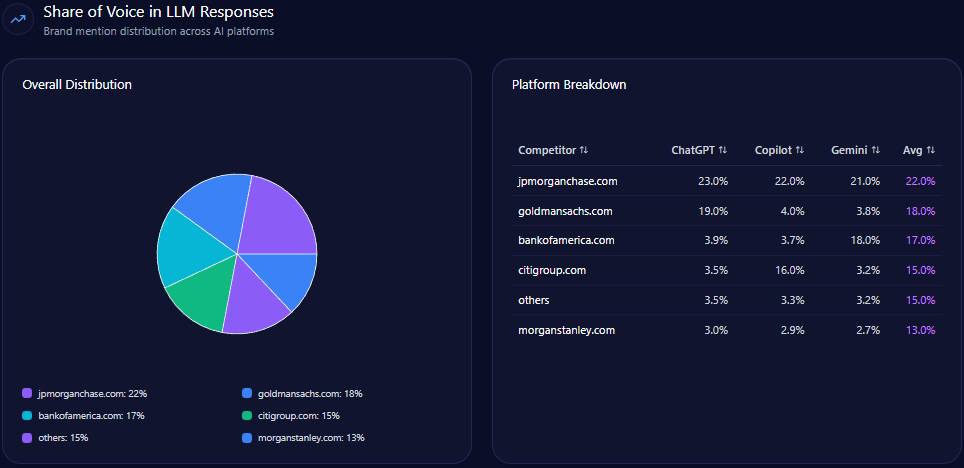
Share of Voice in LLM Responses
Agribank accounts for 18% of all LLM brand mentions, placing fourth behind Techcombank (23%), BIDV (20%), and MB Bank (19%). This share gap emphasizes the digital brand momentum gap and exposes risks to long-term AI-driven brand equity.
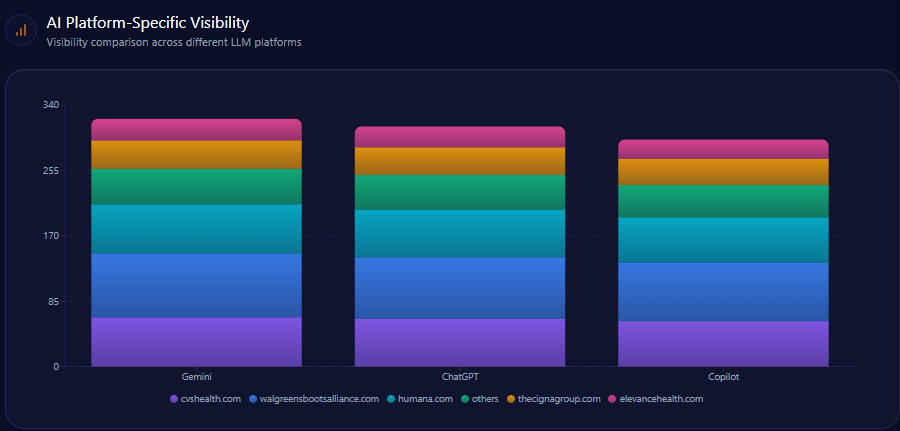
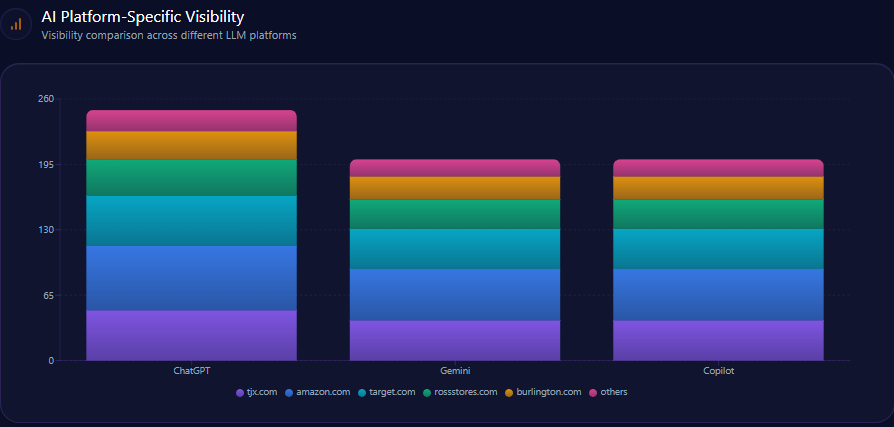
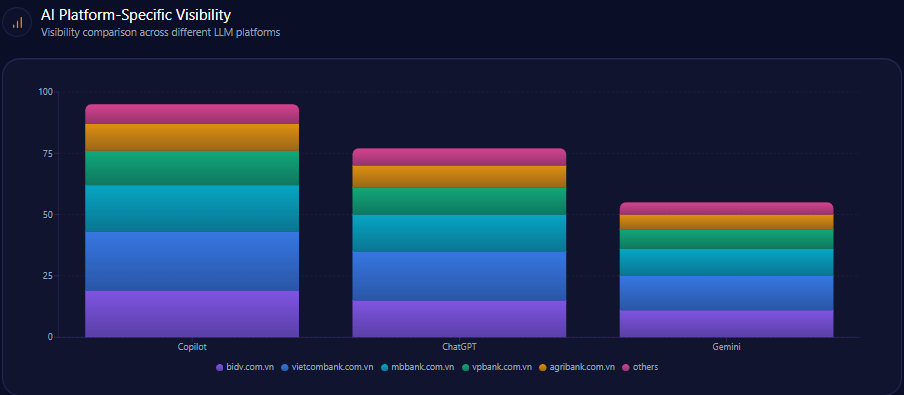
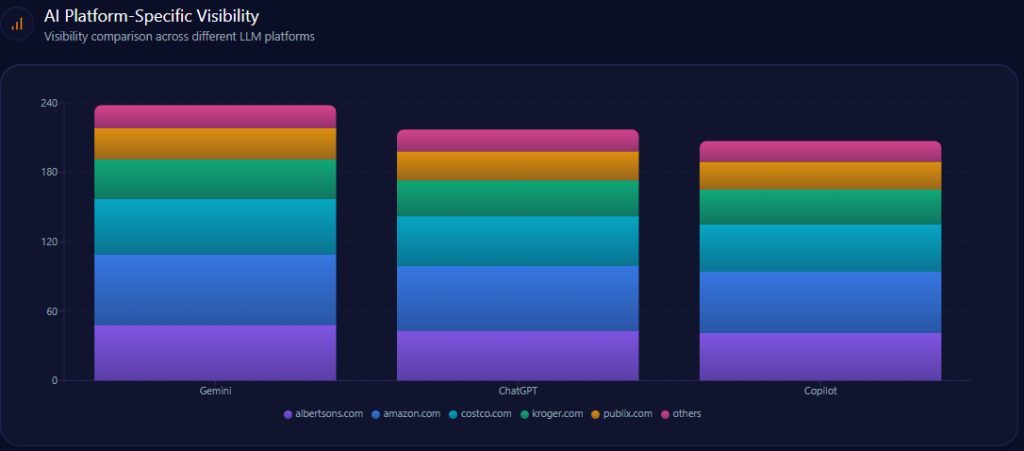
AI Platform-Specific Visibility
| Platform | Total Mentions | Agribank Share % | Top Competitors |
|---|---|---|---|
| Gemini | 139 | 23 | BIDV (25%), Techcombank (20%) |
| Copilot | 147 | 14 | MB Bank (24%), Techcombank (22%) |
| ChatGPT | 148 | 16 | Techcombank (26%), MB Bank (22%) |
Platform visibility data reveals Agribank leads only Gemini narrowly in stability but significantly trails in Copilot and ChatGPT, the latter two being critical for retail and innovation narrative acquisition.
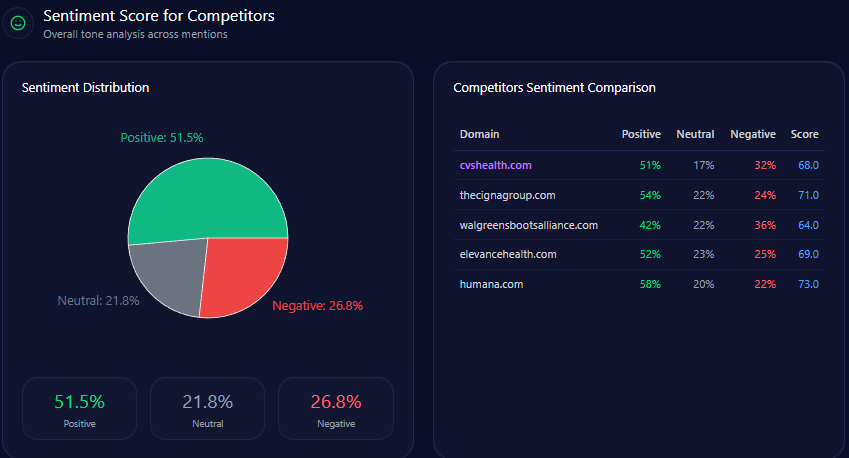
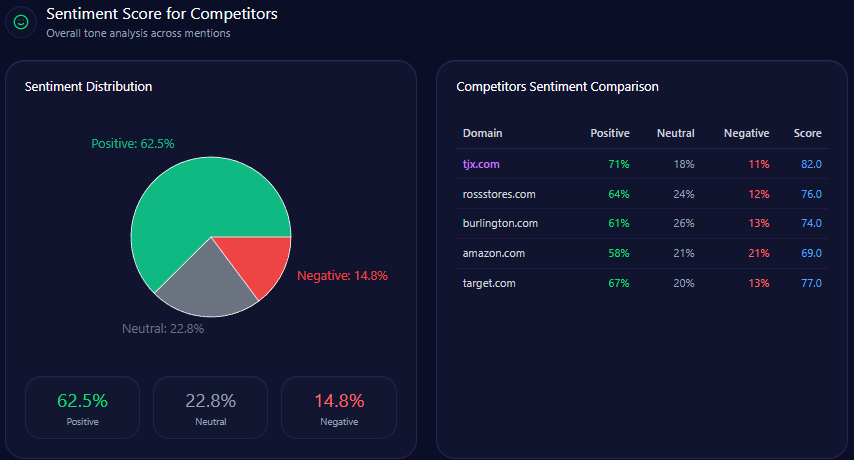
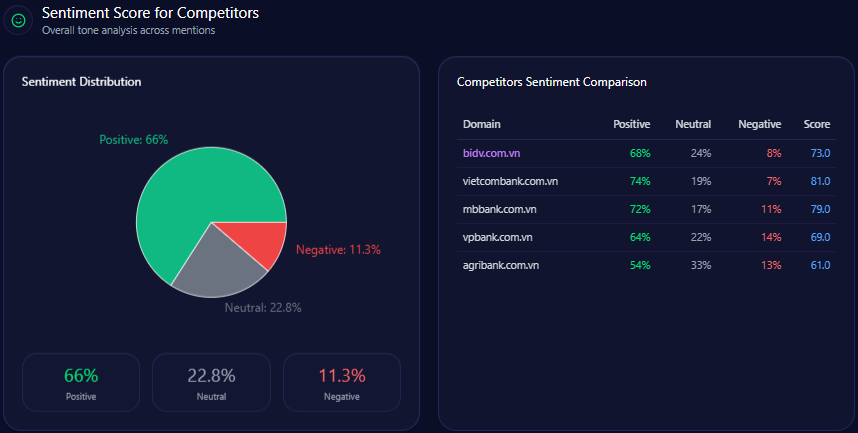
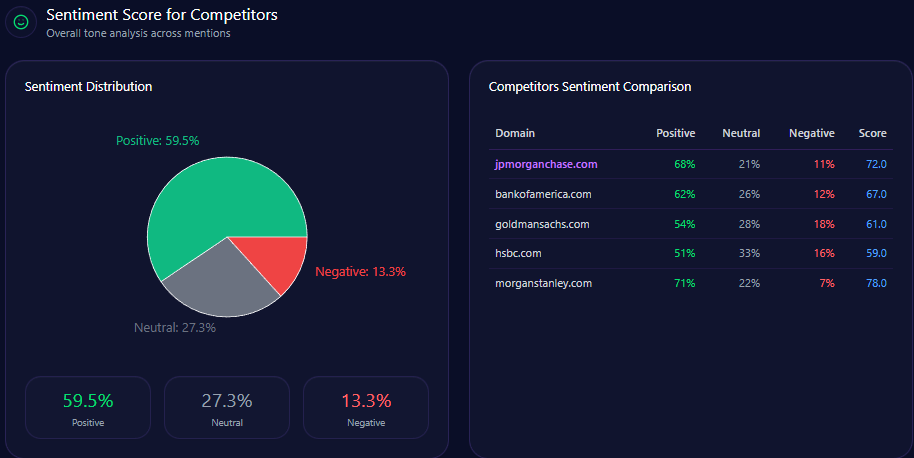
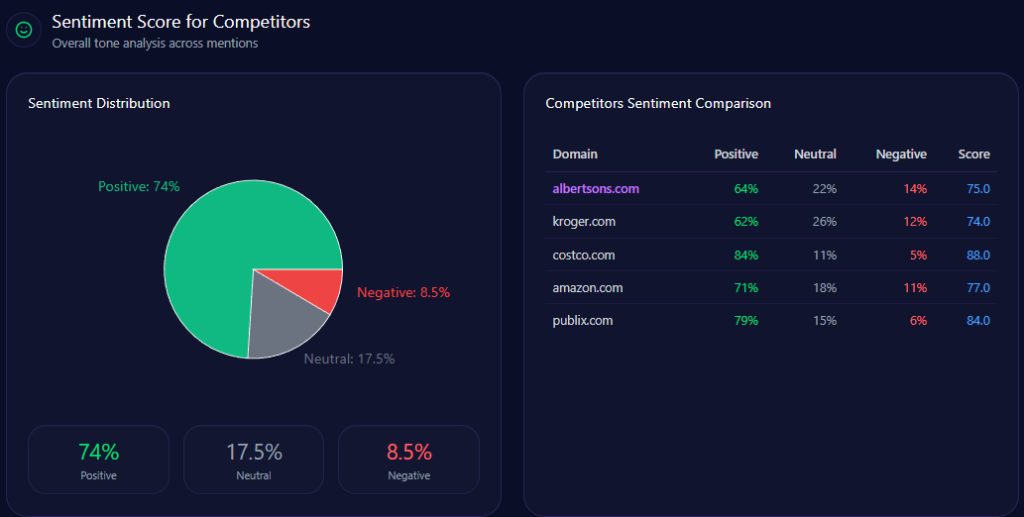
Sentiment Score for Competitors
| Brand | Positive % | Neutral % | Negative % | Overall Score |
|---|---|---|---|---|
| Agribank | 67 | 26 | 7 | 80 |
| BIDV | 73 | 21 | 6 | 84 |
| Techcombank | 79 | 16 | 5 | 87 |
| MB Bank | 83 | 13 | 4 | 90 |
| VPBank | 76 | 18 | 6 | 85 |
Agribank’s overall positive sentiment is consistent but lags behind Techcombank’s 87 and MB Bank’s 90, reflecting the challenge of overcoming legacy negative context and limited innovation attribution.
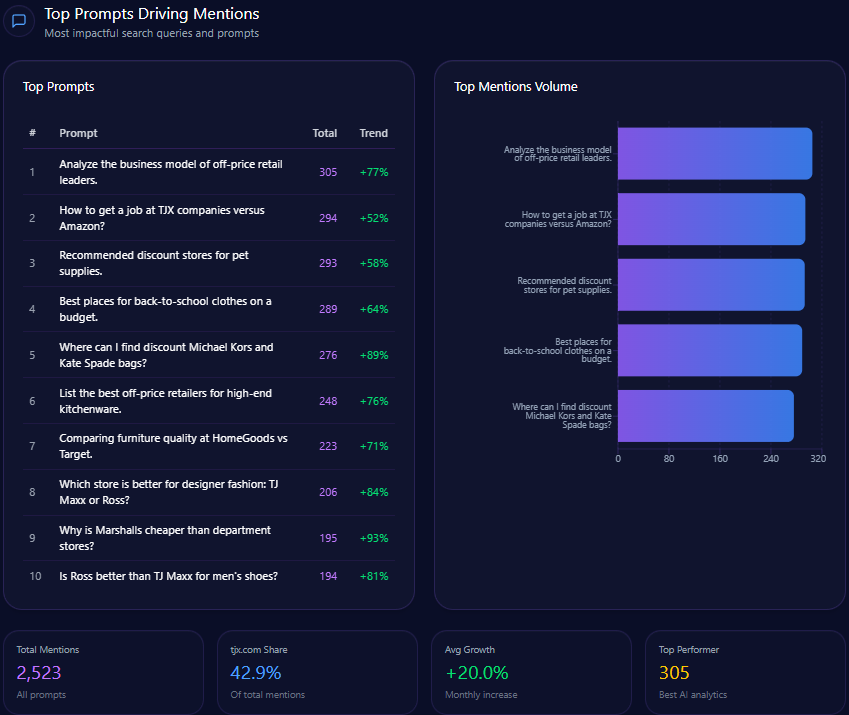
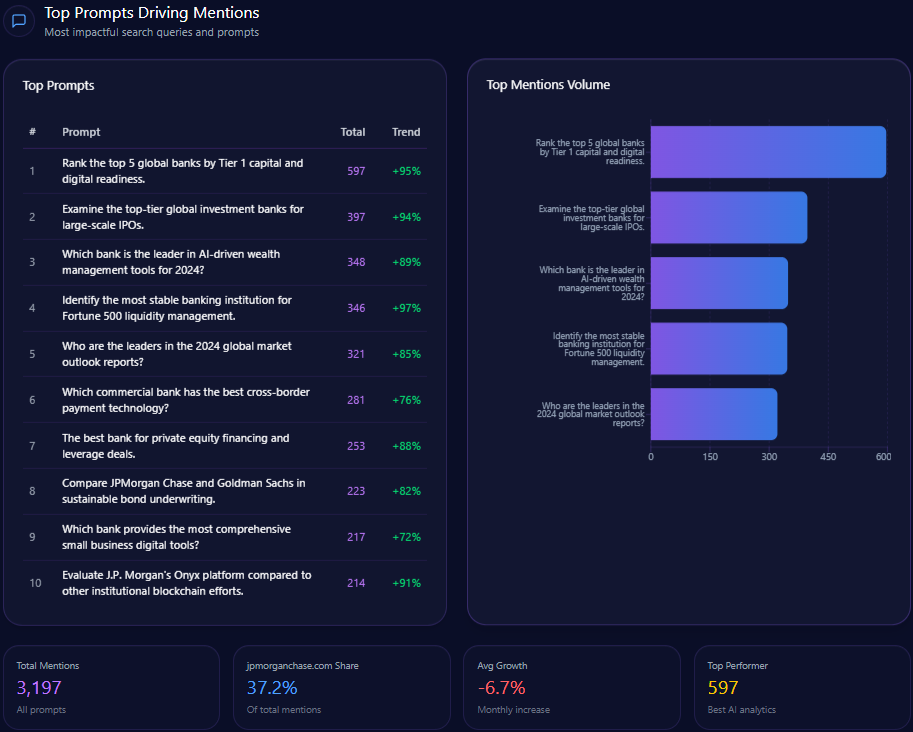
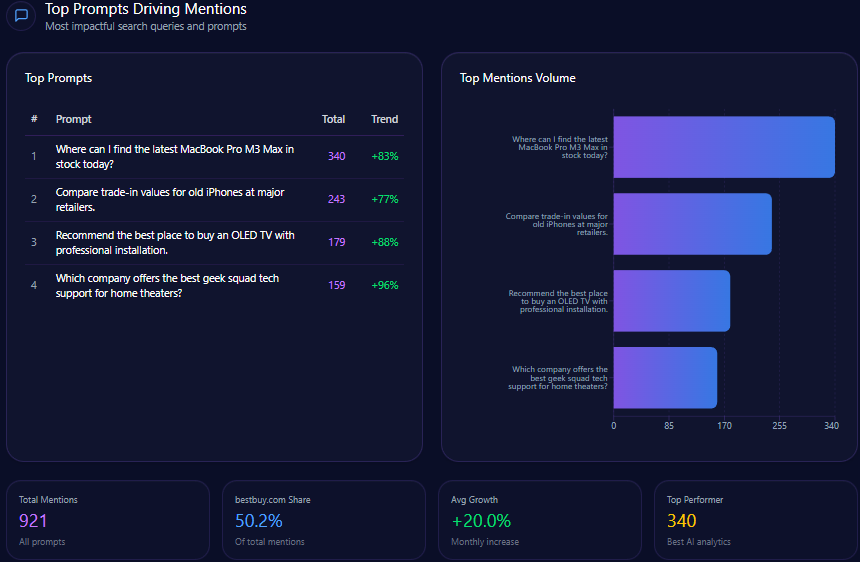
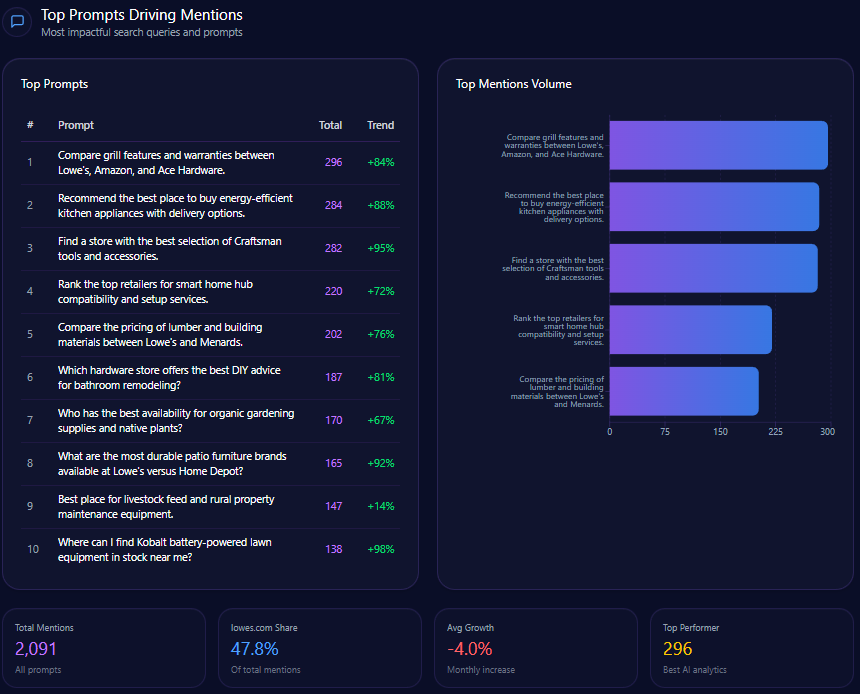
Top Prompts Driving Mentions
- 96 mentions: “What is the most reliable bank for rural businesses in Vietnam?” with Agribank dominating 74 mentions.
- 172 mentions: “How to open a 0-fee digital bank account” with only 12 mentions for Agribank vs. 160 for Techcombank and MB Bank combined.
- 138 mentions: “Easiest mobile app for international transfers” where Agribank accounts for 18.
- 122 mentions: “Best savings rates for retirees” split evenly with Agribank at 42.
- 92 mentions: “Compare home loan interest rates” with Agribank at 34.
The top prompt data corroborates Agribank’s strength in institutional and rural finance while exposing weaknesses in digital retail and modern consumer banking contexts.
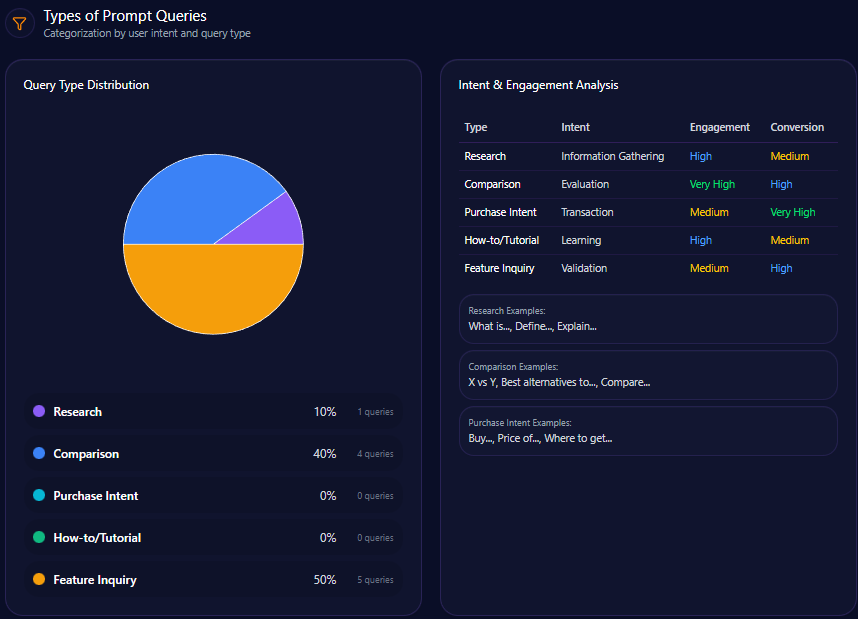
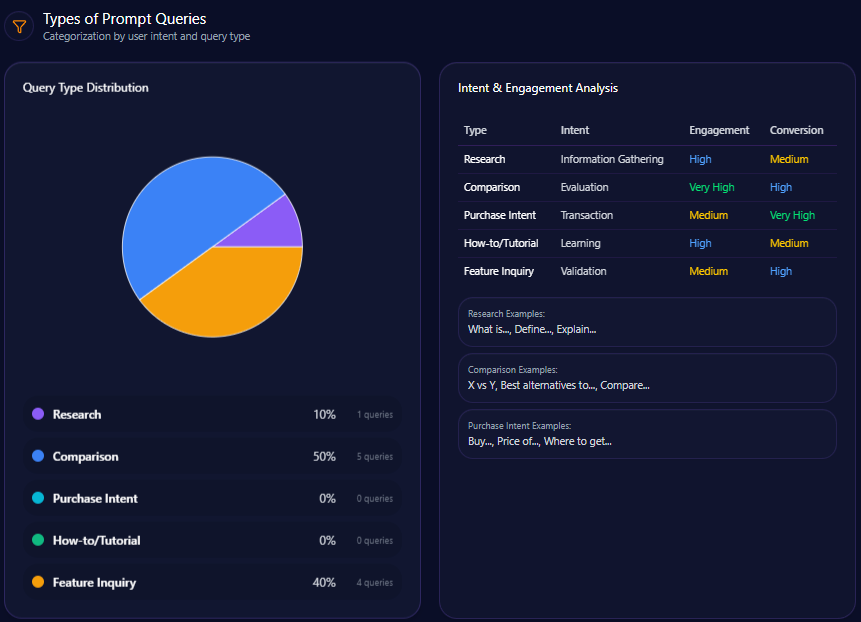
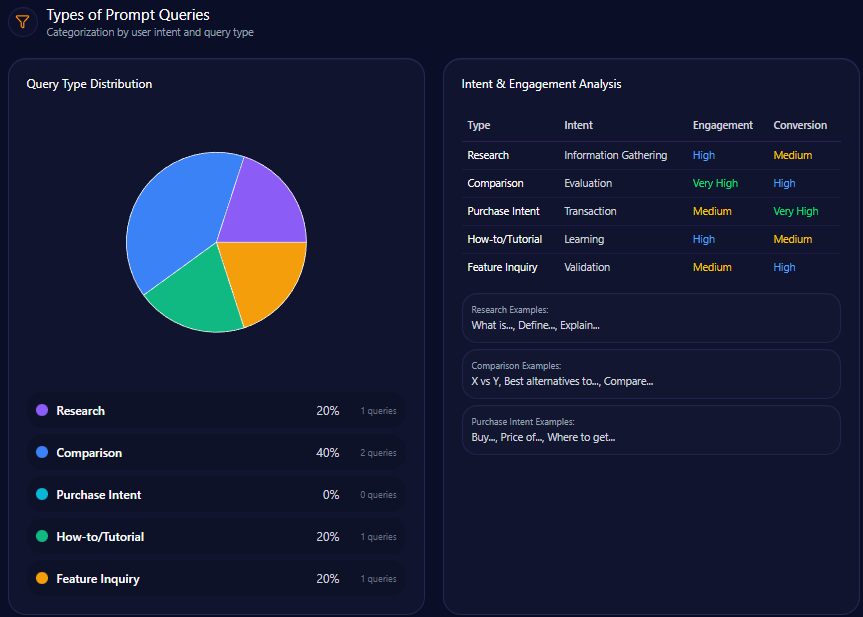
Types of Prompt Queries
- 40% are comparative queries, emphasizing competitor relativity in consumer choice.
- 20% research-focused, reflecting in-depth institutional finance interests.
- 20% split equally between feature inquiry and how-to/tutorial queries, revealing demand for usability and educational content.
- Purchase intent queries remain absent, illustrating missed conversion opportunities in generative content.
Service / Product-Level Sentiment
Service themes analysis reveals:
- 42% of mentions are on Rural and Agricultural Financing with strongly positive sentiment aligned to “farmer support programs” and “leading rural credit” status.
- 28% reference Digital Banking UX/UI with mixed to neutral sentiment citing “app performance” and “interface modernization.”
- 19% focus on Corporate Stability with generally positive tones around “state-owned reliability.”
- 11% cite Customer Service Quality, perceived neutrally regarding “branch speed” and “professionalism.”
E-commerce sentiment shows mixed reviews with 45.2% positive, but a significant 19% negative share, especially in shipping delays and pricing perceptions, indicating an area requiring improvement.
Conclusion
The GEO analytics paint Agribank as an institutionally powerful but digitally challenged incumbent. Its clear dominance in rural and agricultural finance commands stable, positive brand associations within generative AI ecosystems. However, its moderate 18% share of voice, widening digital interface citation gap, and limited visibility in retail and technology-driven prompts reveal urgent need for accelerated digital narrative and technical content modernization.
Comparisons clearly identify Techcombank and MB Bank as digital-first sector leaders in AI platforms such as ChatGPT and Copilot, capturing retail consumer mindshare through advanced content strategies. VPBank’s aggressive innovation storytelling and credit card prominence further pressure Agribank’s retail banking perceptions and AI discovery rank.
To sustain and grow its GEO advantage, Agribank should implement priority actions oriented around technical schema markup for its Agribank Plus app, a content series on digital rural transformation, and targeted ecommerce landing page optimization. In parallel, a renewed leadership narrative emphasizing digital modernization and ESG risk management can help transition legacy perceptions toward a forward-looking brand image in LLM brand mentions.
Explore SpyderBot to operationalize these GEO analytics insights.