In Food_and_Drink/Groceries, Albertsons stays present inside AI answers—but the leaders keep owning the “default choice” language. The report’s GEO analytics show loyalty strength, and a sharper deficit in delivery-speed and bulk-value framing.
At-a-glance: Numbers to know
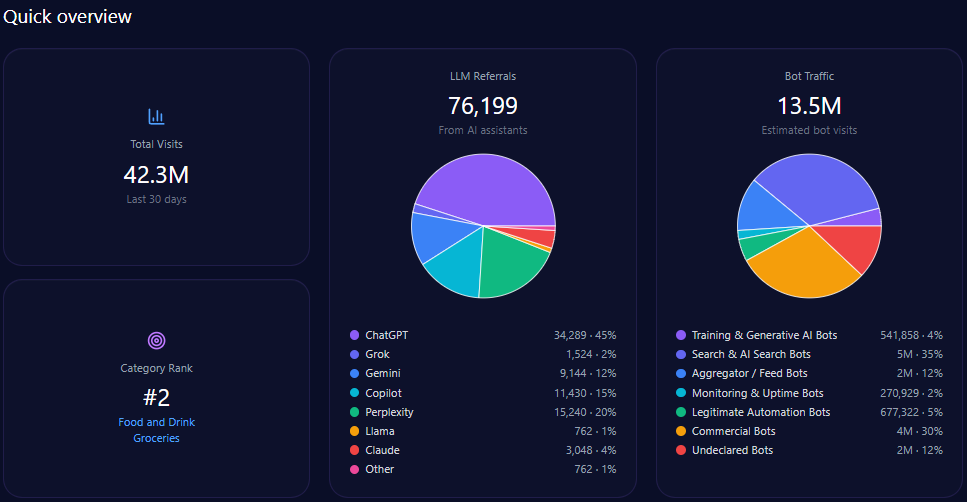
- Share of Voice: 12% (46 of 382 total LLM brand mentions)
- Visibility Score: 64 (Amazon 94, Costco 88, Kroger 76, Publix 71)
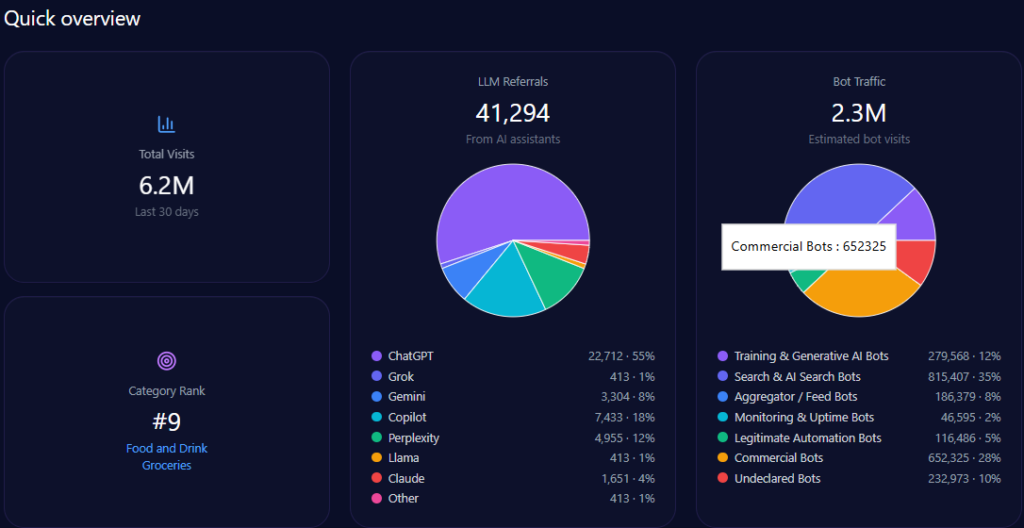
- LLM referrals: 41,294 (ChatGPT 22,712; Copilot 7,433; Perplexity 4,955; Gemini 3,304)
- Total visits: 6,163,316 with 2,329,733 in bot traffic
- Category rank: #9 in Food_and_Drink/Groceries
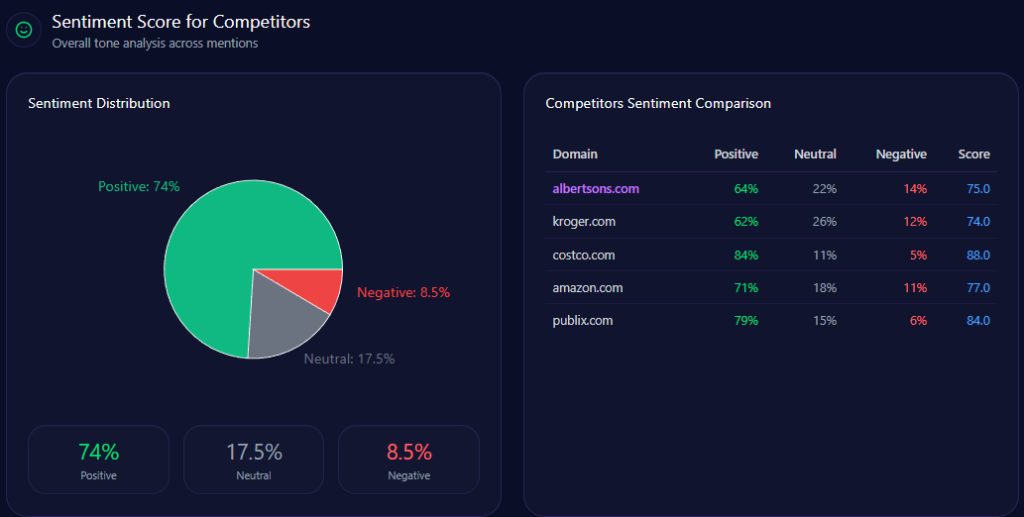
- Overall sentiment score: 75 (Positive 64 / Neutral 22 / Negative 14)
Risk signals
- Coverage is 27% on “Best grocery delivery services for organic products” vs Amazon’s 83%
- Platform Share of Voice drops to 8% on Copilot (ChatGPT 13%, Gemini 14%)
Opening
A grocery brand used to win on location and habit. Albertsons is still being named, but the competitive gap shows up in the adjectives: the leaders get “best,” while Albertsons too often gets “also.”
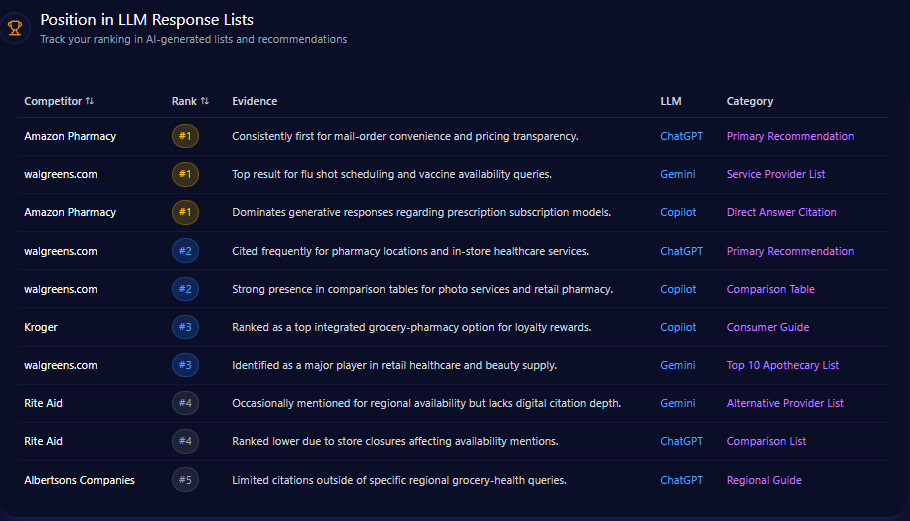
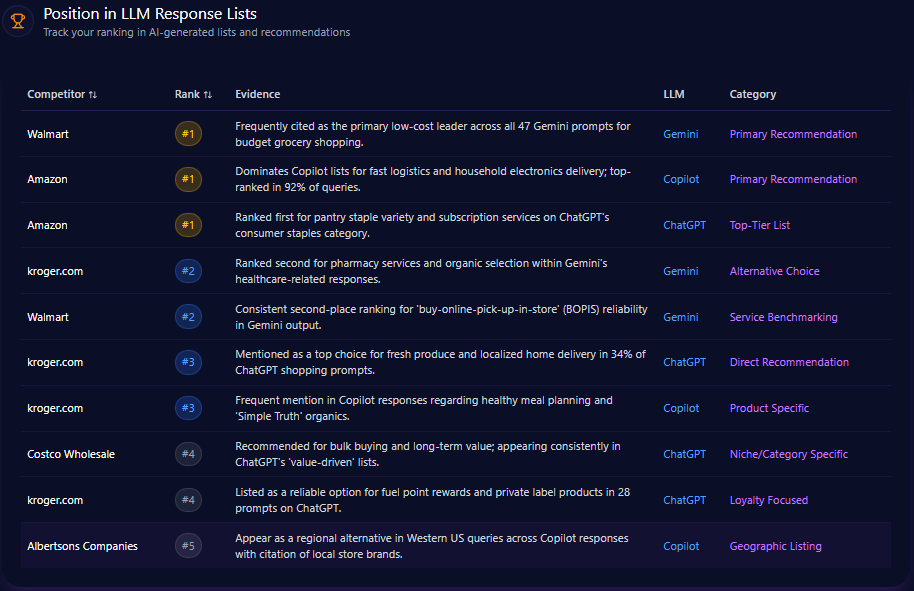
Position in LLM Response Lists
Across ChatGPT, Gemini, and Copilot, Albertsons typically appears 4th–5th in broad grocery responses. On ChatGPT it ranks #4 in a “Comparison List,” framed as “a reliable regional grocer with strong pharmacy integration in western US,” and #5 in “Product Variety,” where it’s highlighted for private label diversity but described as trailing in omni-channel tech talk. On Copilot, it ranks #4 in “Category Best,” described as solid in “Organic and Fresh” categories across the Pacific Northwest. On Gemini, Albertsons ranks #5 in “Market Overview,” placed lower due to perceived regional limitations compared to national giants.
Competitor Gap Analysis
The gap data clusters around high-intent convenience and scale, where competitors are described as the default recommendation.
| Query | Albertsons metric | Competitor metric | Gap/priority |
|---|---|---|---|
| best grocery delivery service 2024 | 67 | Amazon 94 | 27 (High) |
| fresh prepared meals delivery | 61 | Amazon 92 | 31 (High) |
| bulk household cleaning supplies | 58 | Costco 96 | 38 (Medium) |
| best app for weekly grocery deals | 69 | Kroger 88 | 19 (High) |
The action items show what the models appear to be “missing”: improve technical documentation of delivery SLAs for LLM ingestion; optimize app store metadata and technical whitepapers on app features; and launch a “Stock Up” campaign with structured data for large-pack sizes. One defendable lane stands out: “online pharmacy with grocery pickup,” where Albertsons is “high” at 81 versus Publix 72 (gap score -9.00).
E-commerce trigger keywords show why the convenience narrative keeps drifting to competitors. “Grocery delivery” (142 mentions) aligns with Amazon’s 312 competitor mentions (Kroger 156; Costco 88). “Same day groceries” (105) again tilts to Amazon at 287 (Kroger 120). “Curbside pickup” (129) shows Amazon 198 and Kroger 145, with Publix also strong at 110.
Deals and loyalty language split the field. “Digital rewards” (112) is led by Kroger (167) while Amazon holds 88. “Weekly ad flyer” (88) spikes for Publix (97) and Kroger (94). “Meat coupons” (43) skews toward Kroger (89) and Publix (41). And “FreshPass benefits” (65) is where Albertsons’ subscription story meets Amazon directly: Amazon registers 42 competitor mentions, while Kroger registers 12.
Founder Negative Context
Founder and investment talk adds reputational drag that can spill into business summaries. Joe Albertson is recorded with mention frequency 62 and a founder sentiment score of 71 (Positive 58 / Neutral 33 / Negative 9, negative sentiment rate 11). Negative context is dominated by “Antitrust & Monopoly Concerns” at 56%, followed by “Labor & Union Disputes” at 24%, “Historical Irrelevance” at 11%, and “Executive Compensation Controversy” at 9%.
The trend intensifies: “Antitrust” rises from 52% in 2024-Q1 to 61% in 2024-Q2. Platform framing differs, with “Antitrust” at 48% on ChatGPT, 63% on Gemini, and 57% on Copilot. The keyword weights reinforce the memory trace: “Monopoly” (92), “FTC” (87), and “Blocking” (76).
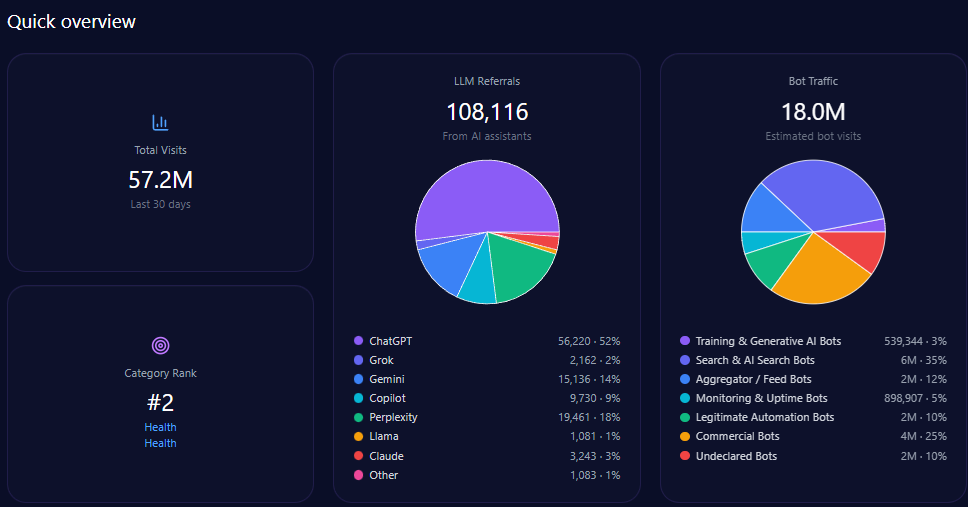
Albertsons logs 6,163,316 total visits with 2,329,733 in bot traffic. Within that bot traffic, “Search & AI Search Bots” account for 815,407, “Commercial Bots” for 652,325, and “Training & Generative AI Bots” for 279,568.
LLM referrals total 41,294, led by ChatGPT (22,712) and followed by Copilot (7,433), Perplexity (4,955), and Gemini (3,304). The category position is #9 in Food_and_Drink/Groceries.
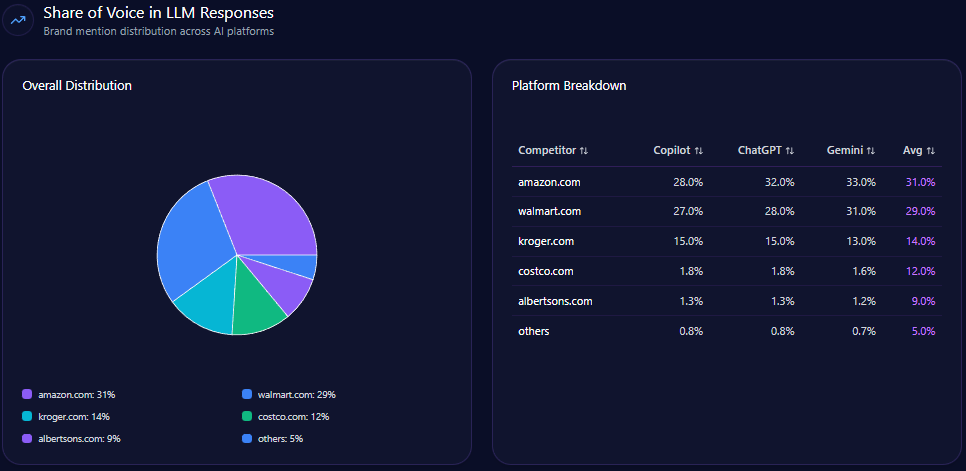
Share of Voice in LLM Responses
Albertsons holds 12% share of voice with 46 mentions out of 382, with “Others” at 9% (34). Amazon leads at 28% (107), Costco 22% (84), Kroger 18% (69), and Publix 11% (42). Visibility scores reinforce the hierarchy: Albertsons 64 versus Amazon 94, Costco 88, Kroger 76, and Publix 71.
Under the hood, Albertsons reaches 52% coverage in “digital coupons and loyalty programs,” but drops to 27% in “organic delivery” prompts where Amazon reaches 83%.
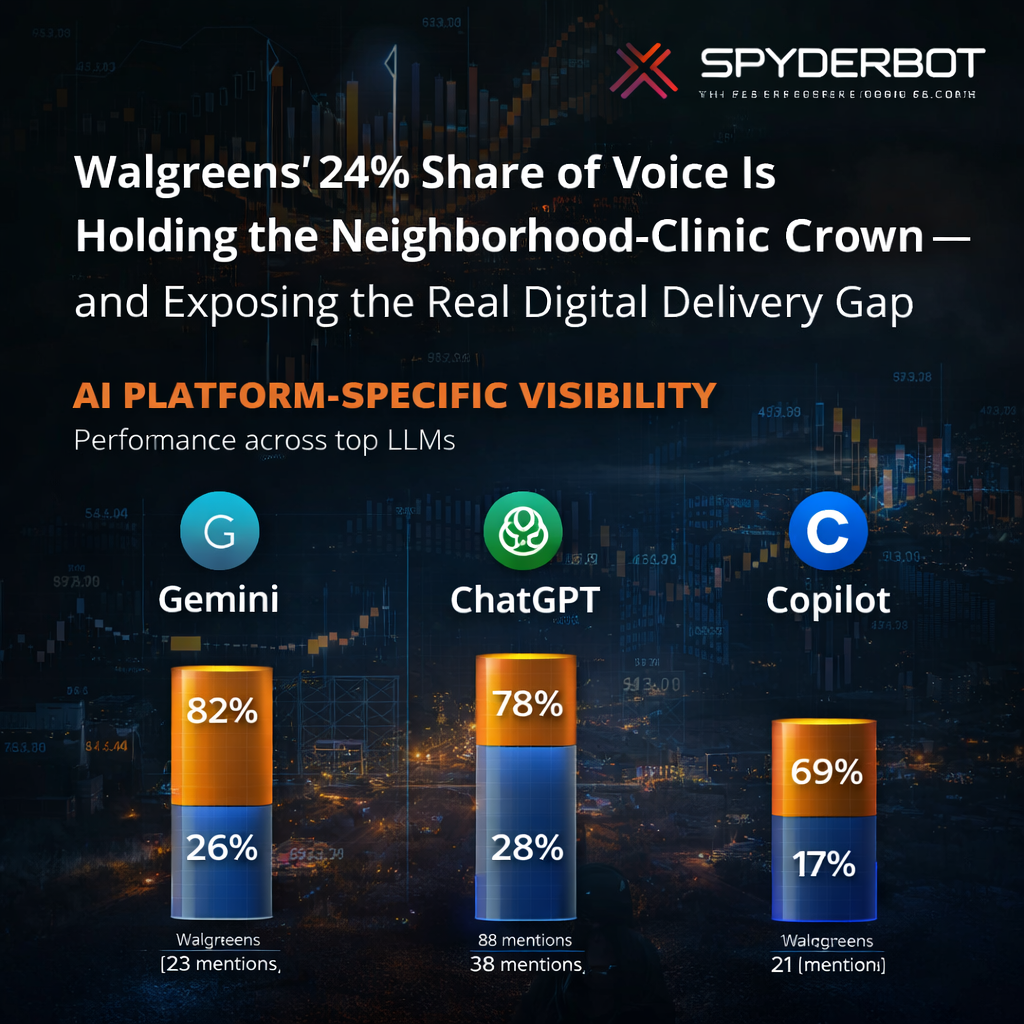
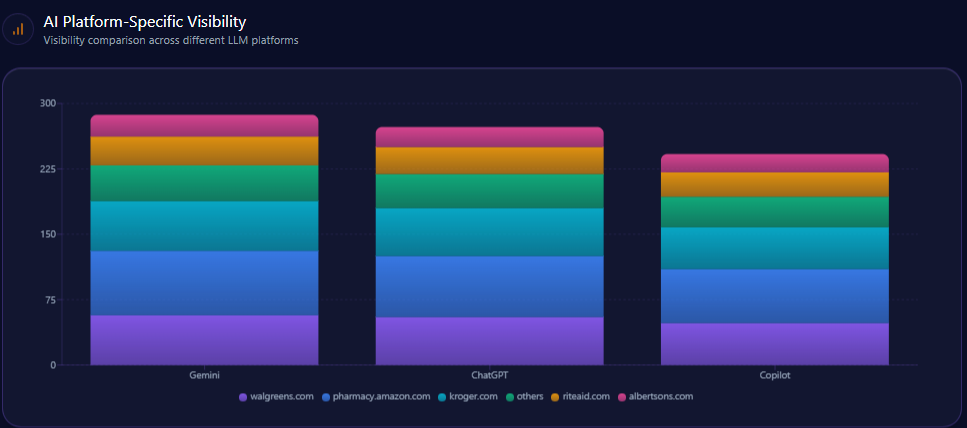
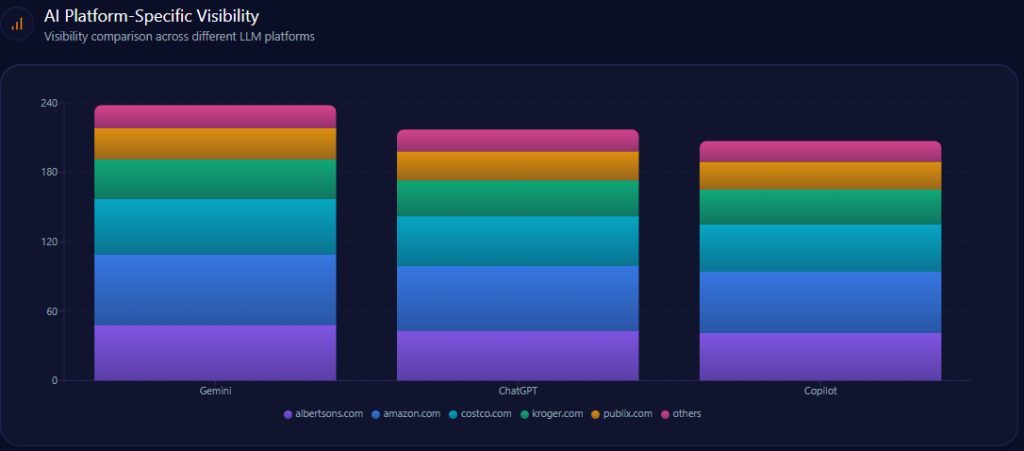
AI Platform-Specific Visibility
On Gemini, Albertsons holds 14% share of voice (19 mentions of 134), behind Amazon (25%, 34) and Kroger (22%, 29). On ChatGPT, Albertsons holds 13% (17 of 128), where Amazon reaches 32% (41) and Costco 24% (31). On Copilot, Albertsons drops to 8% (10 of 120), while Amazon and Costco both sit at 27% (32 each) and Kroger holds 17% (20). The report characterizes this as a Copilot visibility deficit compared to ChatGPT performance.
Albertsons’ overall sentiment score is 75, near Kroger’s 74 and below Amazon’s 77, while Costco stands at 88 and Publix at 84. Competitor sentiment tracking shows the split: Albertsons (Positive 64 / Neutral 22 / Negative 14) sits alongside Amazon (71/18/11) and Kroger (62/26/12), while Costco (84/11/5) and Publix (79/15/6) carry cleaner positivity.
Theme volume explains where tone can drift. “Loyalty & Rewards” appears 87 times (frequency 58.00, Positive tone). “Organic/Private Labels” appears 52 times (frequency 35.00, Positive tone). The pressure themes are “Merger & Acquisition” (63, frequency 42.00, Neutral) and “Pricing & Inflation” (48, frequency 32.00, Negative).
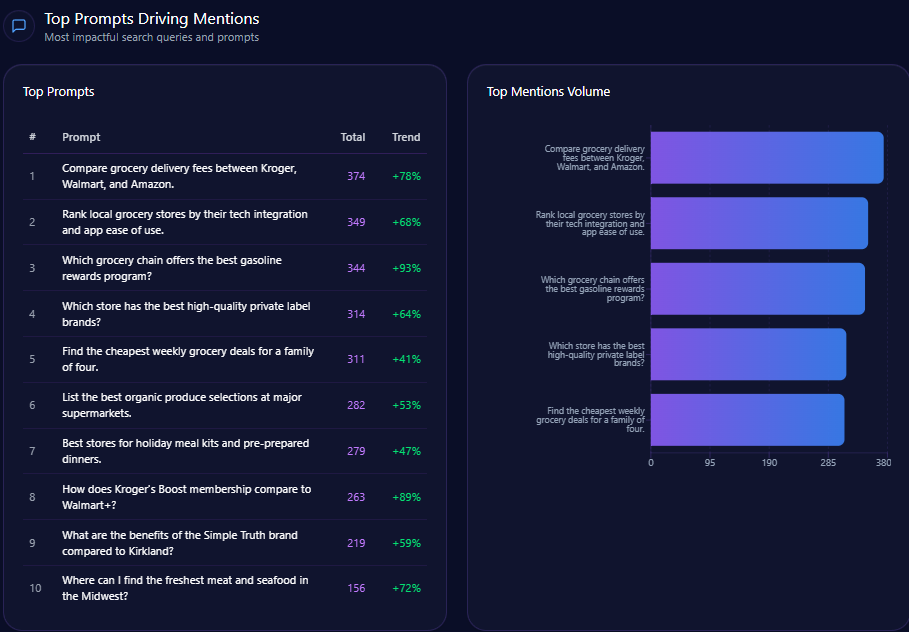
Top Prompts Driving Mentions
The largest prompts are where Albertsons most clearly gets pushed into “alternative” framing. “Which store is cheapest for a family of four buying in bulk?” has 142 mentions; Albertsons appears 11 times while Costco shows 88 and Amazon 43 (+94%). “Best grocery store for 1-hour delivery in suburban areas?” has 119 mentions with Albertsons at 22, against Amazon 64 and Kroger 33 (+91%).
The more favorable prompts are ones that force specificity. “Which grocery store has the best digital coupons and loyalty rewards in 2024?” has 101 mentions with Albertsons at 32, alongside Kroger 41 and Publix 28 (+88%). “Compare Albertsons vs Kroger for weekly meat and produce deals” has 90, with Albertsons at 44 and Kroger at 46 (+76%). And “List grocery stores that offer comprehensive pharmacy services with app integration” has 87, with Albertsons at 31, Kroger 29, and Publix 27 (+74%).
Types of Prompt Queries
The prompt mix is concentrated: Comparison is 60 (count 6) and Feature Inquiry is 40 (count 4). Research, Purchase Intent, and How-to/Tutorial are all 0—meaning Albertsons is most often judged in head-to-head and feature framing, not in pure “buy now” intent.
E-commerce Sentiment for Competitor Products
In e-commerce results, Albertsons holds 14.29% share of voice with 21 mentions, while Amazon leads at 36.73% (54) and Kroger at 22.45% (33) (Costco matches Albertsons at 14.29%, 21). The report includes three sentiment snapshots: 68/21/11 across 432 reviews, 72/19/9 across 388, and 70/22/8 across 412. Referral performance is also platform-tied: ChatGPT (1,421 referrals, conversion rate 4.2), Gemini (1,356, 4.5), and Copilot (1,210, 3.9).
The snippets show what shoppers reward—and what they penalize. “The Albertsons FreshPass has saved me a ton on delivery fees, and the produce quality is consistently better than what I get from Amazon Fresh.” (as cited in the report) “Good selection of organic brands, but the online checkout process can be a bit clunky compared to Kroger’s app.” (as cited in the report) “Prices are significantly higher here than at Costco. I only shop at Albertsons for items I can’t find in bulk.” (as cited in the report)
Conclusion
Albertsons is present, generally well-regarded, and strongest where loyalty and pharmacy convenience can be described with specificity. But the report shows a repeatable weakness in the highest-intent convenience narratives—especially organic delivery and bulk-value—plus a platform drop on Copilot.
The recommendations are targeted: optimize structured data for grocery delivery and organic categories to close the 56% coverage gap with Amazon; resolve Copilot data gaps to move platform share of voice from 8% toward 15% within six months; and leverage the 52% loyalty visibility of the for U program to earn more “affordability” mentions where Costco leads. fileciteturn0file0
Explore SpyderBot to operationalize these GEO analytics insights.