Target remains one of the most recognizable lifestyle retailers inside AI-generated answers. Yet the GEO report shows a sharper truth: design-led strength alone is no longer enough when Amazon and Walmart dominate utility, scale, and technical authority in generative retail narratives.
At-a-glance: what the GEO report makes unavoidable
- Share of Voice: Target holds 16% (63 mentions), trailing Amazon (37%) and Walmart (26%)
- Visibility Score: 77 for Target, versus Amazon (96) and Walmart (88)
- Category Rank: #6 in E-commerce_and_Shopping / Marketplace
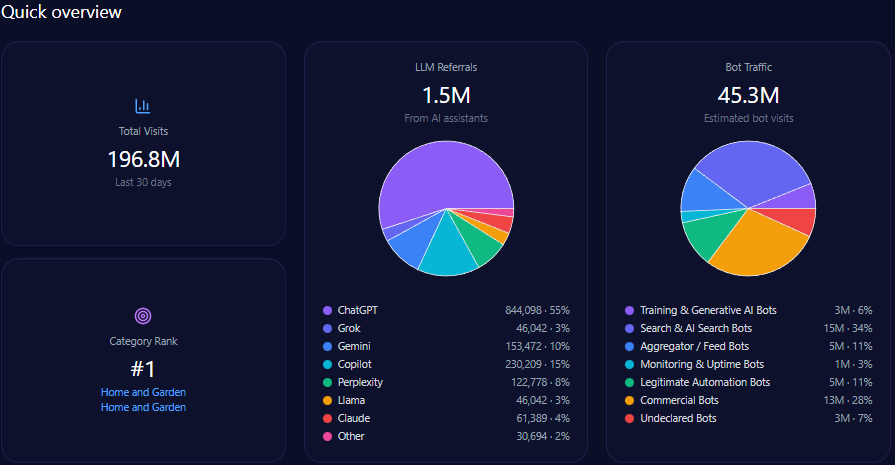
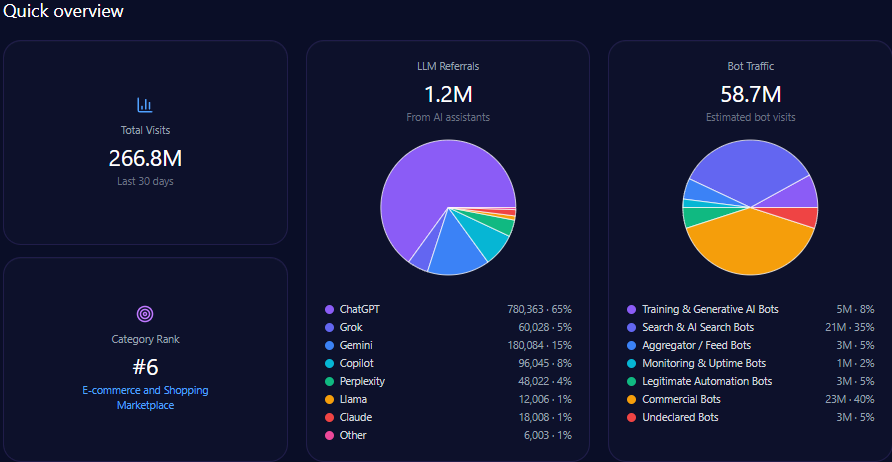
- LLM Referrals: 1,200,559, led by ChatGPT (780,363) and Gemini (180,084)
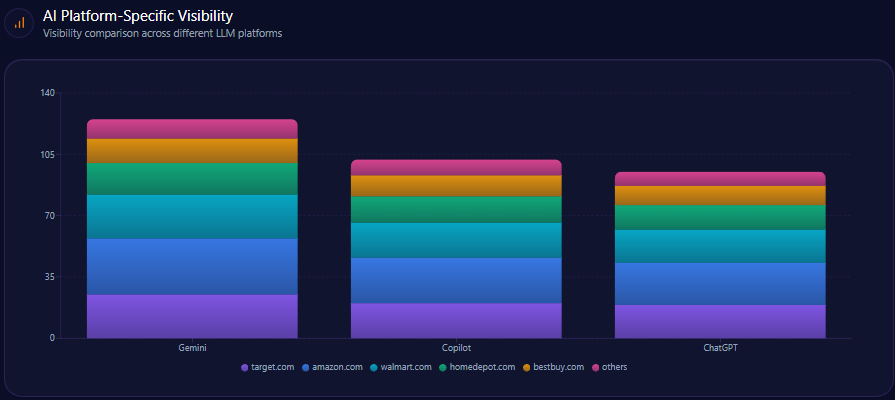
- Platform Strength: Best visibility on Gemini (35%), lower on ChatGPT (27%)
- Key Risk Signal: Electronics coverage at 29%, far behind Best Buy (88%) and Amazon (94%)
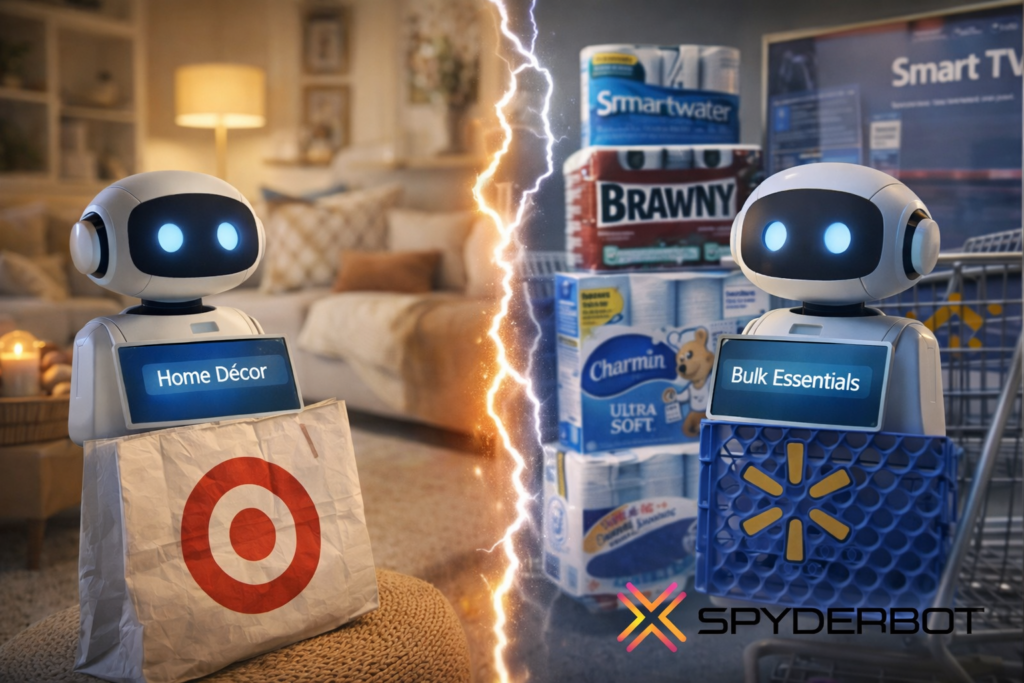
Imagine a shopper asking an AI assistant a simple question: “Where should I buy stylish home décor on a budget?” Target appears quickly confident, familiar, dependable. Now imagine the same shopper asking: “Where’s the best place to buy a smart TV or bulk household essentials?” The answer changes, and Target starts to fade.
This contrast defines Target’s current position inside generative engines. The brand is present, respected, and frequently cited but selectively. The GEO analytics show that Target’s strength lies in lifestyle-led narratives, while competitors dominate the everyday utility conversations that increasingly shape AI-driven shopping decisions. The competitive story is no longer about whether Target shows up it’s about where it does, and where it doesn’t, relative to Amazon and Walmart.
Position in LLM Response Lists
Across analyzed LLM responses, Target consistently appears in curated and lifestyle-oriented lists rather than universal retail rankings. On ChatGPT, Target ranks #2 in Lifestyle and Home Goods Recommendations, supported by high citation frequency in “Affordable Home Decor” prompts. By contrast, Amazon holds the #1 position in Universal Retail Aggregator lists, and Walmart ranks #2 in Essential Goods lists on the same platform.
On Gemini, Target’s position softens further. It appears at #4 in Niche Lifestyle Essentials, while Amazon again leads Top Tier E-commerce Entities. Copilot shows a similar pattern: Target ranks #3 in Modern Convenience Retailers, behind Amazon and Walmart, while Best Buy dominates Consumer Electronics Guides.
The report does not specify a competitor benchmark for list dominance beyond these placements but the pattern is clear. Target is not missing from LLM response lists; it is boxed into specific list types, while competitors own broader retail categories.
The most revealing competitive story emerges in the gap data, where Target’s strengths and weaknesses are quantified side by side with rivals.
| Query | Target position/metric | Competitor position/metric | Gap score | Priority | Action item |
|---|---|---|---|---|---|
| Gaming console comparison | 41 | Best Buy: 96 | 55 | High | Create comparison-rich landing pages with structured data tables |
| Best deals on smart TVs | 62 | Best Buy: 94 | 32 | High | Enhance product descriptions with expert guides and technical metadata |
| Bulk household essentials | 74 | Amazon: 93 | 19 | Medium | Incorporate recurring savings terminology into generative-facing content |
| Same-day organic grocery delivery | 84 | Walmart: 91 | 7 | Medium | Optimize schema data for Shipt integration |
| Kids back-to-school outfits | 95 | Walmart: 73 | 22 | Low | Continue leveraging influencer citations |
This table makes the competitive reality unavoidable. Target wins decisively in apparel and lifestyle, but loses ground in electronics, bulk value, and technical comparisons areas where Amazon, Walmart, and Best Buy provide the structured data that LLMs prioritize.
Trigger Keywords for Competitor Products
Trigger keywords further reinforce this divide. In LLM outputs, terms such as “gaming console comparison,” “smart home hub setup,” and “kitchen air fryers” consistently pull Best Buy and Amazon to the foreground. Target’s presence in these triggers remains diluted.
Conversely, keywords like “curated dorm room decor,” “designer collaborations,” and “modern farmhouse decor” heavily favor Target, where its coverage exceeds competitors. Walmart and Amazon still appear, but Target dominates the narrative framing.
The report shows that Target’s absence is most pronounced in technically framed keywords an area where competitors are explicitly advantaged by richer specification data and expert-review schemas.
Founder Negative Context
Leadership narratives add another layer of competitive contrast. Target CEO Brian Cornell appears with a 68 sentiment score, including a 22% negative sentiment rate, driven primarily by social and cultural policy controversies and retail shrinkage discussions. Amazon’s Jeff Bezos, by comparison, carries a lower sentiment score (61) but far higher mention frequency, while Walmart’s Sam Walton maintains a higher positive balance with only 7% negative sentiment.
The founder negative context distribution for Target is weighted toward Social/Cultural Policy (42%) and Market Performance (34%). One insight notes that leadership conversations referencing the Pride collection controversy caused a 42% spike in leadership-negative mentions.
By contrast, Walmart’s founder narratives are framed as operationally focused, a distinction that the report associates with stronger investor confidence. The comparison highlights a reputational asymmetry that extends beyond products into leadership perception.
At a macro level, Target recorded 266,790,786 total visits, including 58,693,973 bot visits, and 1,200,559 LLM referrals. Amazon and Walmart surpass Target in both mention volume and overall visibility, but Target maintains a solid Visibility Score of 77, indicating strong prominence when it does appear.
Competitor benchmarks reinforce this snapshot. Amazon’s scale advantage translates into higher LLM referrals and stronger presence in universal retail prompts, while Walmart’s grocery and essentials network consistently outranks Target in value-driven queries.
Inside AI-generated answers, share of voice reflects true mindshare. Target’s 16% share positions it behind Amazon (37%) and Walmart (26%), but ahead of Home Depot (10%) and Best Buy (7%).
What differentiates Target is not volume, but contextual efficiency. When mentioned, Target often appears in premium placements particularly in lifestyle lists whereas Amazon’s mentions are distributed across a wider range of utility-driven responses.
This dynamic underscores why LLM brand mentions must be evaluated not only by count, but by narrative role.
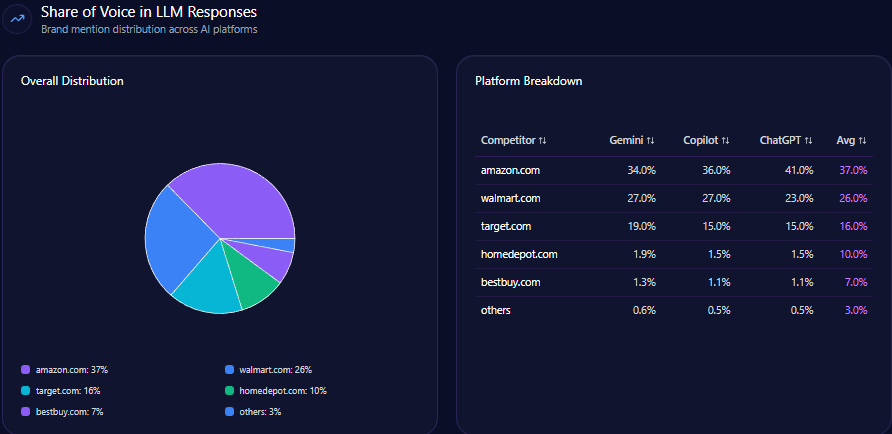
Platform bias plays a decisive role. Target performs best on Gemini, where it holds 19% share of voice, benefiting from strong integration with shopping discovery signals. Amazon leads with 34%, and Walmart follows at 27%.
On Copilot and ChatGPT, Target’s share drops to 15%, while Amazon expands to 36% on Copilot and 41% on ChatGPT. Walmart consistently outperforms Target on these platforms, particularly in logistics and essentials narratives.
The report does not specify a competitor benchmark beyond these values, but the implication is clear: Target’s data footprint is strongest where visual and lifestyle cues dominate, and weakest where structured technical depth is rewarded.
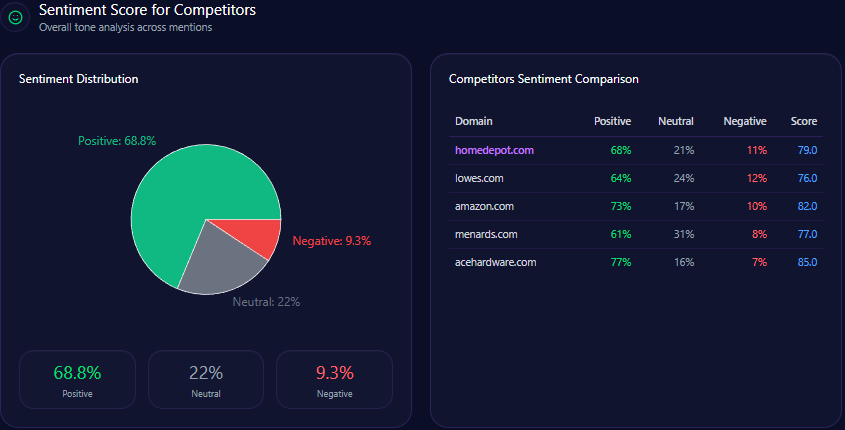
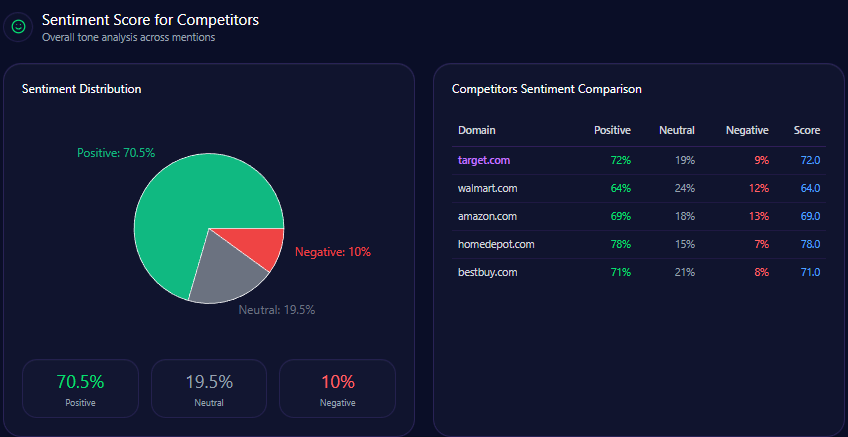
Sentiment analysis further sharpens the comparison. Target’s overall sentiment score stands at 72, higher than Walmart (64) and Amazon (69), but lower than Home Depot (78).
Context themes reveal why. Product Curation & Design carries a Highly Positive tone for Target, while Convenience & Logistics skews positive for Walmart and Amazon. Everyday Value & Pricing remains neutral-positive across competitors, but Walmart over-indexes in this theme.
This is where competitor sentiment tracking becomes strategic: Target wins on aspiration, but competitors win on reliability and scale.
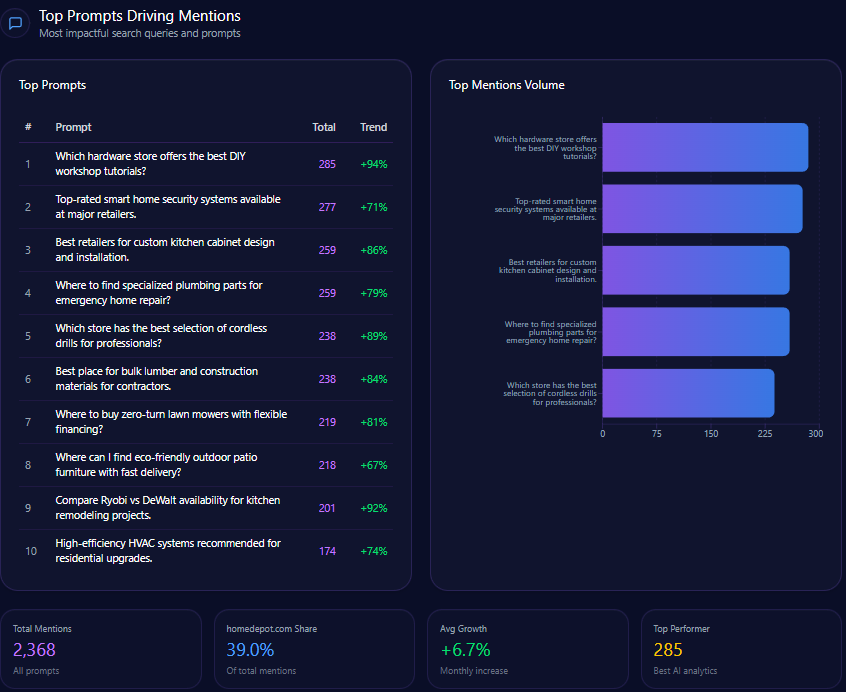
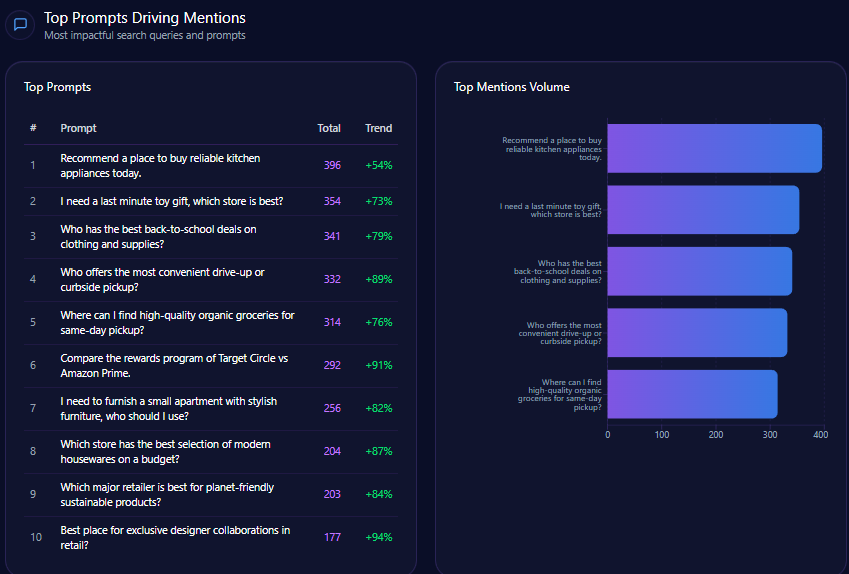
The prompts that “summon” Target are telling. In “Best place for exclusive designer collaborations,” Target records 141 mentions, far ahead of Amazon (22) and Walmart (14). In “Who offers the most convenient drive-up or curbside pickup?” Target appears 122 times, closely matched by Walmart (126).
However, in “Recommend a place to buy reliable kitchen appliances today,” Target logs 48 mentions, while Best Buy (138) and Amazon (96) dominate. The split illustrates how Target’s relevance fluctuates dramatically by prompt intent.
Types of Prompt Queries
Prompt-type distribution skews heavily toward Comparison queries (60%) and Feature Inquiry (30%), with minimal representation in pure purchase-intent prompts. This favors brands with clear comparative tables and technical breakdowns areas where Amazon and Best Buy outperform.
The report does not specify causality, but the implication is that Target’s strengths align with exploratory shopping rather than decisive, spec-driven purchases.
E-commerce Sentiment for Competitor Products
At the product level, e-commerce sentiment remains a bright spot. Target’s reviews show 78% positive, 17% neutral, and 5% negative sentiment. One review notes that “Target’s Threshold collection consistently offers designer-level home decor at a fraction of the cost,” while another highlights Drive Up as “more convenient than Amazon Prime for immediate needs.”
Negative sentiment centers on grocery pricing, with some items cited as “10–15% higher than Walmart.” Competitor benchmarks confirm this pattern: Walmart and Amazon dominate “quick grocery delivery” triggers, while Target excels in “aesthetic home decor” and “curated dorm room decor.”
Conclusion
The GEO report positions Target at a strategic crossroads. Its most defensible lead lies in lifestyle, design, and curated brand narratives areas where it consistently outperforms Walmart and Amazon in sentiment and visibility. Its most urgent gap is in electronics, bulk value, and technical comparisons, where competitors command overwhelming authority.
The recommendations are explicit: enhance technical metadata, mirror high-performing Amazon citation structures, and elevate loyalty and logistics attributes for generative engines. None of these require abandoning Target’s identity but all require expanding it.
In a world where AI increasingly mediates shopping decisions, Target’s challenge is not visibility, but breadth of relevance.