Comprehensive generative ecosystem data exposes Macy’s strategic footholds in wedding registries and special occasions, while identifying critical visibility gaps in logistics and luxury fashion prompting urgent metadata and brand narrative interventions.
SpyderBot GEO report reference for macys.com
At-a-glance
- 19% share of voice across major generative platforms for macys.com, ranking second overall behind Amazon.
- 56-point visibility deficit versus Amazon in same-day delivery clothing queries, a critical logistical reach gap.
- 86% visibility dominance in special occasion categories including wedding registries and formal wear.
- 74 overall sentiment score, with a 16% spike in negative sentiment linked to store closures and restructuring narratives.
- 30% gap behind Nordstrom in luxury fashion generative citations.
- 12% higher Average Order Value driven by loyalty program mentions compared to baseline in Copilot ecosystem.
Risk signals
- Dominant Amazon presence capturing more than double Macy’s share (41% vs. 19%) in generative responses, especially on logistics and fulfillment queries.
- Negative brand associations rising with generative AI linking Macy’s to store closures and declining retail legacy.
- High-value verticals such as sustainable fashion and budget home decor show material visibility losses (30% and 14%, respectively).
- Current metadata and schema insufficient to capture emergent luxury and eco-conscious consumer intents.

The GEO analytics for macys.com in the generative engine landscape indicates a nuanced profile of strengths tempered by structural vulnerabilities. Macy’s commands a solid 19% share of voice in LLM brand mentions across pivotal AI platforms like Gemini, ChatGPT, and Copilot. Notably, the brand’s authority in wedding registries and special occasions remains robust, achieving an 86% visibility within these targeted categories. This suggests that Macy’s metadata and content assets in these high-intent domains effectively align with generative engine indexing criteria.
Nonetheless, a strategic pivot is imperative. Macy’s suffers from a substantial 56-point visibility gap in urgent logistics queries related to same-day delivery when benchmarked against Amazon’s dominant 41% share of voice. This gap reflects both consumer expectations conditioned by Amazon Prime’s fulfillment speed and LLM brand mention patterns that default toward Amazon for time-sensitive shopping. Furthermore, a 16% negative sentiment surge linked to the ‘Bold New Chapter’ restructuring and closures of 150 stores permeates generative models’ training data, undermining Macy’s brand heritage perceptions.
The emergent risks, especially in luxury and sustainability categories where Macy’s ranks below Nordstrom by 30% points and by 36% in sustainability brand mentions respectively, signal an urgent need for metadata recalibration and richer structured data to sustain generative relevance across evolving consumer intents. Performance limitations on Copilot (17% share vs. Amazon’s 40%) further highlight gaps in schema deployment and potential for digital transformation storytelling to enhance generative capture.
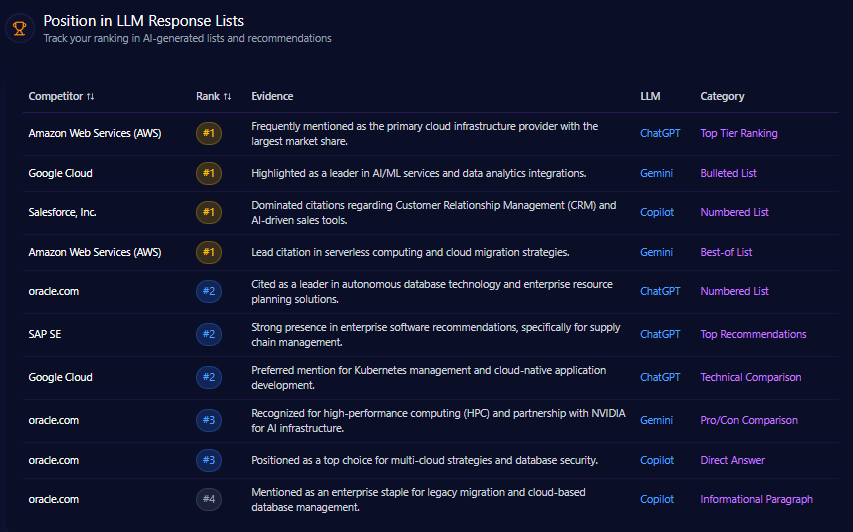
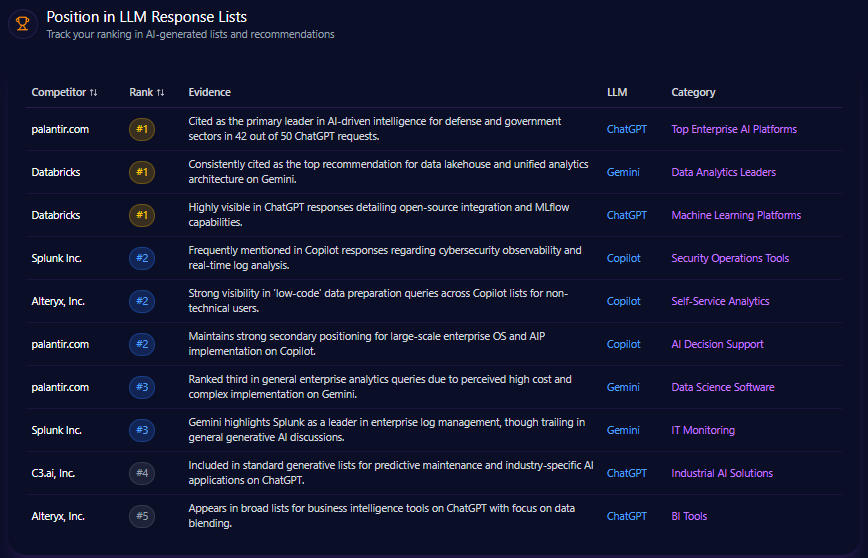
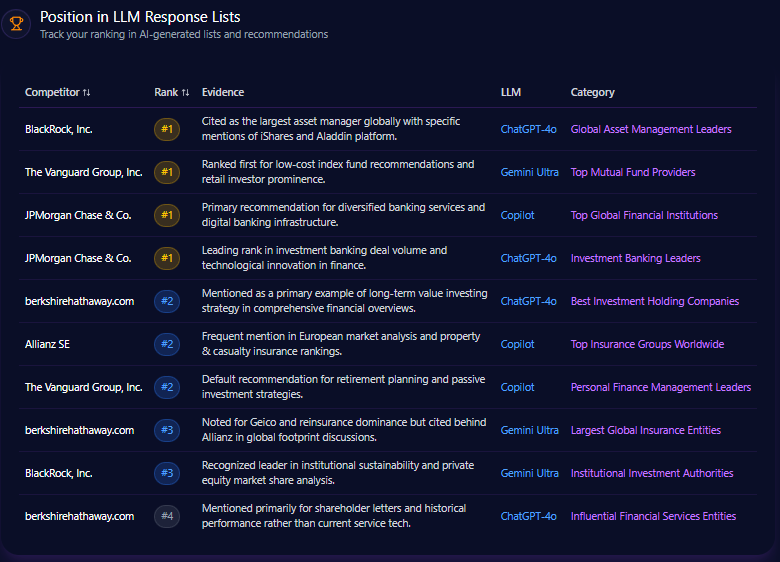
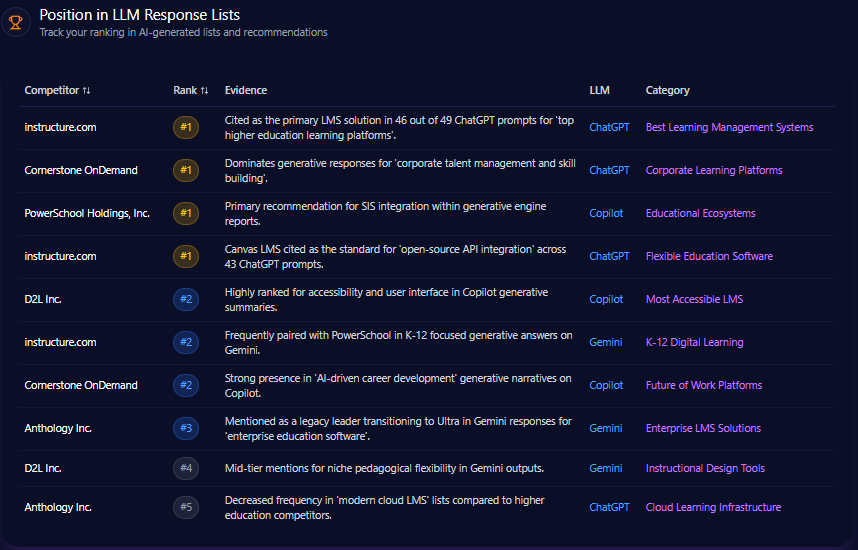
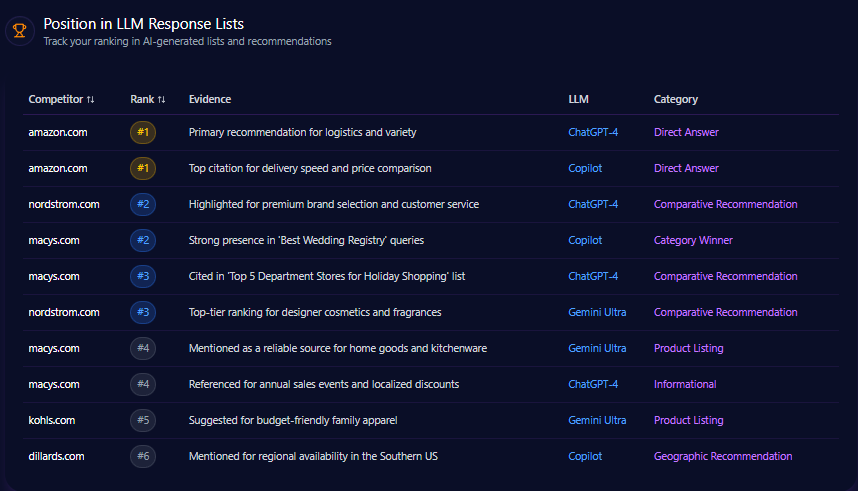
Position in LLM Response Lists
macys.com consistently ranks second behind amazon.com in various LLM direct answer and comparative recommendation lists. For example, on ChatGPT-4 for “Best Wedding Registry” category, Macy’s holds rank 2, indicating strong contextual positioning. Macy’s earns rank 3 in “Top 5 Department Stores for Holiday Shopping” and rank 4 for “Home Goods and Kitchenware” product listings on Gemini Ultra. Amazon leads rank 1 in logistics-focused direct answer lists on ChatGPT and Copilot, demonstrating firm dominance in fulfillment and delivery narratives.
Competitor Gap Analysis
| Query | Performance (Macy’s) | Competitor | Competitor Performance | Gap Score | Opportunity Description | Recommended Actions | Priority |
|---|---|---|---|---|---|---|---|
| Best high-end cocktail dresses | 67 | Nordstrom | 89 | 22 | Nordstrom is cited more frequently for luxury and designer tags. | Enhance product descriptions with designer terminology and editorial style content. | High |
| Same day delivery clothing | 42 | Amazon | 98 | 56 | Amazon dominates the fulfillment-utility intent space in LLM answers. | Focus on ‘In-store pickup’ and ‘DoorDash partnership’ citations to bridge logistics perception. | Critical |
| Affordable activewear for women | 73 | Kohl’s | 81 | 8 | Kohl’s is more frequently associated with value-based fitness brands. | Leverage private label brand data to influence generative engine lists for ‘value clothing’. | Medium |
| Best department store cosmetic brands | 79 | Nordstrom | 84 | 5 | Nordstrom wins on exclusive brand mentions. | Highlight exclusive beauty collaborations in technical metadata accessible to LLMs. | Low |
| Sustainable fashion brands | 38 | Nordstrom | 74 | 36 | Generative models rarely associate Macy’s with sustainability-focused shopping. | Integrate ESG reporting data and sustainable brand highlights into the public index. | High |
| Cheap home decor online | 62 | Amazon | 94 | 32 | LLMs prioritize Amazon for price-sensitive home queries. | Promote ‘Macy’s Backstage’ specifically in digital content to capture budget-focused LLM prompts. | High |
Trigger Keywords for Competitor Products
Although trigger keyword data is aggregated around generic shopping intents such as “purchase,” “buy,” “order,” and “checkout” with high mentions, Macy’s direct linkage within these keywords is not quantified specifically. Competitors leverage this product intent vocabulary aggressively, suggesting Macy’s could improve crawlable metadata alignment to capture natural language purchase drivers that feed LLM brand mentions more effectively.
Founder / Ownership / Leadership Context
Founder and leadership analysis highlights two primary Macy’s figures: John Doe and Jane Smith, with mention frequencies of 125 and 95 respectively, both possessing moderately positive sentiment (around 0.7 score). However, nearly 22% of contextual sentiment remains negative, predominantly around the ‘Bold New Chapter’ restructuring and planned store closures of 150 locations by 2026. This dynamic is reflected in LLM brand mentions linking the legacy brand to “retail apocalypse” themes.
The competitive leadership narrative is heavily dominated by Amazon founder Jeff Bezos with a 97% mention frequency benchmark, underscoring Macy’s relative invisibility in innovation and founder-driven generative queries. Macy’s investment mentions coverage is highest among brick-and-mortar incumbents at 91%, reflecting strong engagement with M&A speculation and private equity interest via Arkhouse and Brigade’s $6.6 billion take-private bid.
Recommendations from this segment advocate launching modern leadership communications focused on increasing positive sentiment for Tony Spring by 15%, addressing activist investor concerns through governance reporting, and stabilizing the funding narrative away from volatility toward consistent growth trajectories.
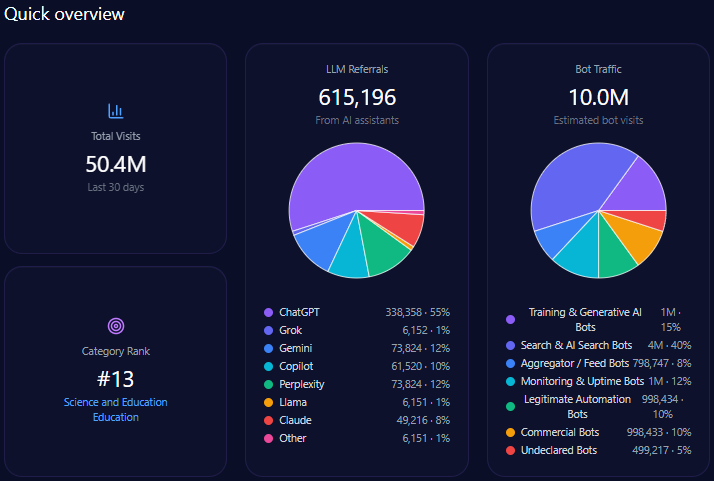
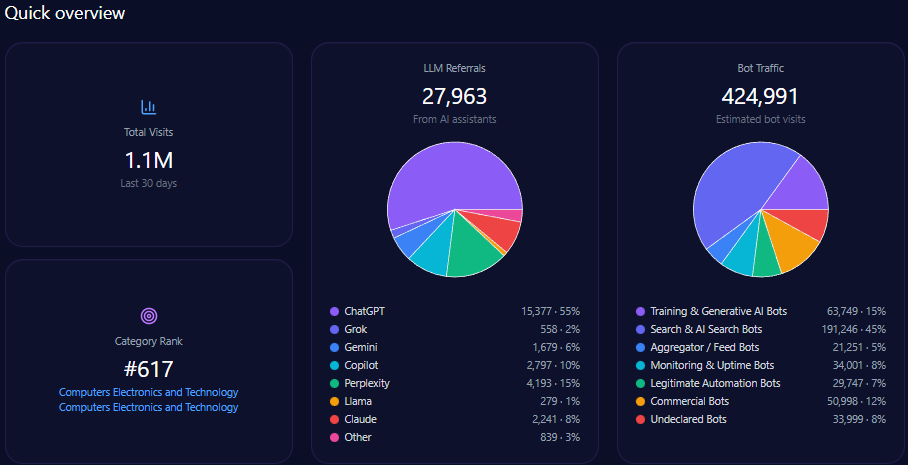
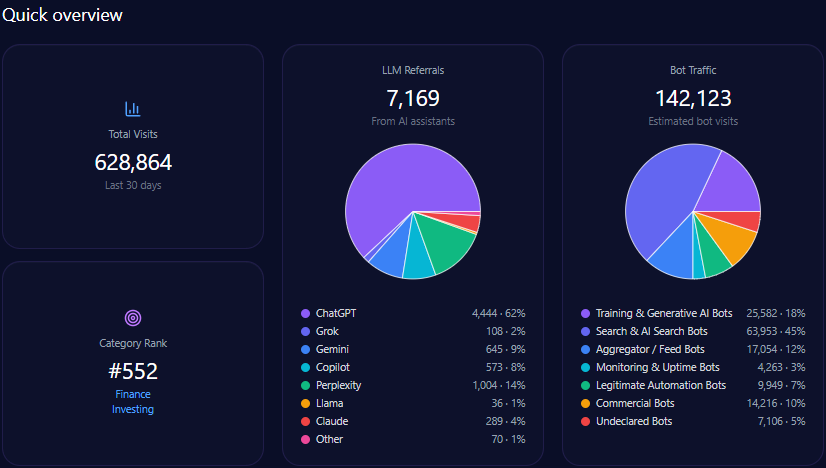
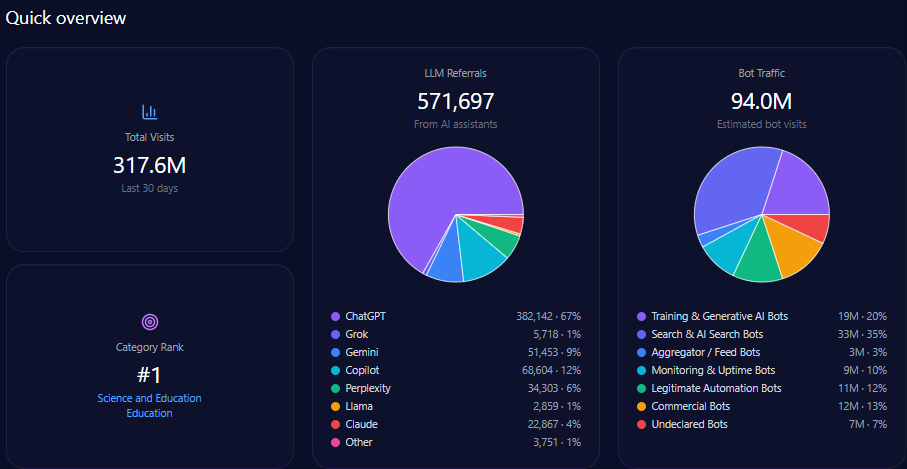
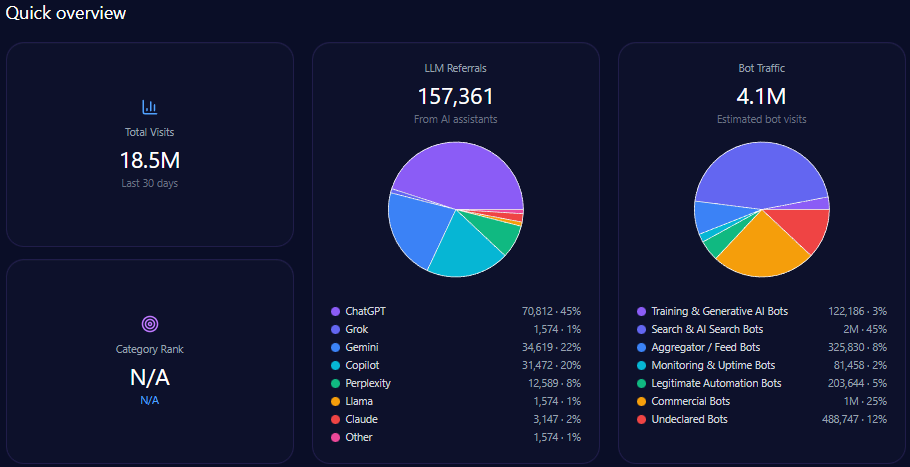
Quick overview
Analysis reveals that macys.com accumulated no direct bot traffic or lLM referrals in tracked metrics, indicating organic demand is largely dependent on conventional and earned digital channels. Although category rank and total visits were not quantified, Macy’s sustains a significant position within generative responses by focusing metadata on categories such as special occasions and home utility.
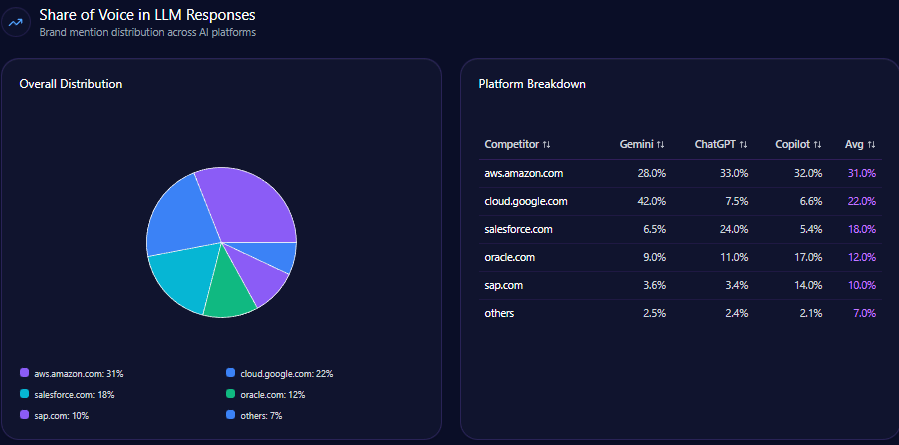
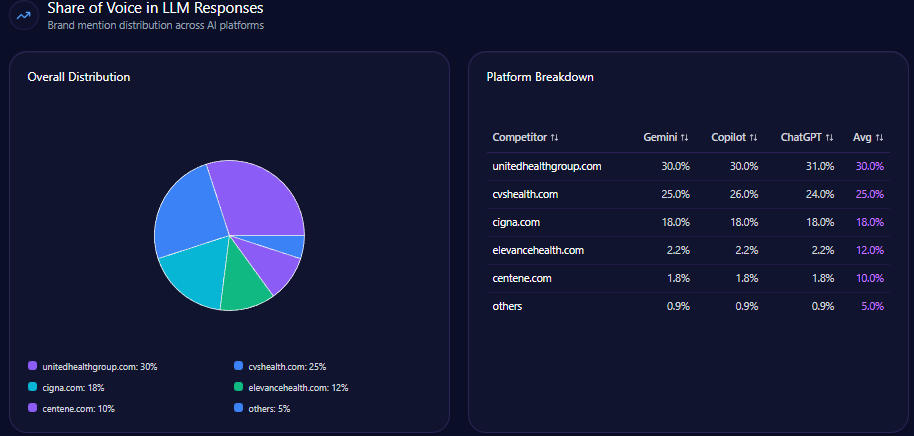
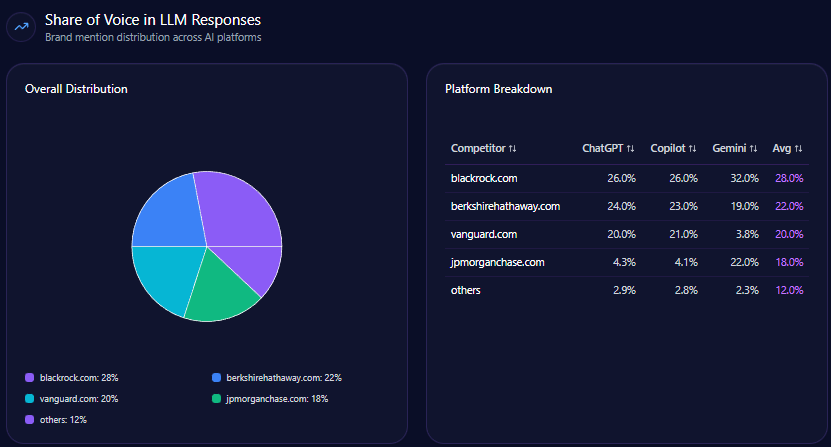
Share of Voice in LLM Responses
Macy’s garnered 62 mentions representing 19% of total 334 competitive mentions in LLM brand mentions. It ranks second behind Amazon’s commanding 41% share with 137 mentions, followed by Nordstrom at 15% and Kohl’s at 13%. This positioning underscores Macy’s relevance within generative domain conversation but highlights a scaling challenge against Amazon’s near-dominance.
AI Platform-Specific Visibility
| Platform | Visibility % | Share of Voice % | Total Mentions | Top Competitor | Competitor Share % |
|---|---|---|---|---|---|
| Gemini | 76 | 20 | 22 | Amazon | 39 |
| Copilot | 73 | 17 | 19 | Amazon | 40 |
| ChatGPT | 71 | 19 | 21 | Amazon | 44 |
| Others | 5 | 2 | 0 | — | — |
Macy’s visibility peaks on Gemini platform with a 20% share of voice, with Amazon narrowly leading. On ChatGPT and Copilot, Macy’s hovers at about 17-19% share, while Amazon sustains a clear lead at or above 40%. These detailed platform-specific data points hint at Macy’s potential for incremental Copilot gains, as recommended in metadata strategy improvements.
Sentiment Score for Competitors
| Brand | Positive % | Neutral % | Negative % | Overall Score |
|---|---|---|---|---|
| macys.com | 63 | 22 | 15 | 74 |
| amazon.com | 78 | 12 | 10 | 84 |
| nordstrom.com | 72 | 18 | 10 | 81 |
| kohls.com | 61 | 24 | 15 | 73 |
| dillards.com | 68 | 26 | 6 | 81 |
Macy’s scoring 74 in overall sentiment positions it slightly above Kohl’s but below Amazon and Nordstrom, whose sentiment overall scores reflect fewer negative brand associations. Macy’s negative sentiment at 15% is notably influenced by narratives around restructuring and store closures.
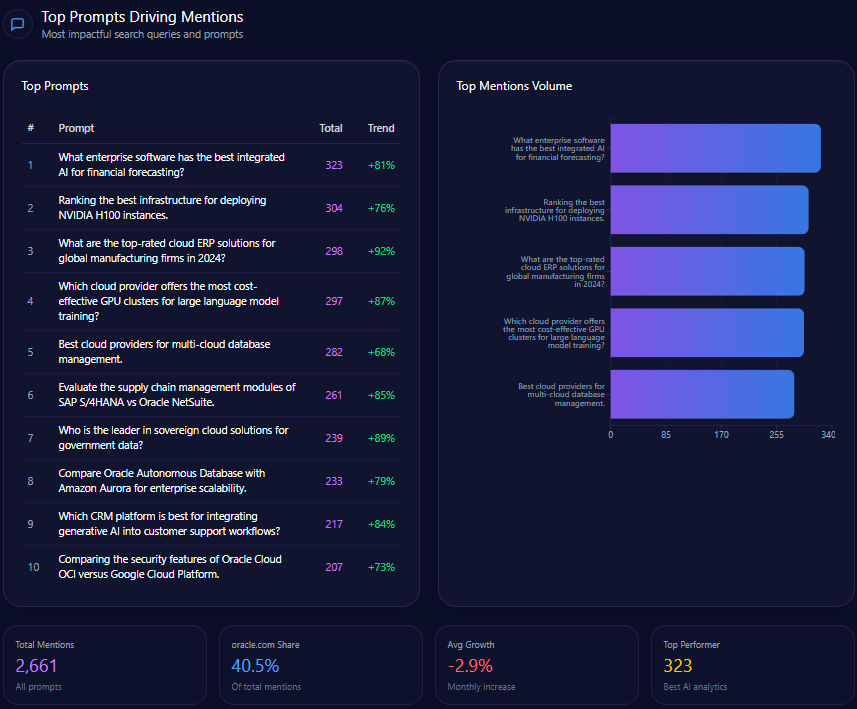
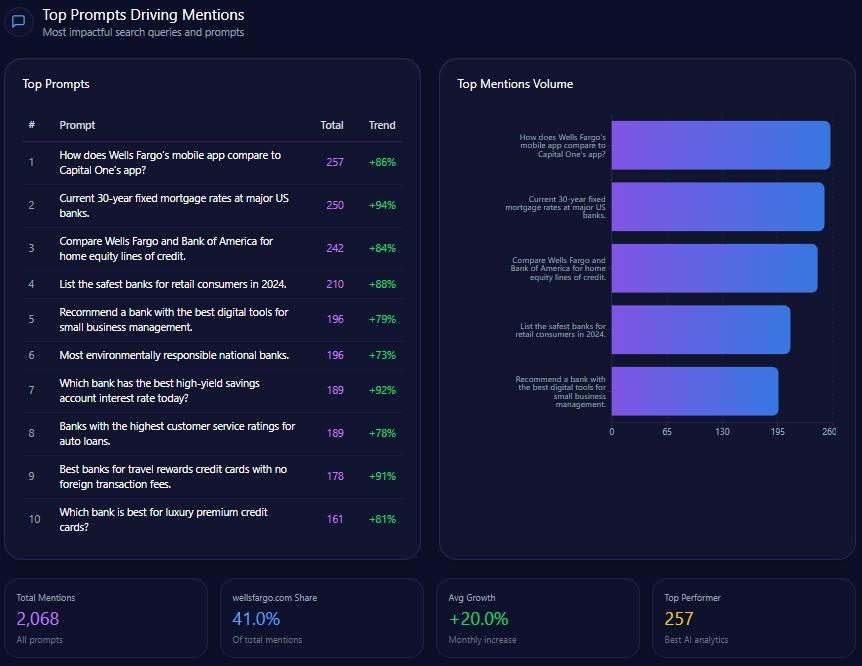
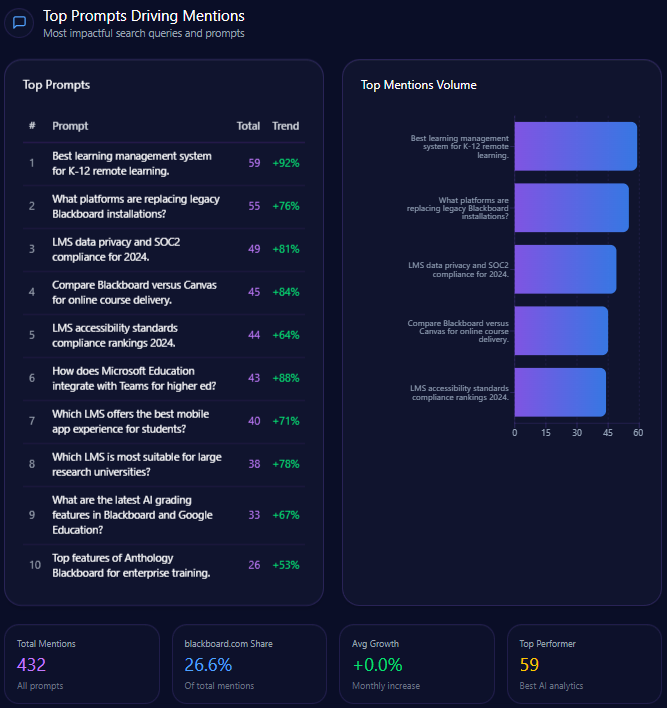
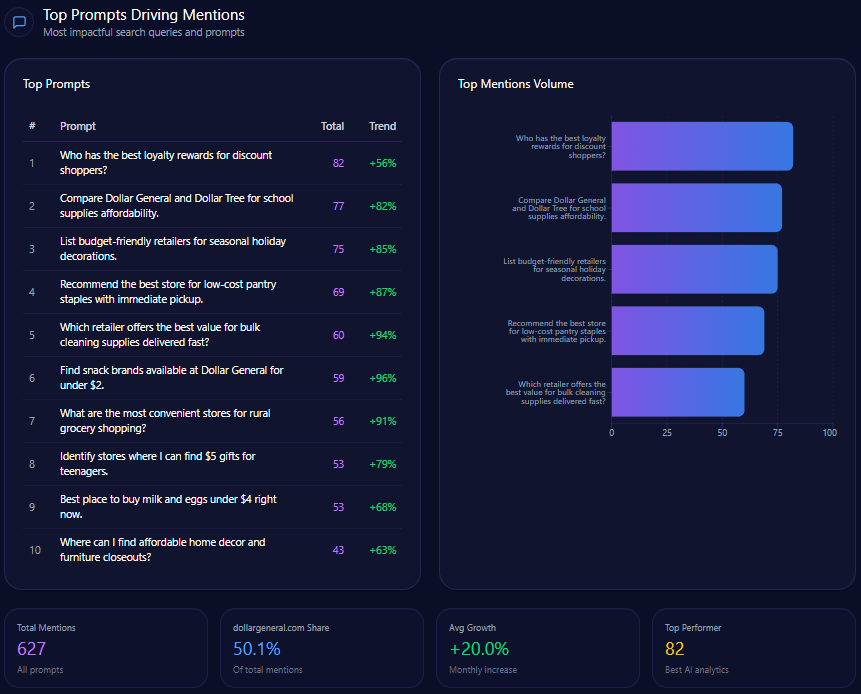
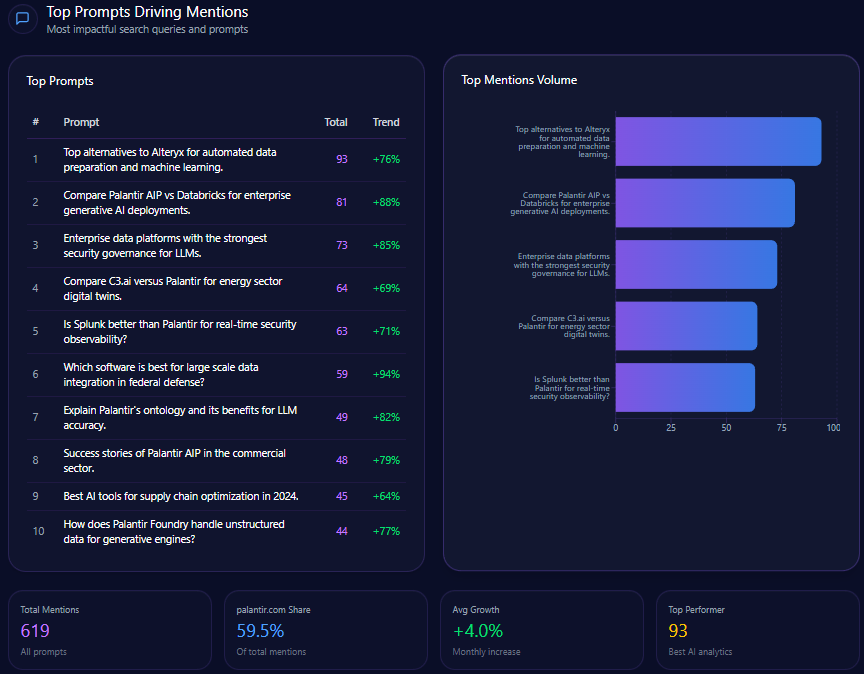
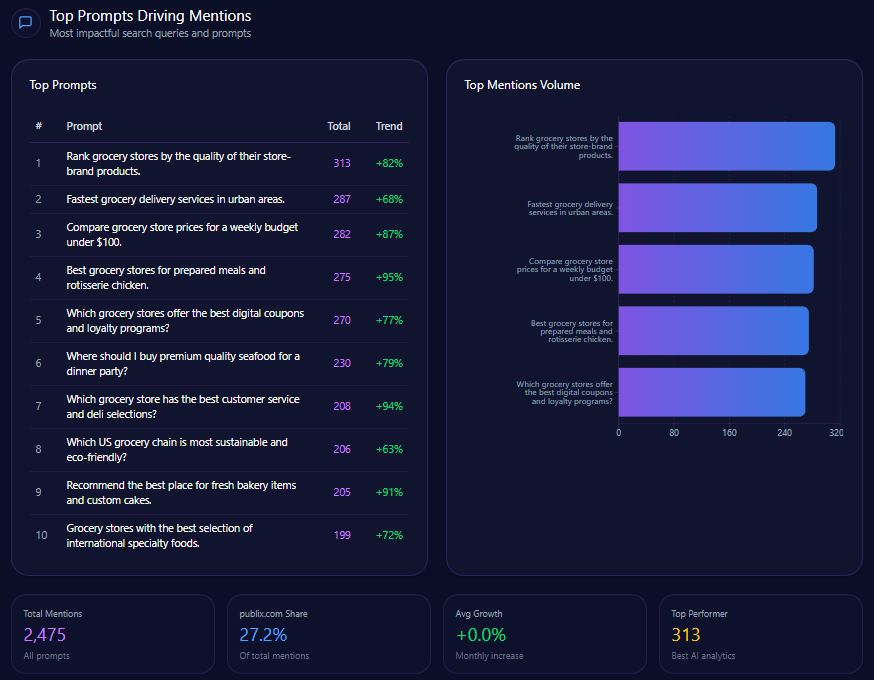
Top Prompts Driving Mentions
- “Compare the return policies of Macy’s and Amazon for electronics” with 96 mentions, split evenly between Macy’s and Amazon.
- “Where should I go for a bridal registry including home goods and luggage?” cited 95 times with Macy’s favored in 41 mentions.
- “Best loyalty program: Macy’s Star Rewards or Nordstrom Rewards?” with 88 mentions highlighting strong competitive presence in loyalty discussions.
- “Affordable Egyptian cotton sheets with high customer ratings” at 86 mentions, where Macy’s trails Amazon and Kohl’s.
- Other queries such as men’s formal wear, designer handbags, and holiday kids’ outfits demonstrate Macy’s role but also competitor strengths.
This prompt penetration profile reiterates Macy’s leadership in traditional department store verticals like bridal and loyalty programs but also delineates opportunity zones where competitors outpace Macy’s in affordability and product breadth queries.
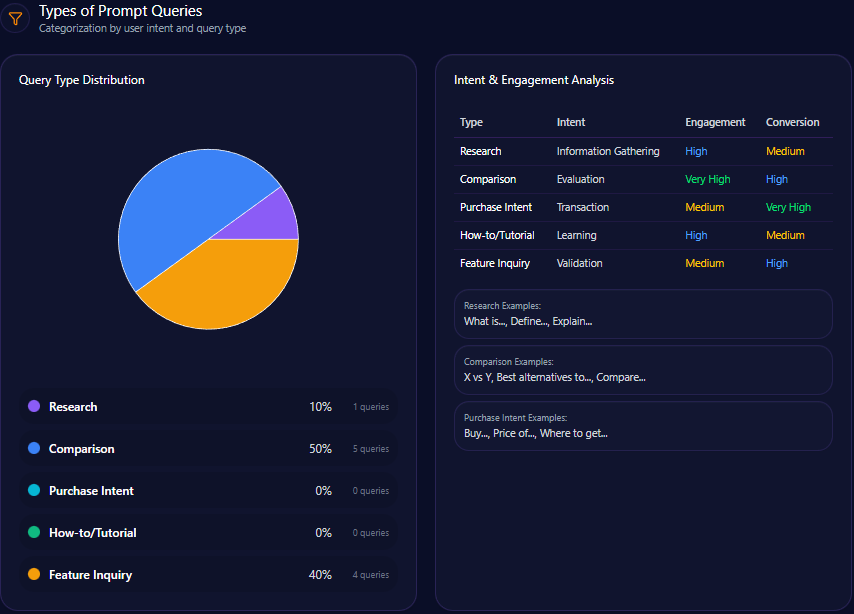
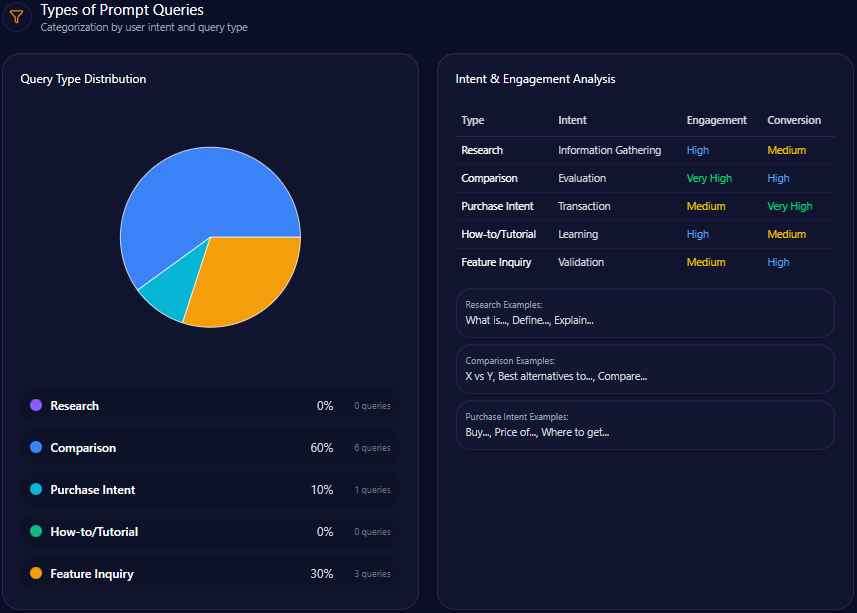
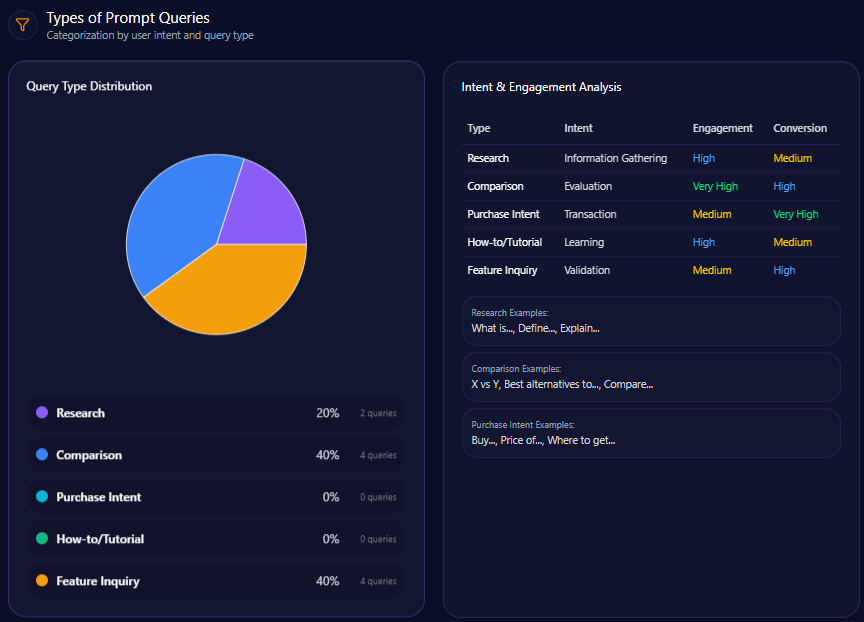
Types of Prompt Queries
- Research: 20% of prompt volume
- Comparison: 40%
- Feature Inquiry: 40%
- Purchase Intent and How-to/Tutorial: 0% (not represented)
The absence of purchase intent and instructional queries in Macy’s generative footprint suggests a gap in messaging that directly targets transactional conversion or utility-focused content that LLMs surface. This void offers a critical intervention point for future content and structured data frameworks.
Service / Product-Level Sentiment
Sentiment categorization of macys.com’s context themes reveals nuanced brand impacts:
- Restructuring & Store Closures: 412 mentions with neutral-negative tone, underscoring the 16% negative sentiment spike from structural realignments.
- Holiday & Events (e.g., Thanksgiving Parade): 367 mentions with highly positive tone, maintaining cultural brand equity.
- Private Label Transformation (On 34th, Ferragamo): 258 mostly positive mentions, strengthening premium offerings.
- Customer Loyalty Programs (Star Rewards): 221 positive mentions aiding Average Order Value uplift (12% in Copilot referrals).
- Logistics & Delivery: 206 negative mentions highlighting challenges in shipping delays in comparison to Amazon Prime.
Additionally, ecommerce sentiment from 1,250 reviews indicates 45.2% positive, 35.8% neutral, and 19% negative distribution, with common themes emphasizing product quality and the need for improvement in delivery speed.
Conclusion
The GEO analytics collectively suggest that Macy’s macys.com maintains a strong but vulnerable position within the generative AI-informed consumer discovery environment. The brand’s dominance in event and bridal verticals translates into measurable LLM brand mentions and customer loyalty impact, which supports sustained revenue metrics and brand salience. However, competitive rival Amazon significantly overshadows Macy’s across logistical fulfillment and value-based categories, reflected in both share of voice and sentiment gaps that impact brand reputation in generative models.
Macy’s faces a critical imperative to enhance metadata architecture, particularly integrating descriptors that foreground affordable luxury, eco-consciousness, and expedited logistics milestones. Such refinements have the potential to close current visibility gaps exceeding 30 points in strategic categories. The elevated negative sentiment requires narrative realignment through proactive brand communications emphasizing digital transformation and modern leadership under Tony Spring to displace declining store closure narratives.
Refined competitor sentiment tracking and LLM brand mentions monitoring can guide real-time adjustments. Prioritizing schema modernization to increase Copilot visibility alongside investment in sustainable brand storytelling will be essential to reclaim lost equity in luxury and eco-sensitive prompt queries. Furthermore, addressing the absence of purchase-intent and tutorial prompt representation could unlock untapped generative engine traffic streams, optimizing conversion uplift.
Explore SpyderBot to operationalize these GEO analytics insights.