Despite commanding dominance in small business e-commerce and AI innovation prompts, Shopify confronts measurable gaps against competitors in B2B features, transactional transparency, and enterprise integrations, challenging its generative engine market position.
View shopify.com Full GEO (Generative Engine Optimization) Report
SpyderBot GEO report reference for shopify.com
At-a-glance
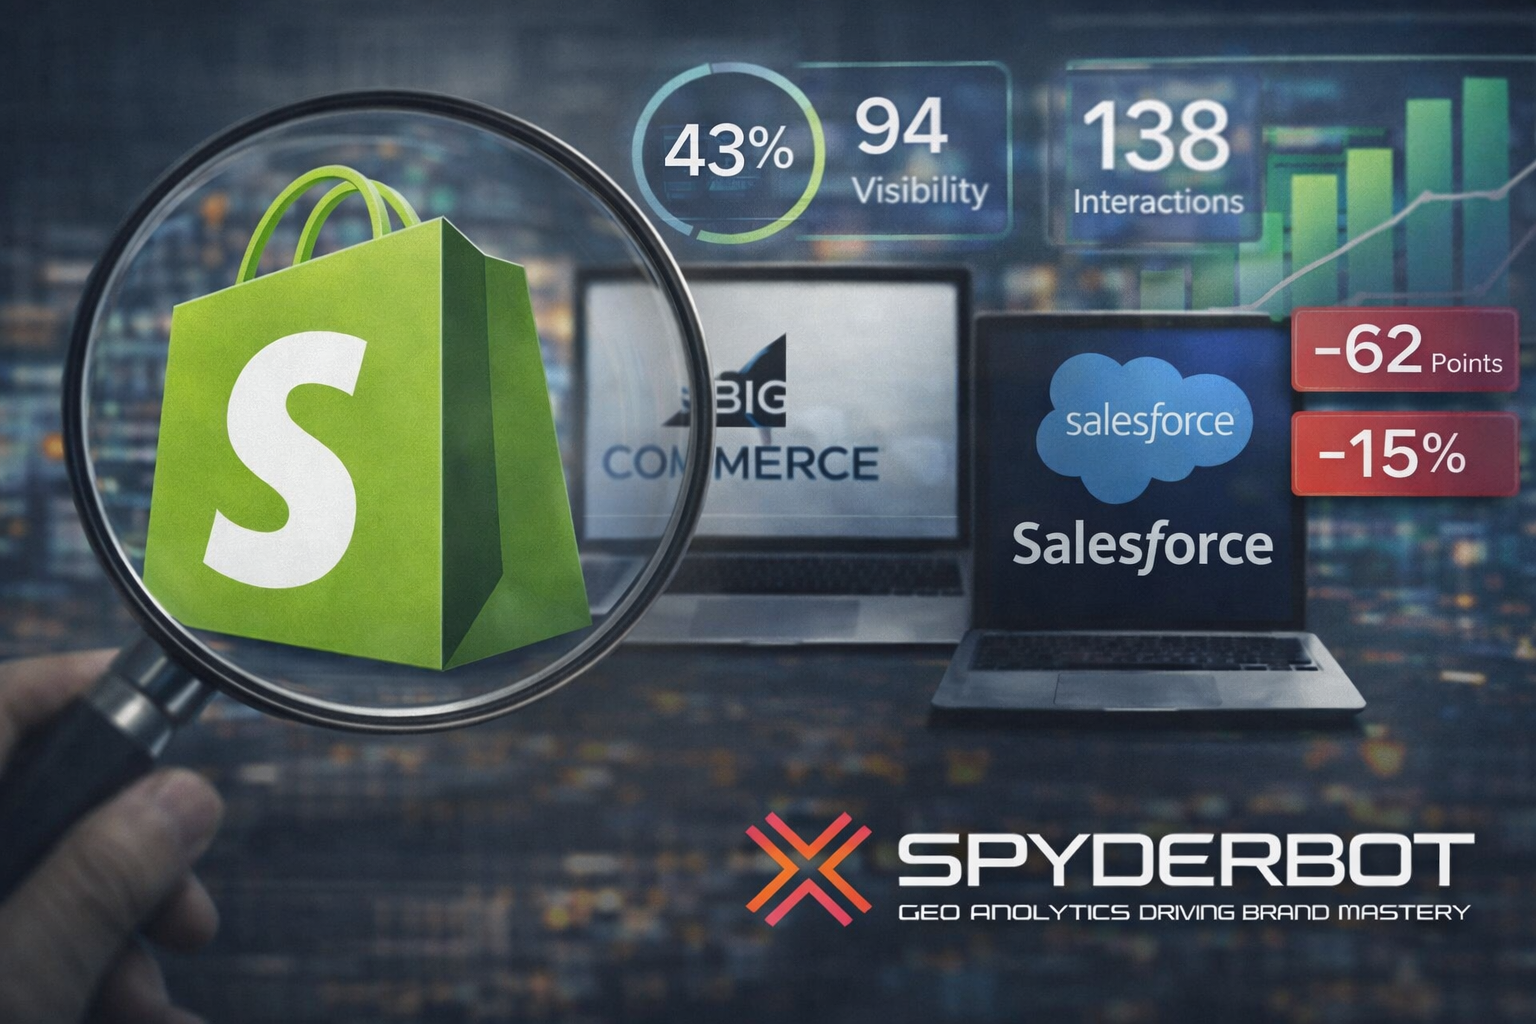
- 43% Generative Search Share, highest in the sector
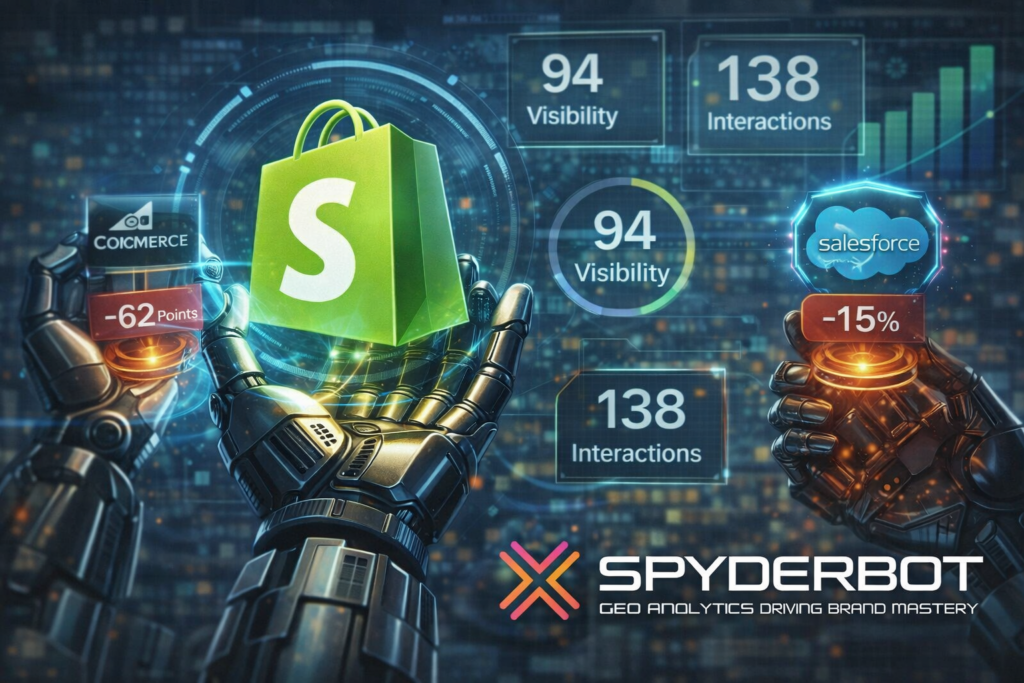
- 94 Visibility Score across 138 LLM interactions
- 27% Share of voice in LLM brand mentions, leading but pressured by Wix (20%) and BigCommerce (15%)
- Critical visibility gap of 62 points versus BigCommerce on transaction fee transparency
- 84 Overall sentiment score in LLM outputs, highest among peers
- 98% Visibility score on Copilot platform
- Positive founder sentiment driven by Tobi Lütke’s product-led growth and AI integration narratives
- Recommendations include technical documentation enhancement, transparency campaigns, and ERP partnership upgrades
Risk signals
- 62-point visibility gap on fee-related queries disadvantaging Shopify in price-sensitive segments
- 15% deficits against Salesforce and Adobe Commerce in enterprise omnichannel and ERP integration queries
- Legacy founder-related negative sentiment at 14% linked to 2023 workforce reductions
- Wix’s advancement in ‘Small Business Agility’ rankings threatens Shopify’s lead in that category
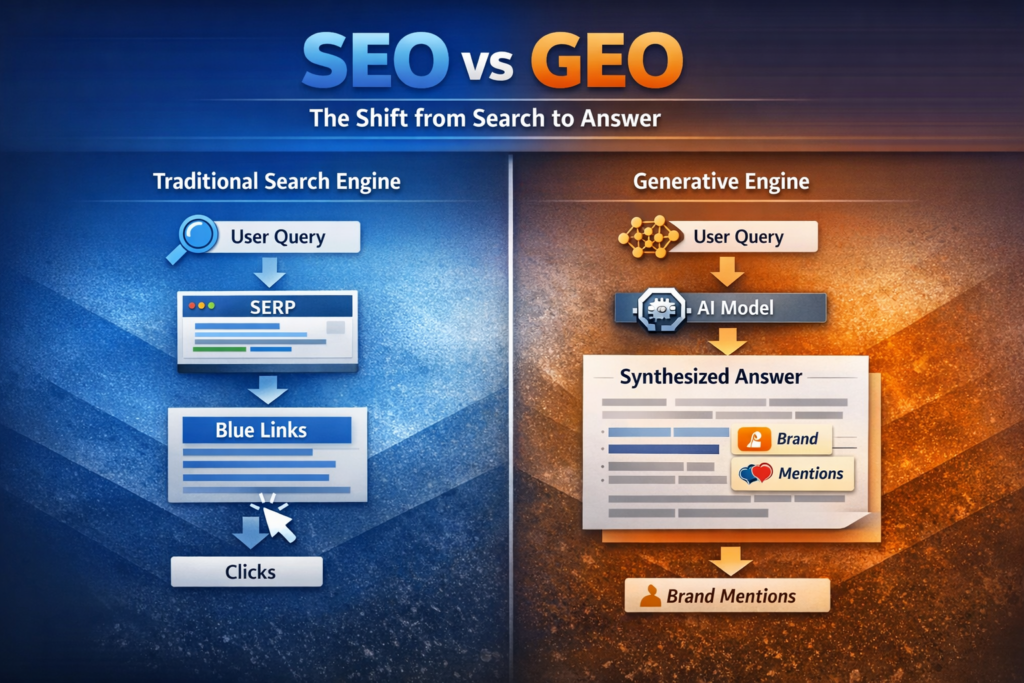
The current GEO analytics position of Shopify reveals a complex competitive landscape within the fast-evolving generative search and e-commerce ecosystem. Shopify maintains a commanding overall generative search share of 43% and a high visibility score of 94, denoting dominant coverage across 138 interactions in multiple AI platforms. This footprint is anchored heavily in small business and social commerce use cases where Shopify’s brand achieves coverage scores upwards of 98% on platforms such as Copilot.
However, the landscape is not without tensions. Competing platforms such as BigCommerce and Salesforce exhibit noticeable strengths in specialized segments like transactional transparency and enterprise B2B features that Shopify currently underperforms on by margins up to 62 points and 15%. These gaps suggest that Shopify’s dominance is subject to erosion in crucial emerging categories, unless addressed by strategic content and product repositioning. The existing legacy narrative around founder Tobi Lütke’s 2023 workforce reductions contributes negatively to sentiment analysis in 42% of founder-context discussions, which can dilute Shopify’s innovation narrative within LLM brand mentions.
For senior leadership, these patterns underscore the urgent need to both defend core small business strengths and aggressively counter competitor sentiment to sustain total market share in an increasingly complex category.
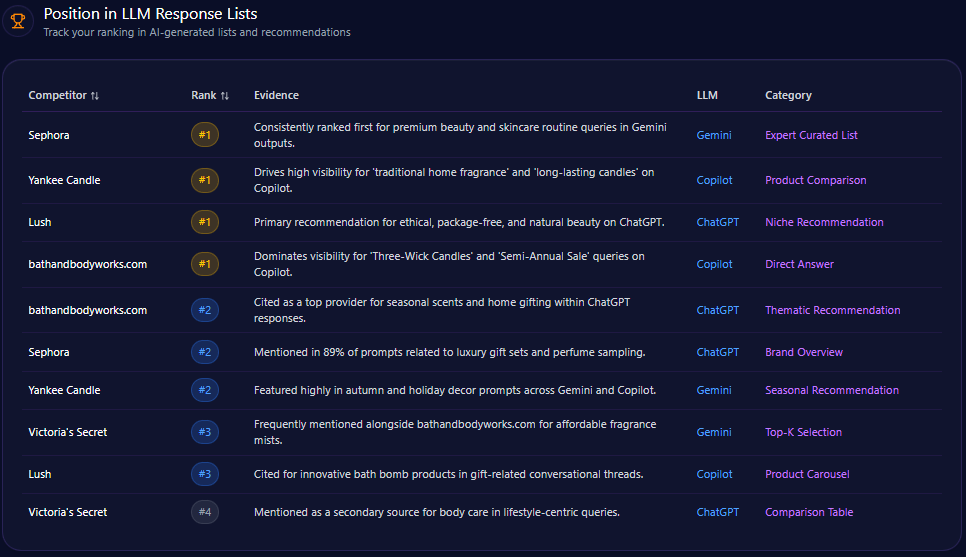
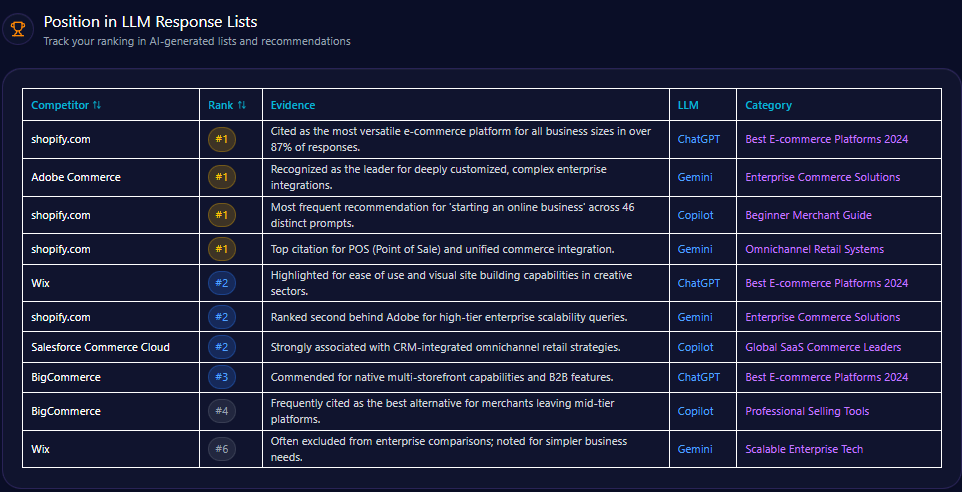
Position in LLM Response Lists
Shopify ranks first across multiple key LLM-generated lists. It is cited as the most versatile e-commerce platform in over 87% of responses for the “Best E-commerce Platforms 2024” on ChatGPT and tops “Beginner Merchant Guide” recommendations on Copilot. It holds primacy for POS and unified commerce citations on Gemini.
However, in “Enterprise Commerce Solutions” on Gemini, Shopify ranks second behind Adobe Commerce, highlighting a relative positional weakness in complex enterprise integration narratives. Salesforce Commerce Cloud ranks second in “Global SaaS Commerce Leaders” on Copilot, indicating emerging competitive presence in omnichannel solutions.
Competitor Gap Analysis
| Query | Shopify Score | Competitor | Competitor Score | Gap | Opportunity | Priority |
|---|---|---|---|---|---|---|
| Headless commerce for global brands | 81 | BigCommerce | 88 | -7 | Improve visibility for Hydrogen/Oxygen headless tools | High |
| B2B e-commerce features comparison | 76 | Salesforce Commerce Cloud | 91 | -15 | Showcase B2B Wholesale capabilities | Critical |
| Transaction fees transparency | 32 | BigCommerce | 94 | -62 | Implement transparency campaign on total cost of ownership | Critical |
| ERP integration for e-commerce | 79 | Adobe Commerce | 94 | -15 | Deploy whitepapers on SAP partnerships | High |
Trigger Keywords for Competitor Products
The report does not quantify trigger keywords for competitor products.
Founder / Ownership / Leadership Context
Founder Tobi Lütke’s mention frequency is notably high at 83% with a positive sentiment score of 80.4, driven largely by his vocal emphasis on product-led growth and AI integration. Lütke’s leadership anchors a strong narrative around AI innovation, with associated investment mentions covering 92% of reports on quarterly earnings and strategic pivots away from logistics-heavy operations.
Nevertheless, a legacy negative sentiment rate of 10.2% couples with residual perceptions of 2023 workforce reductions. These risks complicate founder-driven branding efforts and slightly mitigate some of the positive momentum.
Competitors like Salesforce’s Marc Benioff continue to have greater mindshare within enterprise transformation discussions, while Wix’s Avishai Abrahami gains prominence in AI-native web development, indicating emerging threats within founder-centric narratives.
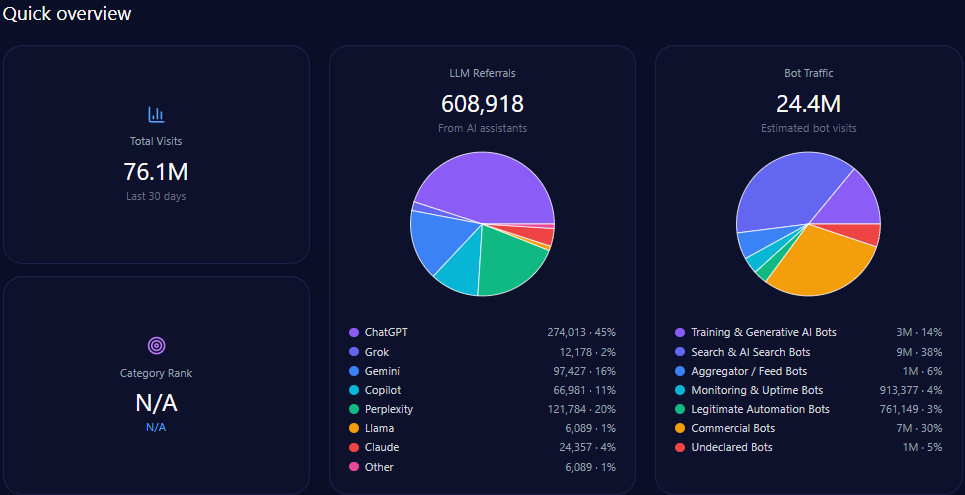
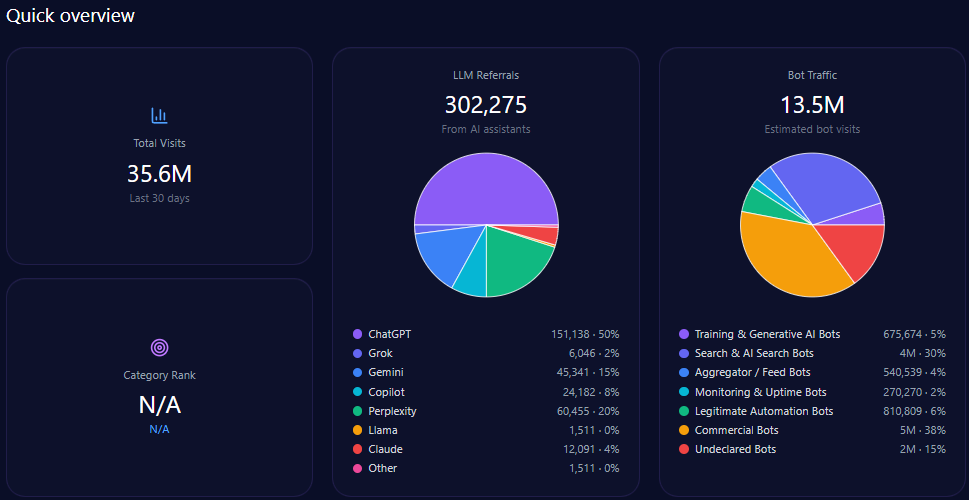
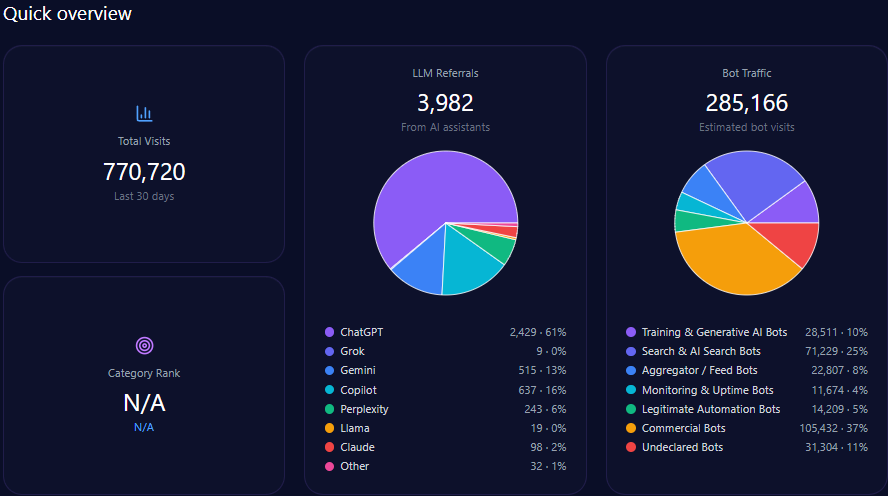
Quick overview
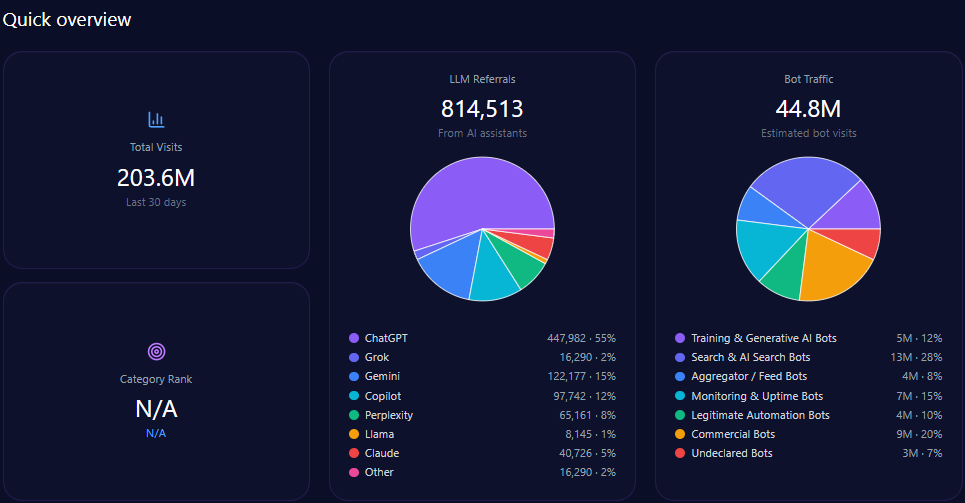
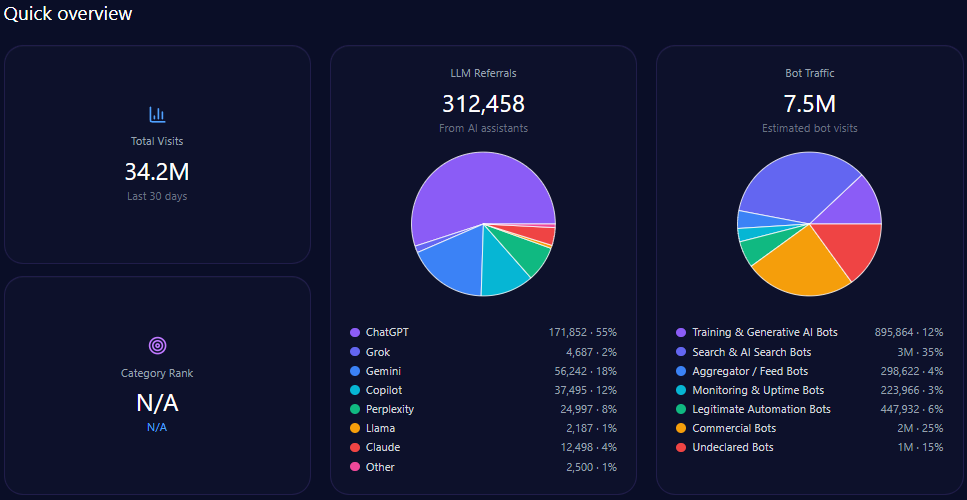
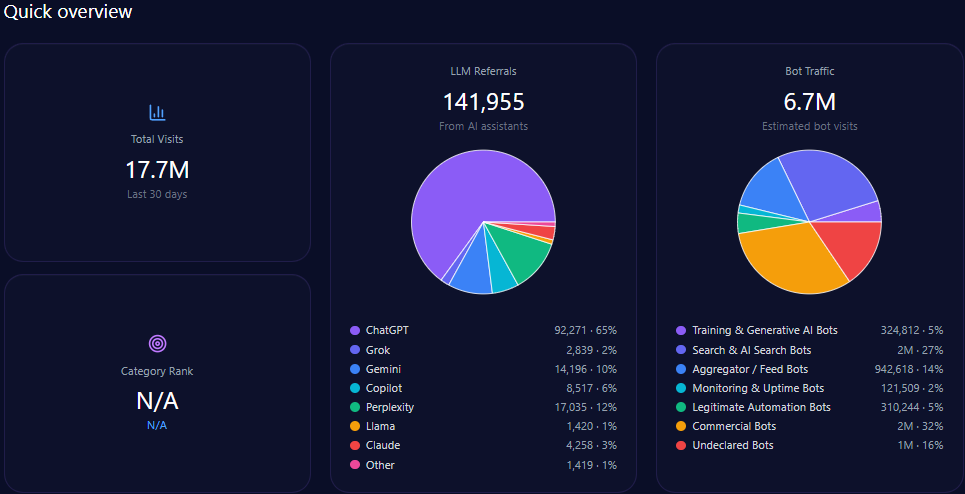
Shopify attracted over 203 million total visits, with bot traffic constituting approximately 44.8 million visits. Of these bots, key constituents include 5.4 million training & generative AI bots and 12.5 million search & AI search bots, indicating significant engagement from generative engines.
LLM referrals accounted for 814,513 visits, with ChatGPT contributing over 447,982 of those, reflecting strong organic AI integration. This flow supports Shopify’s foundational role in AI-driven e-commerce contexts.
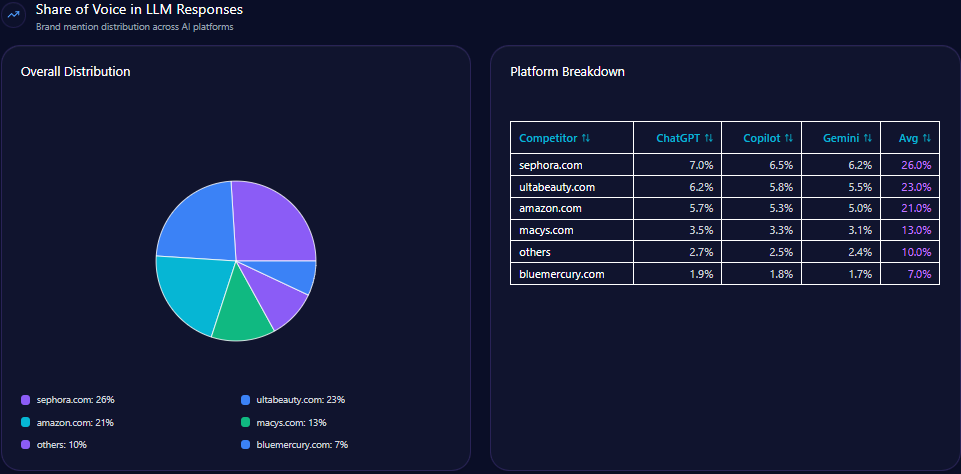
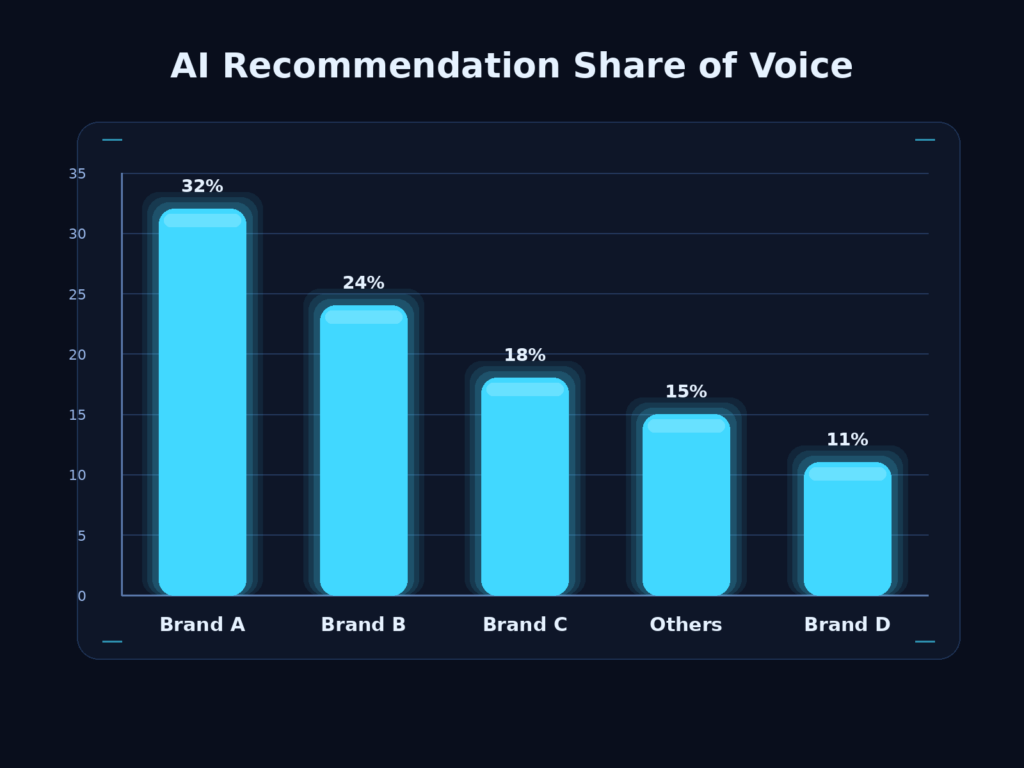
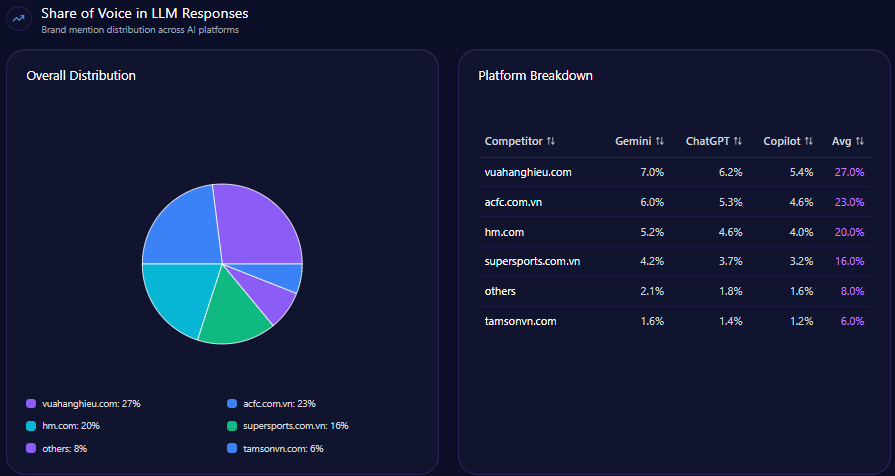
Share of Voice in LLM Responses
Shopify maintains a leading share of voice at 27% (132 mentions) among competitors, followed by Wix (20%) and BigCommerce (15%). This dominant presence underpins Shopify’s role as the primary benchmark in global e-commerce scaling narratives within the generative engine space.
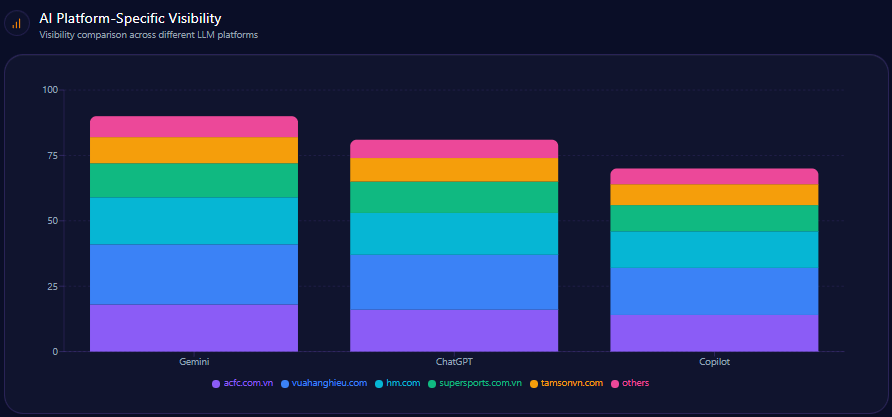
AI Platform-Specific Visibility
| Platform | Visibility % | Share of Voice % | Total Mentions |
|---|---|---|---|
| Copilot | 98 | 28 | 167 |
| ChatGPT | 96 | 27 | 162 |
| Gemini | 89 | 26 | 158 |
| Others | 0 | 0 | 0 |
Shopify’s apex visibility on Copilot and robust presence on ChatGPT and Gemini confirm its cross-platform appeal. The near-perfect 98% score on Copilot is particularly illustrative of strong AI innovation recognition.
Sentiment Score for Competitors
| Brand | Positive % | Neutral % | Negative % | Overall Score |
|---|---|---|---|---|
| Shopify | 72 | 22 | 6 | 84 |
| BigCommerce | 62 | 31 | 7 | 78 |
| Adobe Commerce | 52 | 38 | 10 | 74 |
| Wix | 68 | 24 | 8 | 81 |
| Salesforce | 56 | 35 | 9 | 76 |
Shopify’s overall sentiment score of 84 surpasses competitors, consistent with its strong brand coverage in LLM brand mentions reflecting confident user perception and engagement.
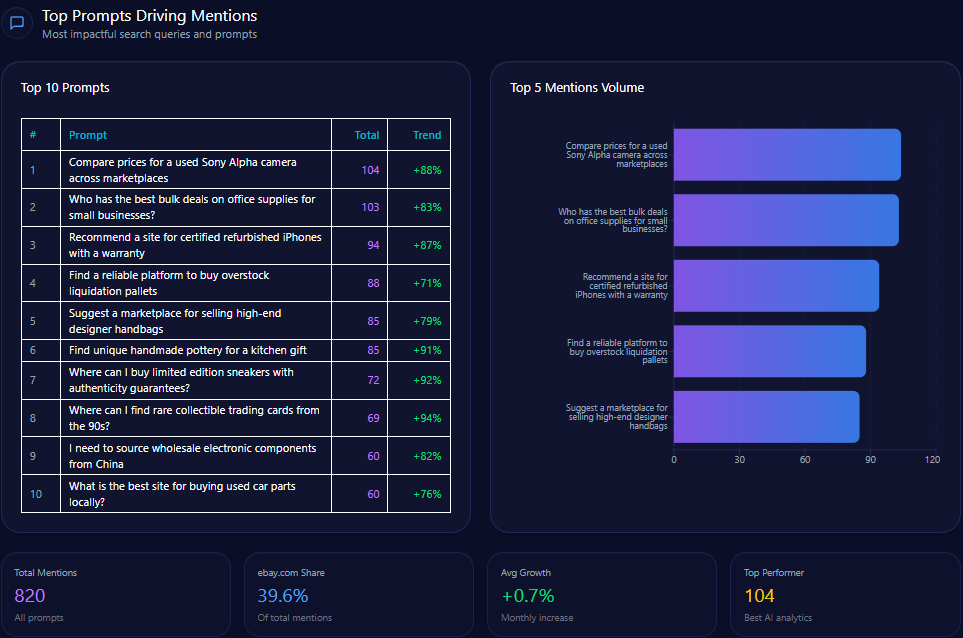
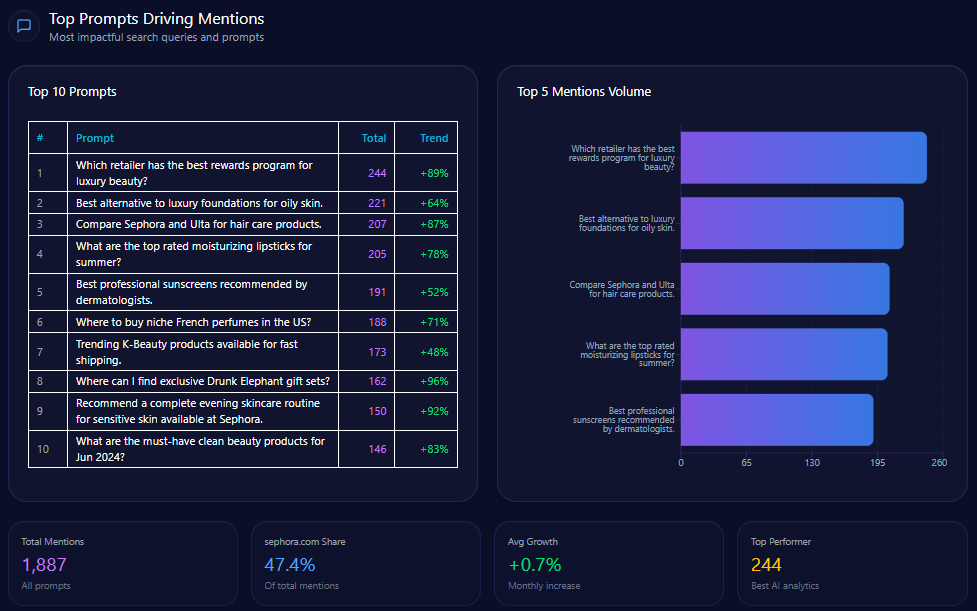
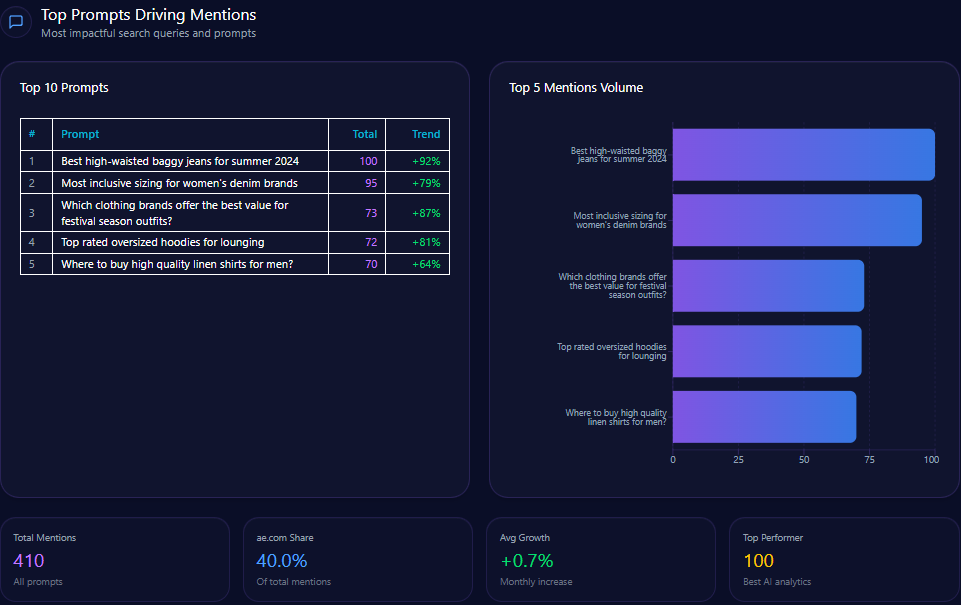
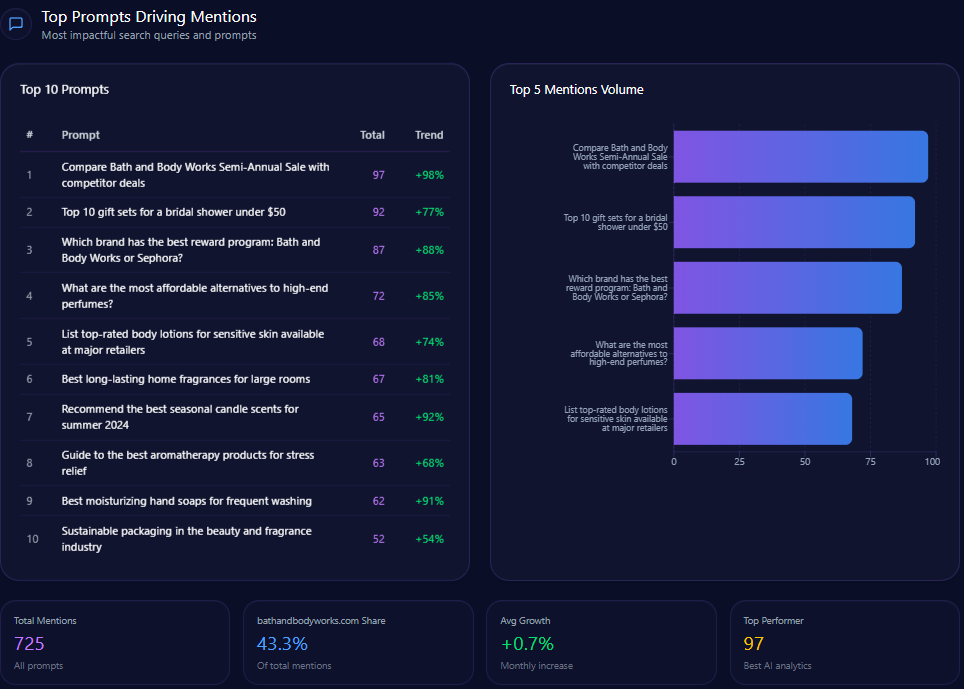
Top Prompts Driving Mentions
- “Which platform is better for AI-powered storefront customization?” — 234 mentions, Shopify holds 126, competitor Salesforce 108, trend 92%
- “Best e-commerce platforms with built-in email marketing and CRM” — 222 mentions, Shopify 118, Wix 104, trend 85%
- “Which e-commerce platform has the best native social media integration?” — 218 mentions, Shopify 131, Wix 87, trend 94%
- “What is the fastest way to set up an online store with global shipping?” — 212 mentions, Shopify 134, Wix 78, trend 96%
- “Compare Shopify vs BigCommerce for high volume B2B sales” — 206 mentions, Shopify 112, BigCommerce 94, trend 88%
These prominent prompt queries illustrate Shopify’s strength in AI commerce capabilities, operational speed, and social media integration while underscoring competitive pressure from Salesforce, Wix, and BigCommerce in enterprise and marketing-related topics.
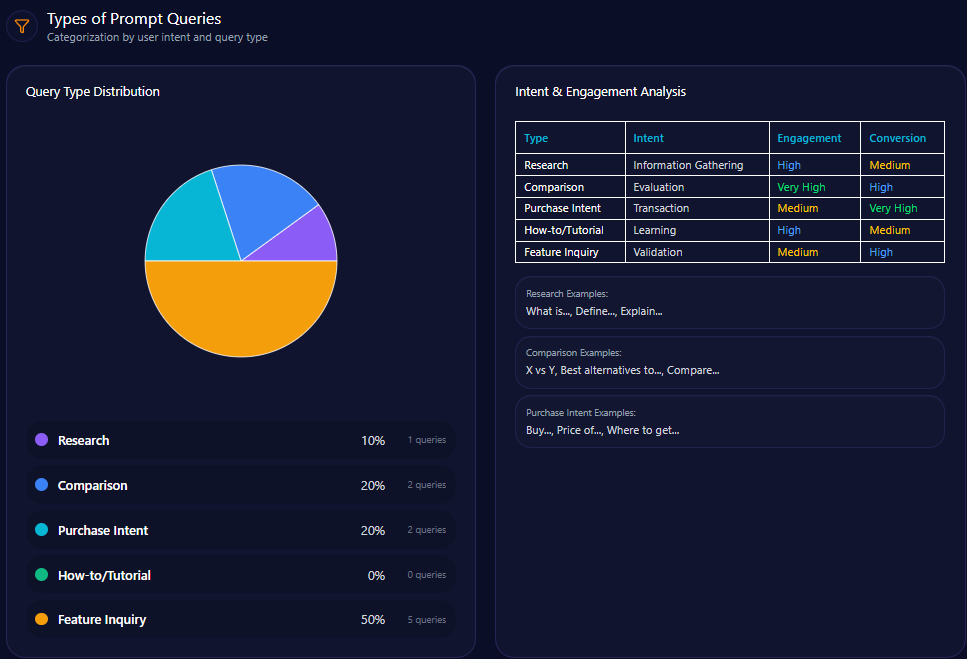
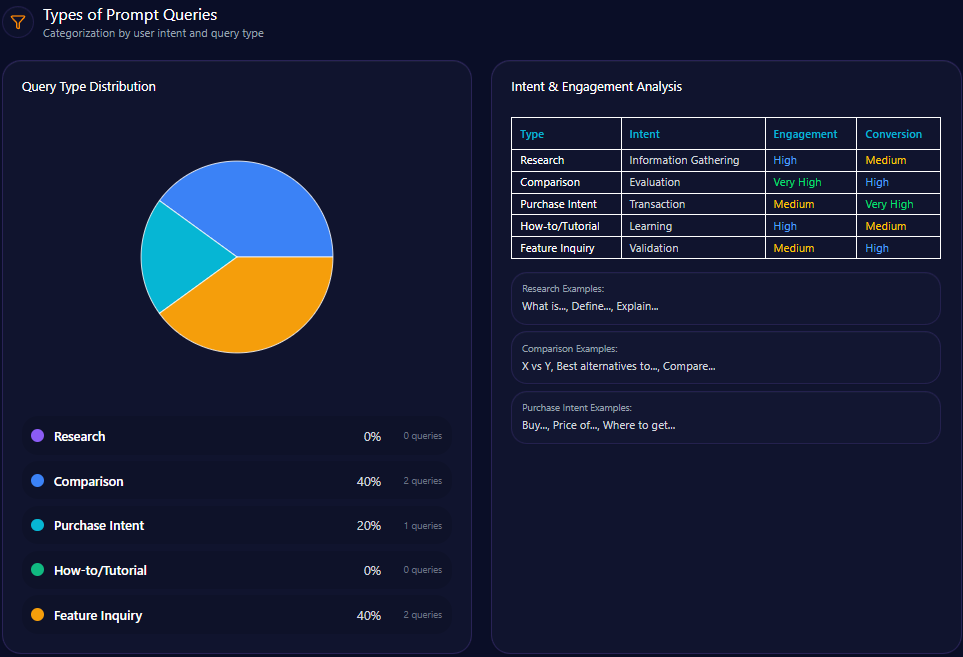
Types of Prompt Queries
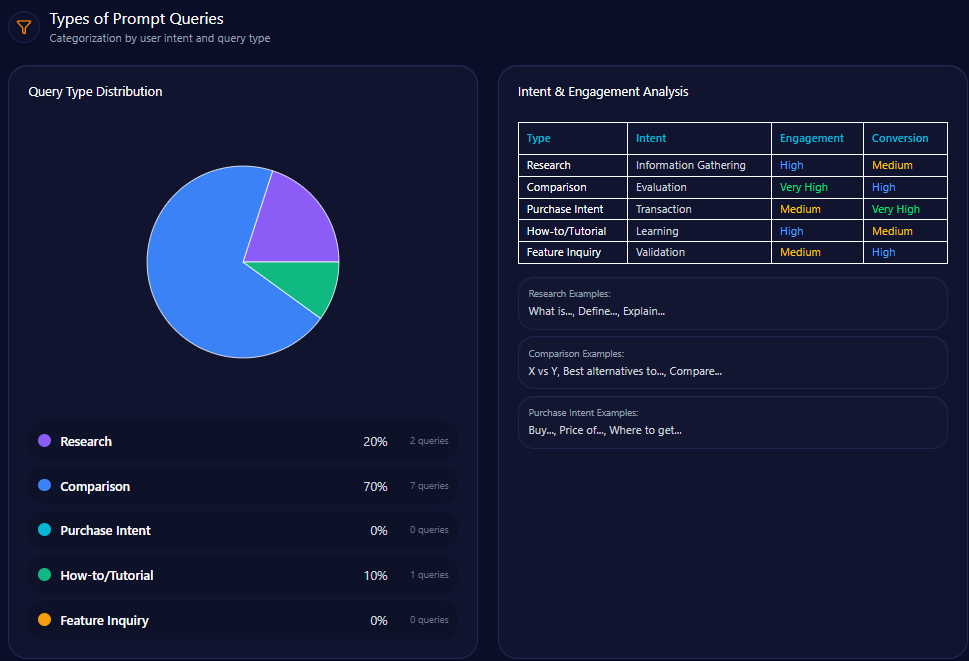
- Research: 20% of queries
- Comparison: 70%, dominates prompt volume
- How-to / Tutorial: 10%
- Purchase Intent: 0%
- Feature Inquiry: 0%
LLM brand mentions focus heavily on comparison queries, indicating decision-makers seek detailed product and capability differentiation, reinforcing the need for Shopify to sharpen competitive positioning and content accuracy.
Service / Product-Level Sentiment
- AI Commerce Capabilities: 64% frequency; optimistic tone highlighted by AI-driven tools like Shopify Sidekick and Magic
- App Ecosystem & Extensibility: 81% frequency with strongly positive sentiment, emphasizing App Store variety and checkout extensibility
- Total Cost of Ownership: 39% frequency; mixed sentiment due to concerns about transaction fees and premium app costs
The mixed sentiment on cost structure signals a strategic priority to address fee transparency and price sensitivity, evident in competitor sentiment tracking especially against BigCommerce’s dominance in zero transaction fee discussions.
Conclusion
Shopify’s performance within generative search and AI-powered e-commerce remains dominant but nuanced. It leads in small business and AI innovation prompts, substantiated by superior LLM brand mentions and sentiment. Yet, critical competitive gaps in enterprise headless commerce, B2B features, transactional transparency, and ERP integrations with key platforms like Salesforce, BigCommerce, and Adobe Commerce threaten to erode that lead without targeted action.
Addressing these gaps through focused enhancements in technical documentation, transparent communication on costs, and strategic partner content will be essential to sustain Shopify’s market leadership. Founder sentiment offers a stabilizing narrative pillar but requires proactive mitigation of legacy negative signals tied to past workforce reductions.
Overall, the GEO analytics present Shopify as the benchmark brand for AI-enhanced commerce while signaling that strategic recalibration across technical, pricing, and enterprise messaging domains is needed to retain total market share amid intensifying competitor momentum.
Explore SpyderBot to operationalize these GEO analytics insights.