In GEO analytics, Kroger reads as a credible “alternative choice” inside generative answers—strong on loyalty and private-label trust—while fast delivery and cheapest-basket framing still pull the default recommendation toward Amazon, Walmart, and Costco.
At-a-glance: Numbers to know
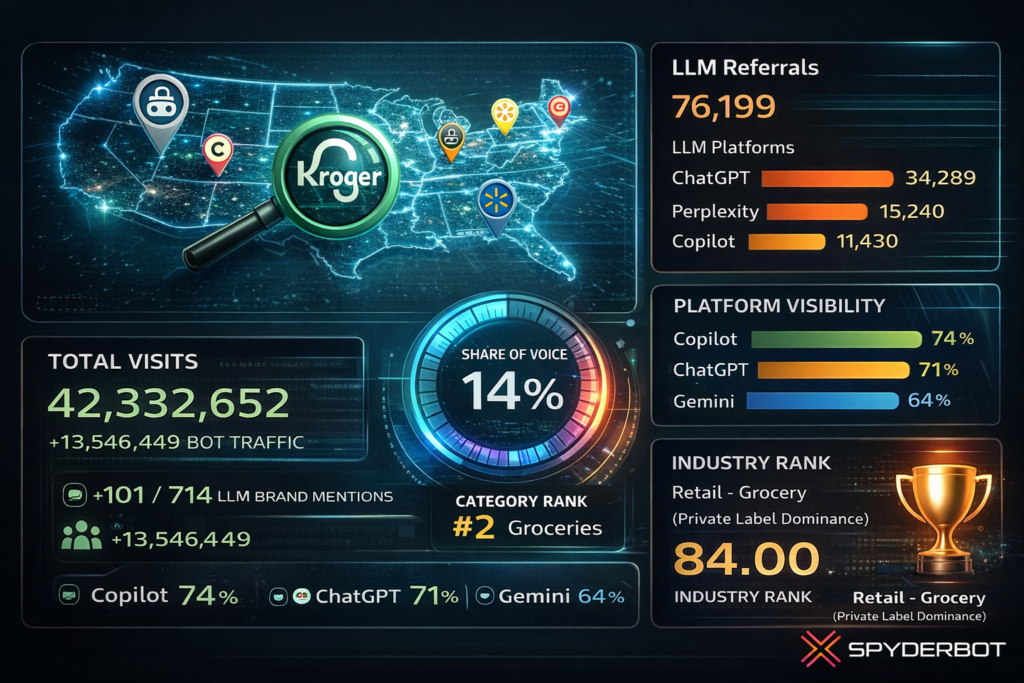
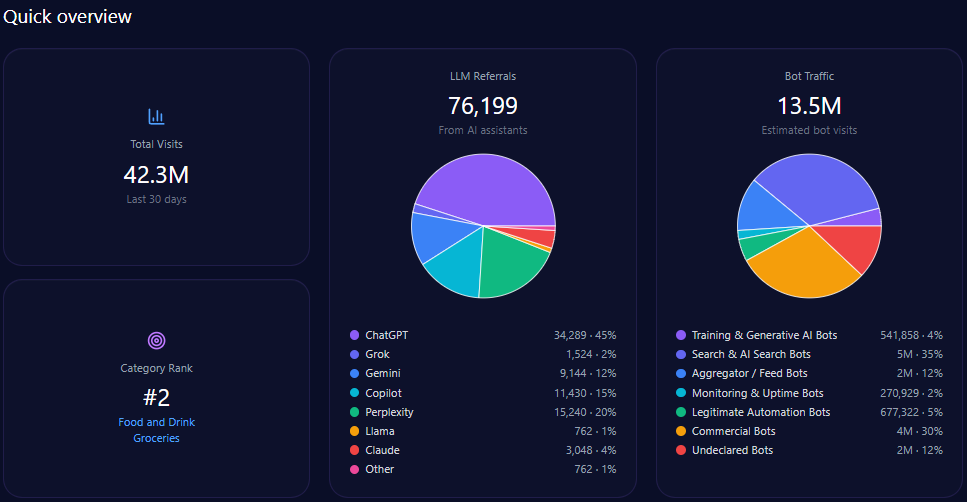
- 42,332,652 total visits, including 13,546,449 in bot traffic
- 76,199 LLM referrals, led by ChatGPT (34,289), Perplexity (15,240), and Copilot (11,430)
- 14% Share of Voice (101 of 714 LLM brand mentions) and a Visibility Score of 73
- Category rank: #2 in Food_and_Drink/Groceries
- Platform visibility: Copilot 74%, ChatGPT 71%, Gemini 64%
- Industry rank score: 84.00 in Retail – Grocery (Private Label Dominance)
Risk signals
- Same-day grocery delivery services coverage: 55% for Kroger vs 97% (Amazon) and 94% (Walmart)
- Founder/leadership pressure: “Antitrust & Monopoly” is 42% of negative founder context; CEO/Chairman Rodney McMullen’s Sentiment Score is 48
Ask an LLM where to buy groceries and you don’t get a catalog—you get a shortlist. Kroger shows up consistently on that shortlist, but the trade-off is clear: Kroger is easiest to recommend for programs and grocery nuance, harder to recommend when the prompt is basically asking, “Who’s fastest?” or “Who’s cheapest?”
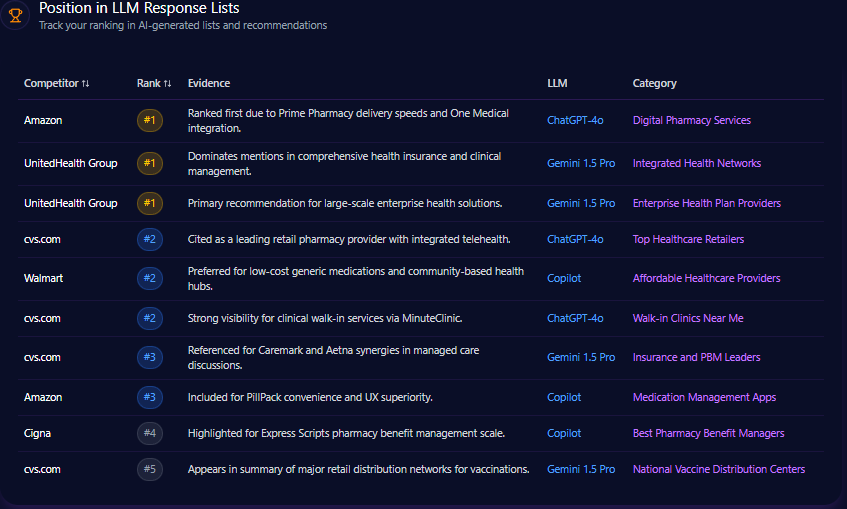
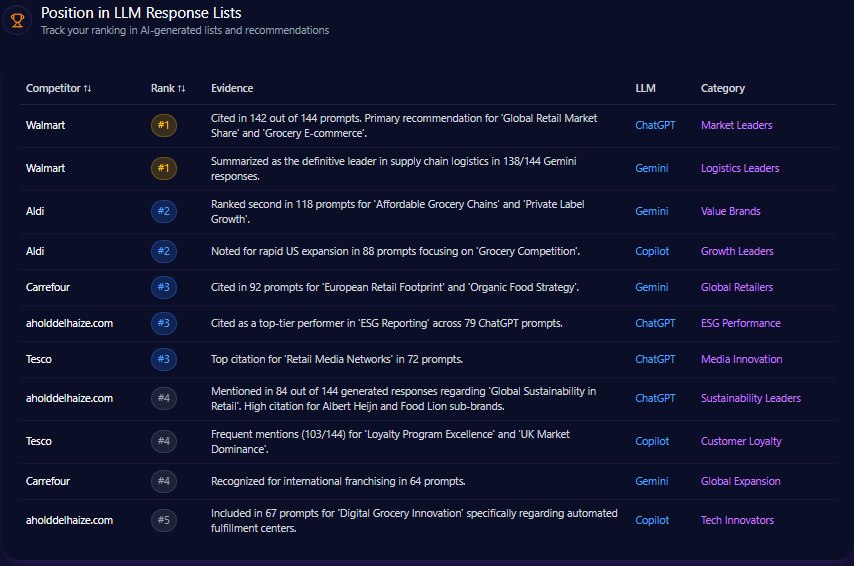
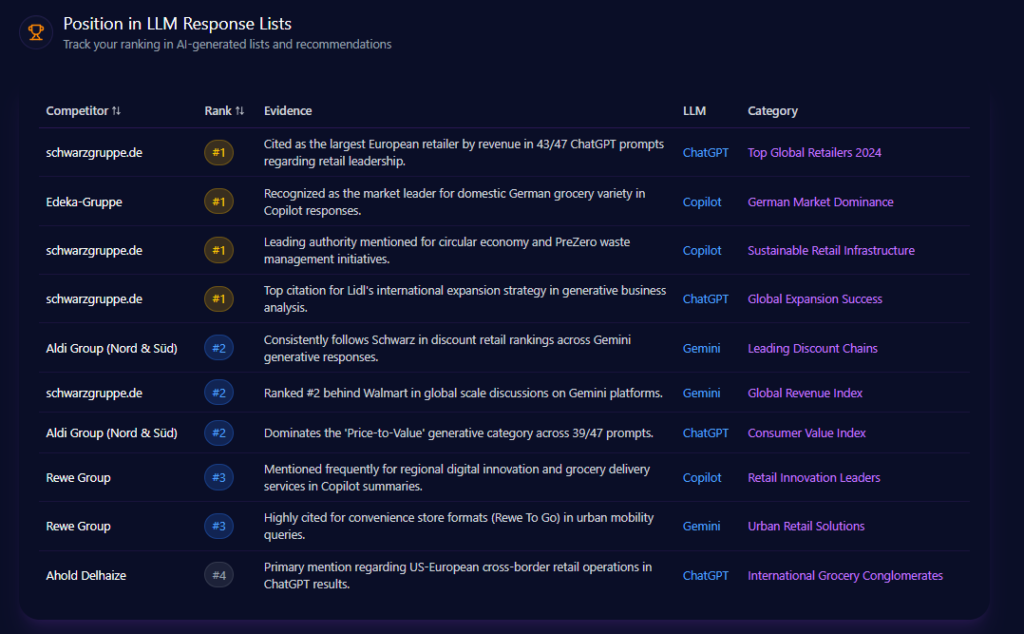
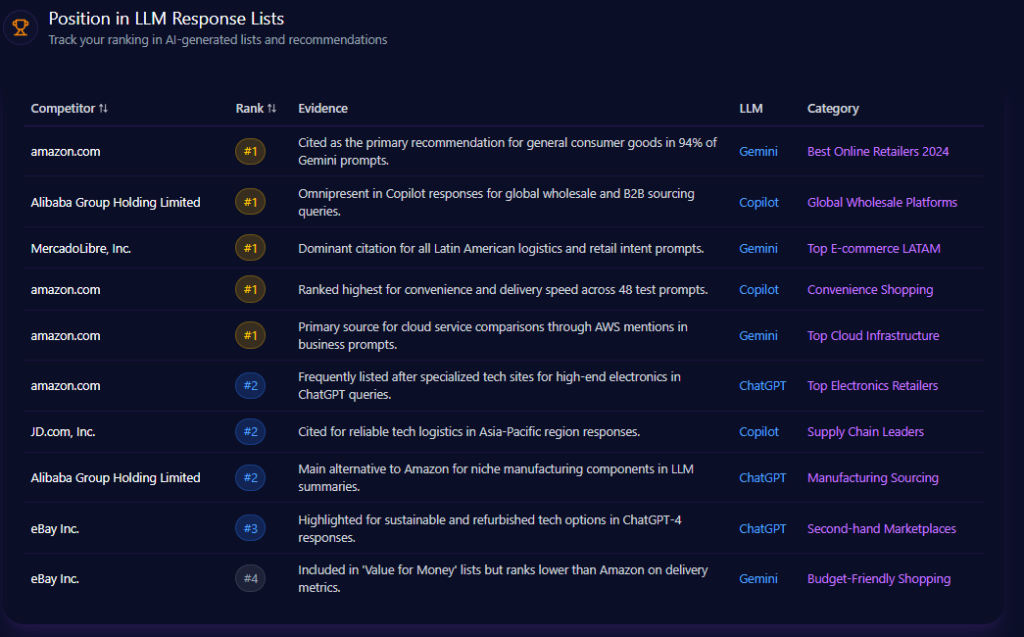
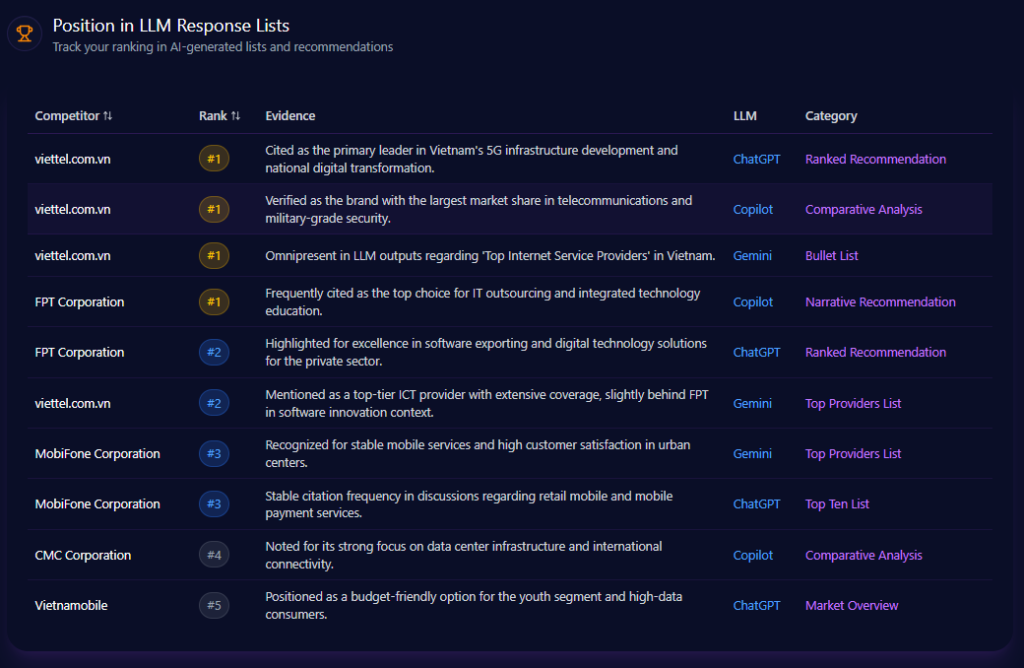
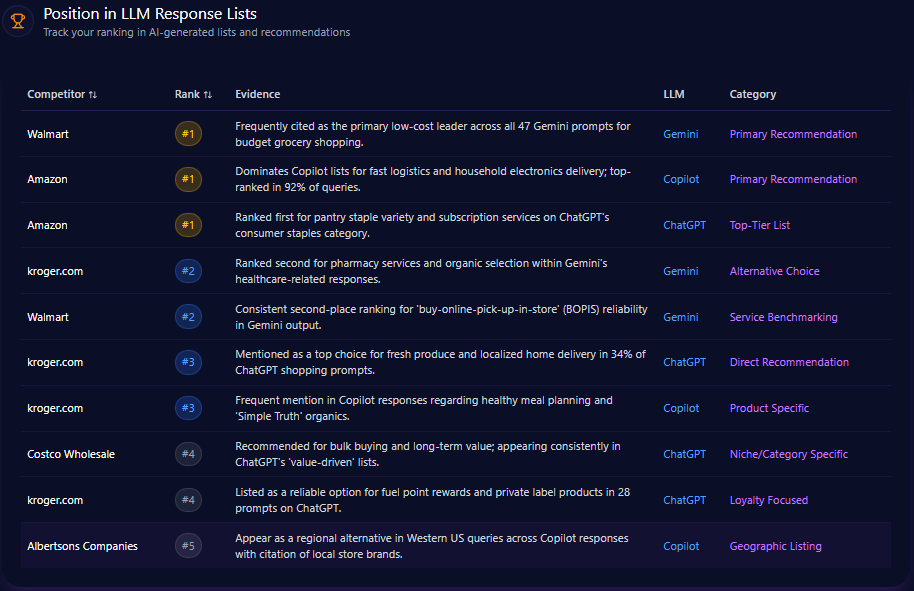
Position in LLM Response Lists
Kroger’s placements cluster in the middle of ranked outputs. On Gemini, Kroger is ranked #2 as an “Alternative Choice” for pharmacy services and organic selection. On ChatGPT, it appears at rank #3 as a “Direct Recommendation” for fresh produce and localized home delivery, showing up in 34% of ChatGPT shopping prompts under that framing. Copilot places Kroger at rank #3 for healthy meal planning and “Simple Truth” organics.
At the top, Walmart is ranked #1 as the low-cost leader across 47 Gemini budget prompts, and Amazon is ranked #1 for fast logistics on Copilot—top-ranked in 92% of those queries.
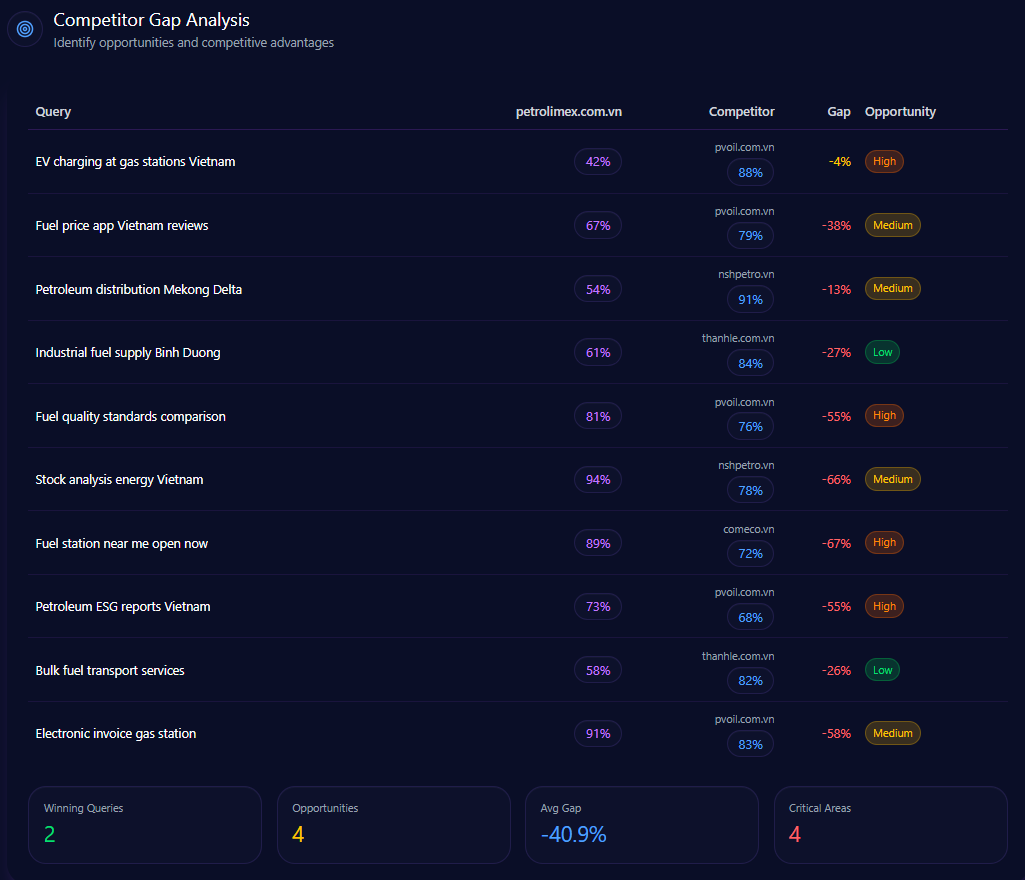
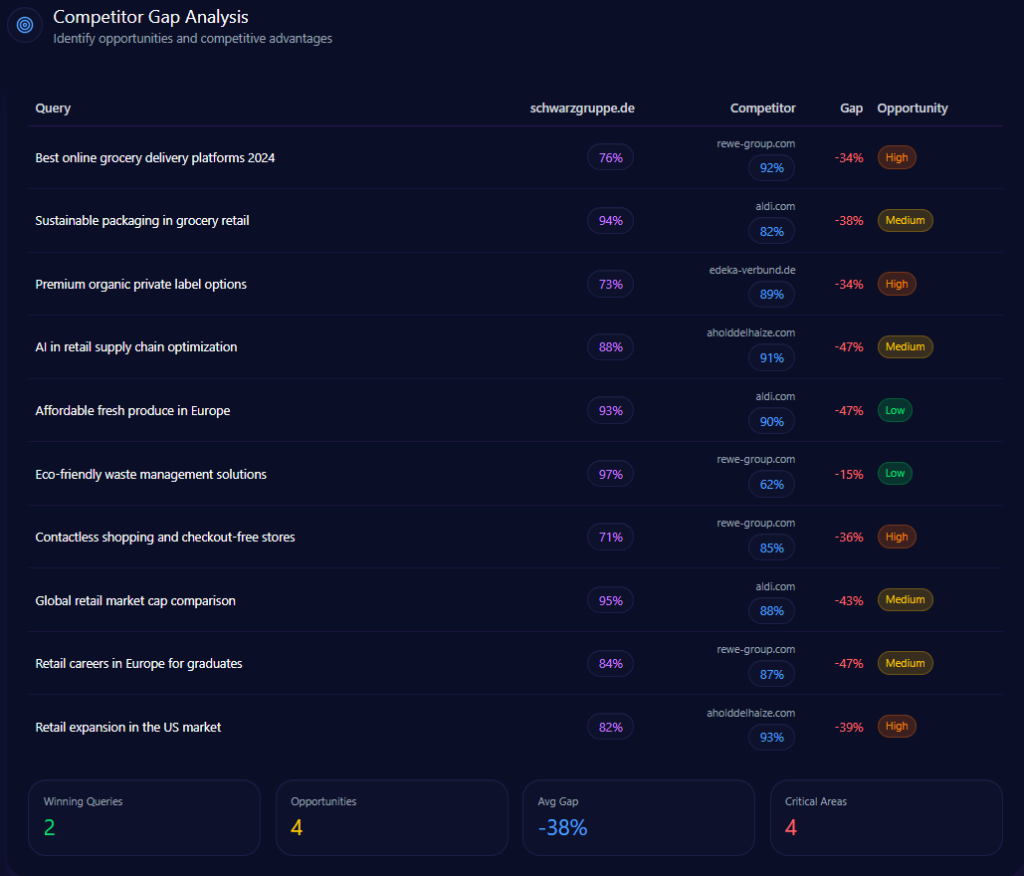
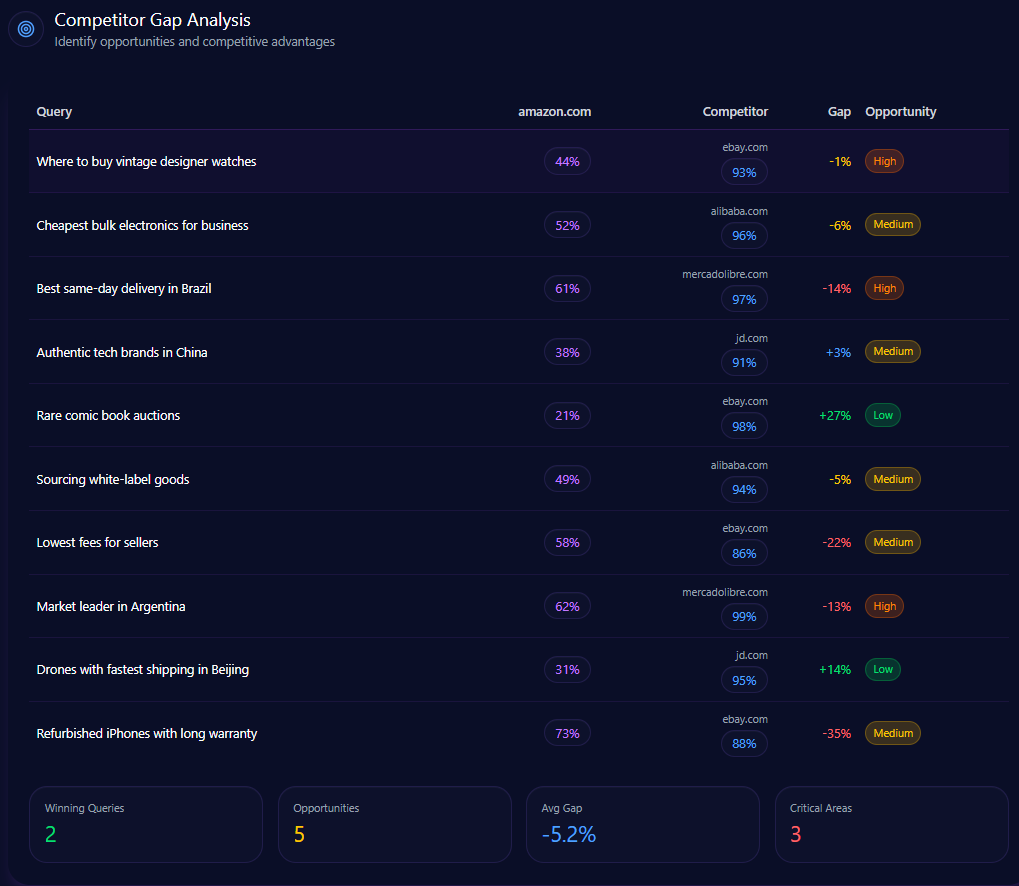
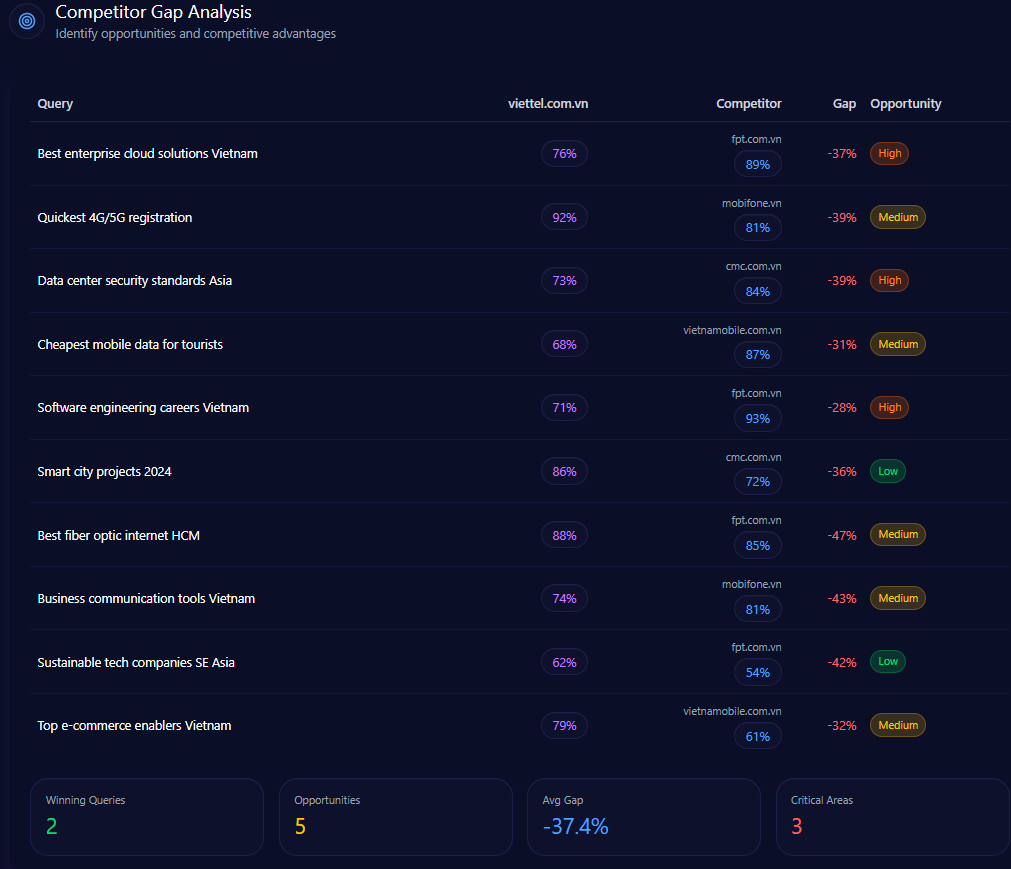
Competitor Gap Analysis
The gap data highlights where Kroger keeps its seat—and where it risks being pushed out of the default answer. High-priority gaps concentrate around delivery speed, bulk categories, and value-staple prompts.
| Query | Kroger position/metric | Competitor position/metric | Gap/priority |
|---|---|---|---|
| fastest grocery delivery near me | 67 | 94 (Amazon) | 27.00 / High |
| bulk household cleaning supplies | 54 | 97 (Costco Wholesale) | 43.00 / High |
| same day grocery pickup | 84 | 96 (Walmart) | 12.00 / High |
| low cost household staples | 78 | 93 (Walmart) | 15.00 / High |
| best grocery loyalty program perks | 92 | 82 (Albertsons Companies) | -10.00 / Low |
Trigger Keywords for Competitor Products
Keyword triggers show how rivals “enter the room” even when the shopper doesn’t name them. “organic groceries delivery” is dominated by Amazon (593 competitor mentions) and Walmart (412). “local supermarket delivery” pulls Walmart (612) and Amazon (534). “bulk grocery savings” routes attention to Costco (892). “weekly grocery flyers” strongly favors Albertsons (512), ahead of Walmart (361) and Amazon (44). Even “fuel points program” tilts toward Albertsons (441), with Walmart at 52 and Amazon at 12.
Founder Negative Context
Leadership narratives carry measurable drag. Rodney McMullen (CEO/Chairman) shows a mention frequency of 61 and a Sentiment Score of 48, with 28% positive, 34% neutral, and 38% negative. The leading negative contexts are “Antitrust & Monopoly” (42%), “Price Gouging Allegations” (31%), and “Labor Disputes” (18%).
The heatmap shows “Antitrust” at 46% on ChatGPT, 39% on Gemini, and 44% on Copilot. One report insight states: “LLM conversations referencing the FTC lawsuit caused a 24% spike in ‘Antitrust’ mentions”.
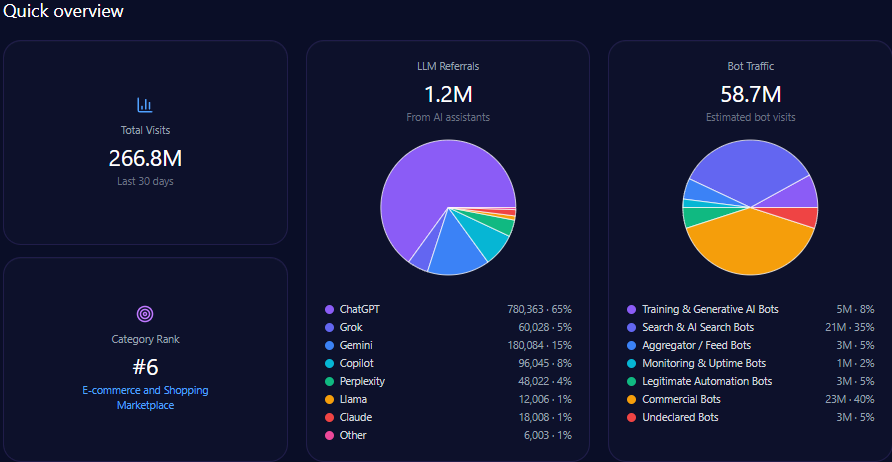
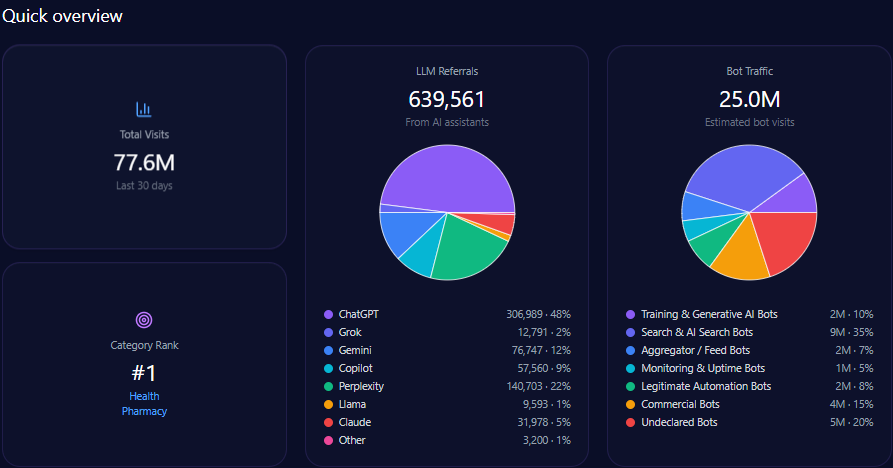
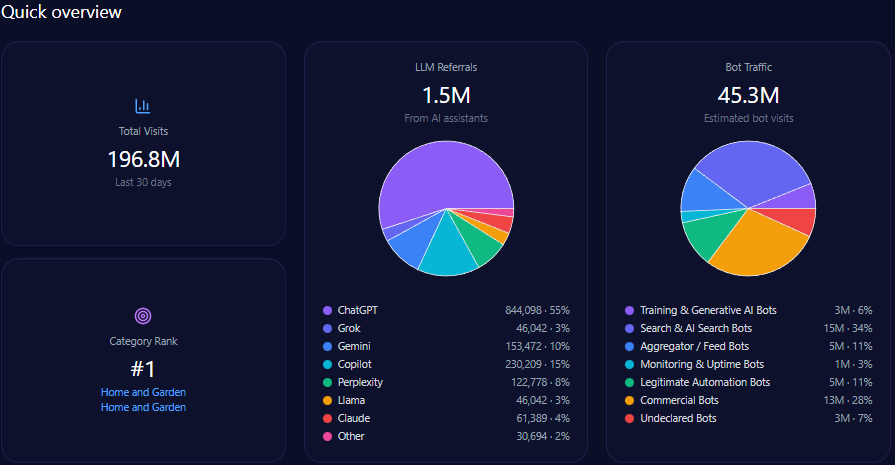
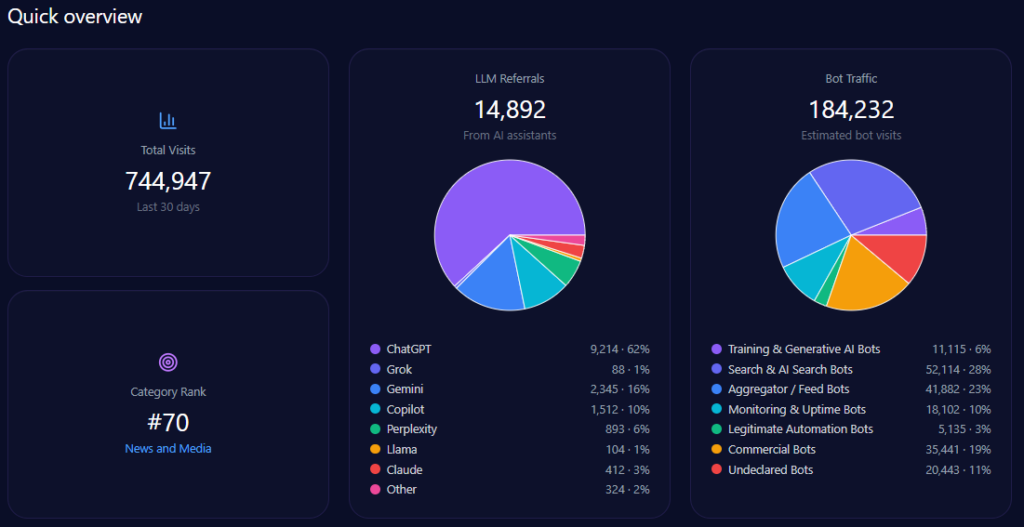
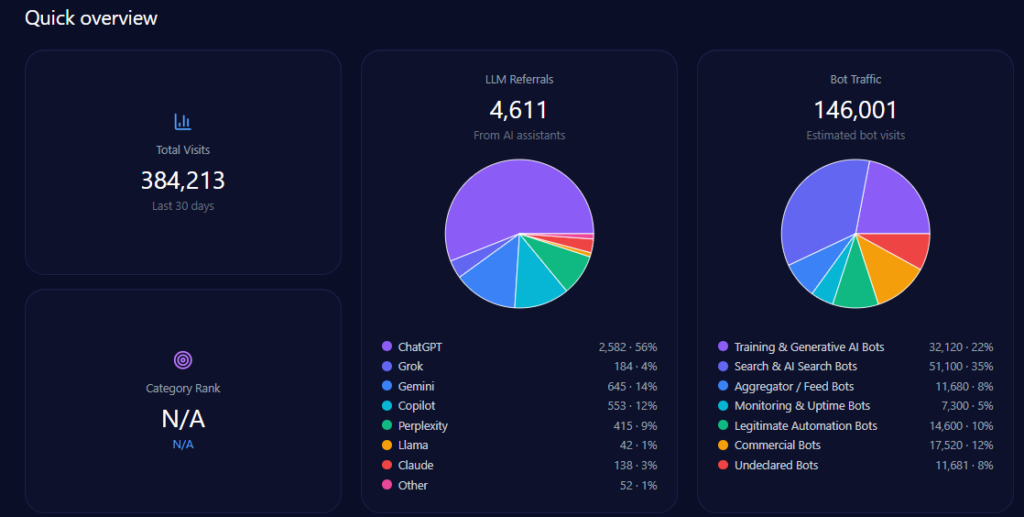
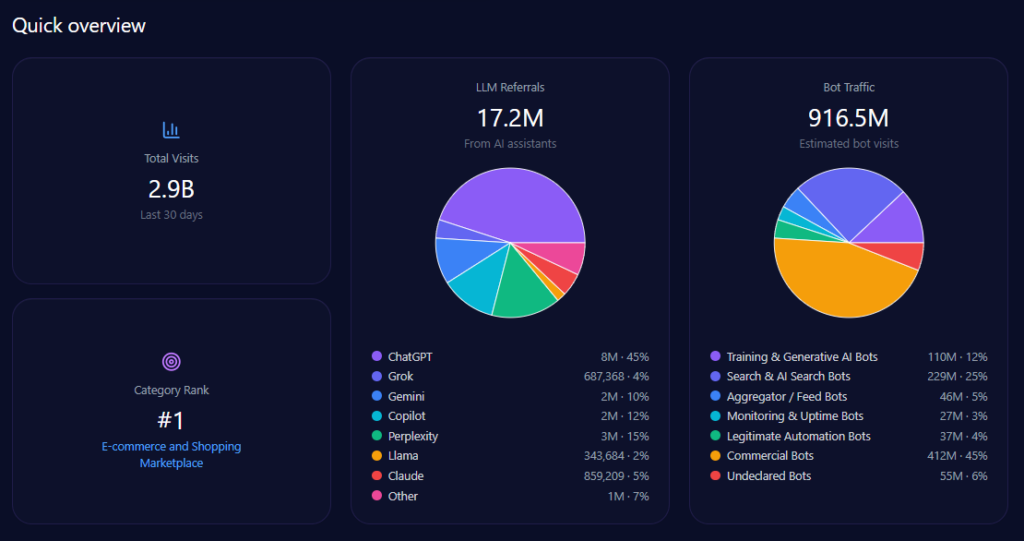
Quick overview
Kroger records 42,332,652 total visits and 13,546,449 in bot traffic. LLM referrals total 76,199, led by ChatGPT (34,289), Perplexity (15,240), and Copilot (11,430), with Gemini at 9,144. Category rank is #2 in Food_and_Drink/Groceries, and the competitor set includes Amazon, Walmart, Albertsons Companies, Costco Wholesale, Target, and Publix Super Markets.
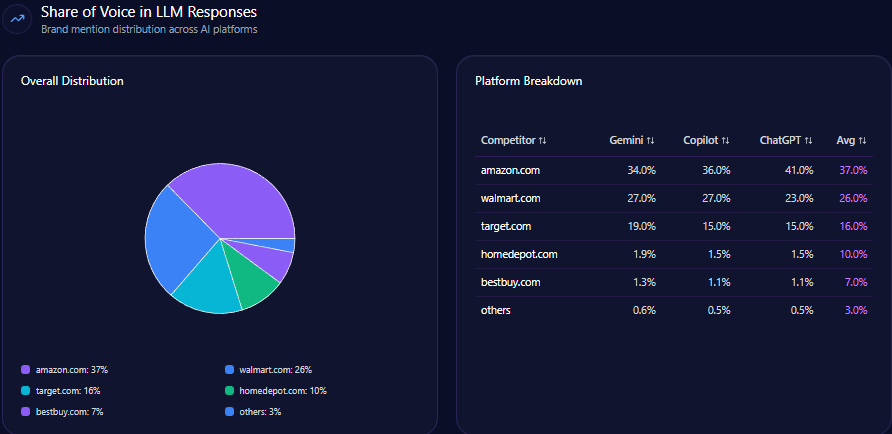
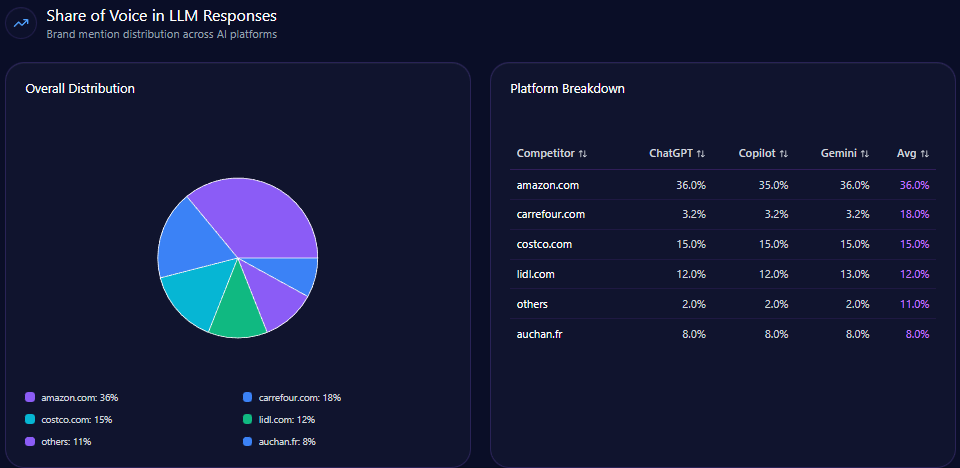
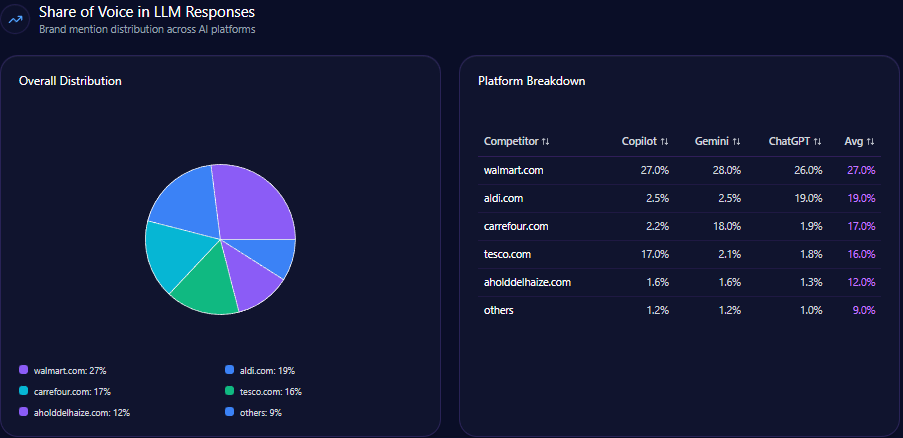
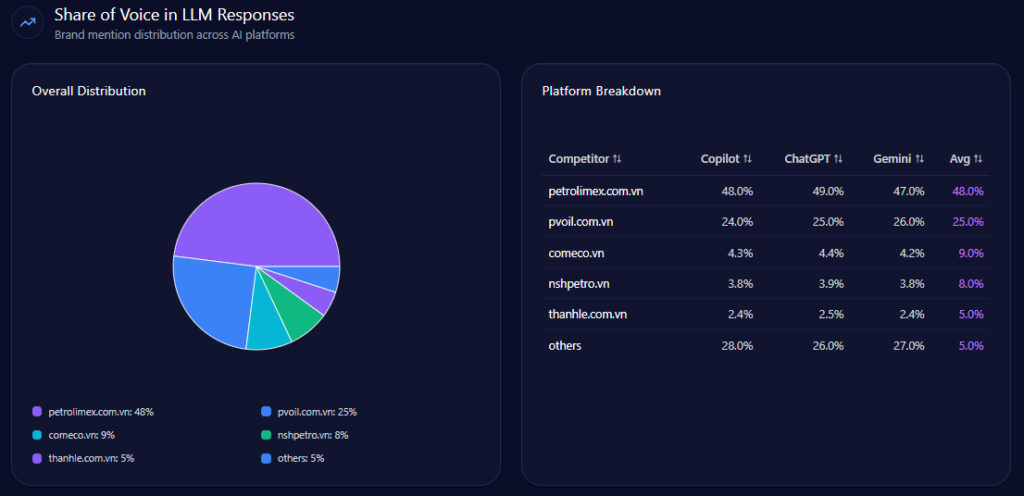
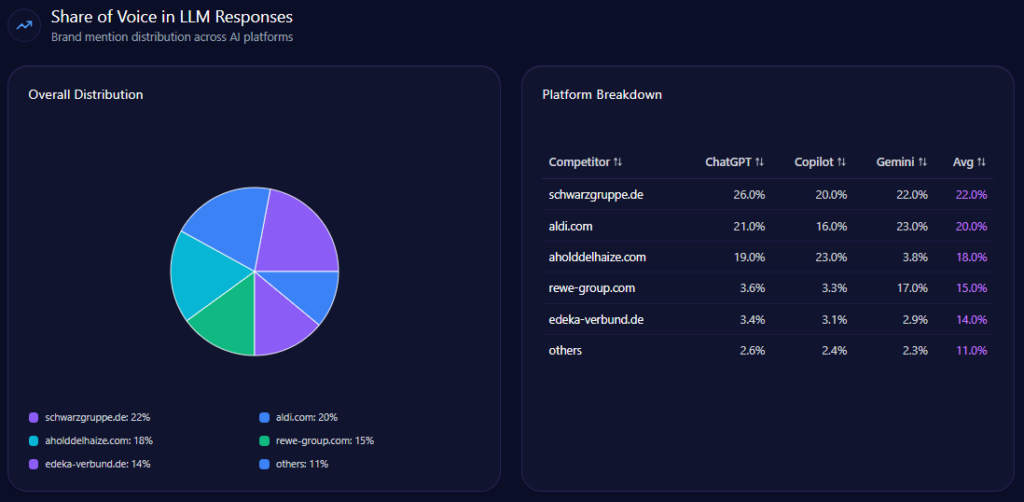
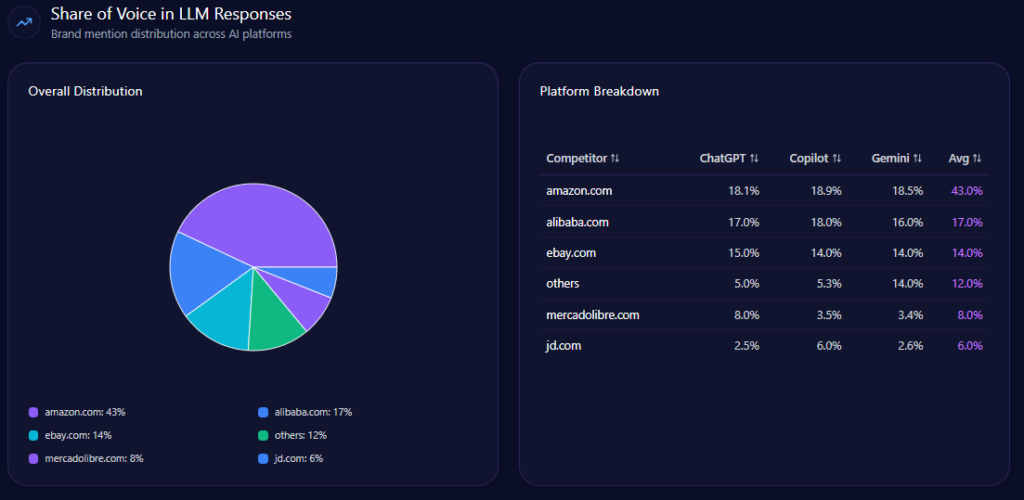
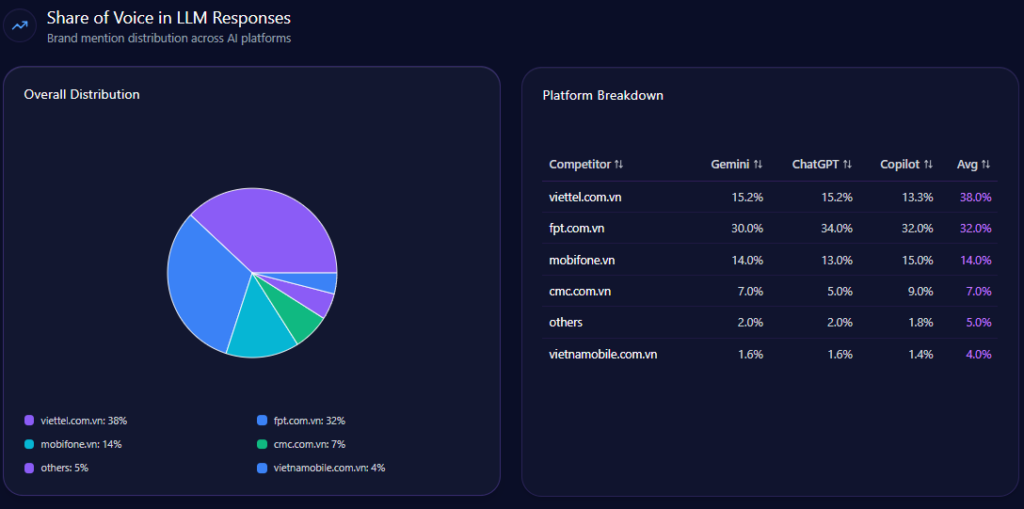
Share of Voice in LLM Responses
Across 141 total prompts on ChatGPT, Gemini, and Copilot, the report tracks 714 total mentions. Kroger holds 101 (14%), behind Amazon (218; 31%) and Walmart (204; 29%). Costco Wholesale follows with 83 (12%), and Albertsons Companies has 61 (9%). Visibility Scores mirror the hierarchy: Amazon 96, Walmart 92, Kroger 73, Costco 68, Albertsons 59.
Kroger’s challenge isn’t being missing—it’s being third. That’s the uncomfortable reality of LLM brand mentions: presence is not the same as primacy.
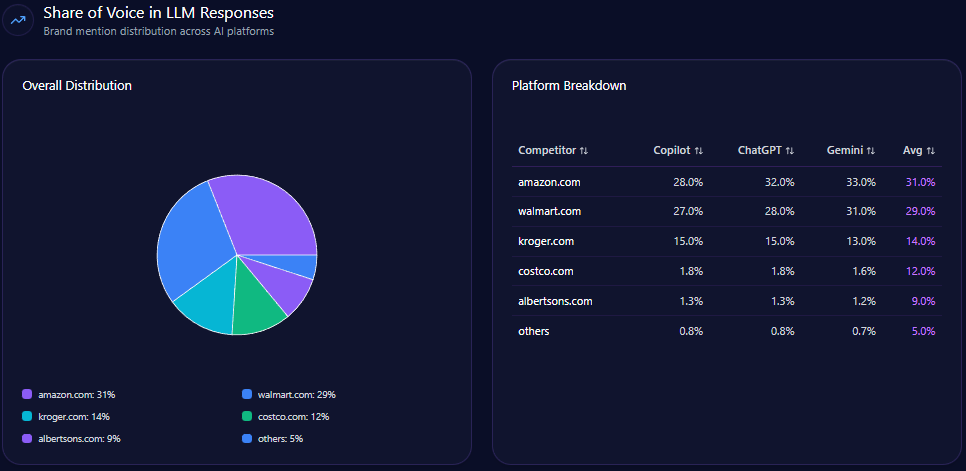
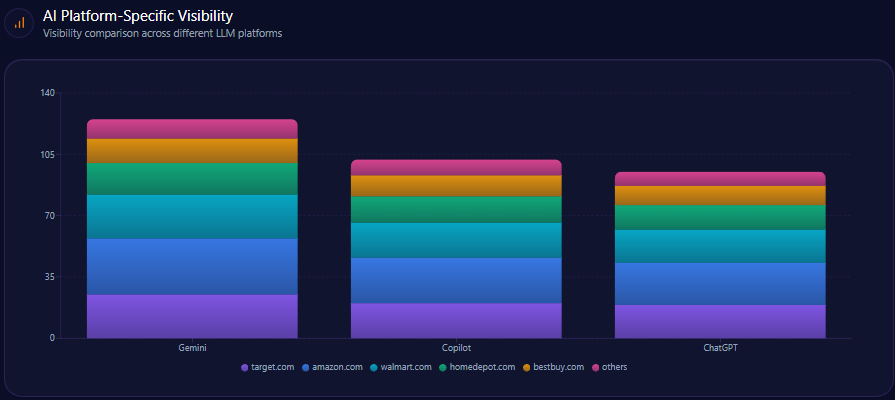
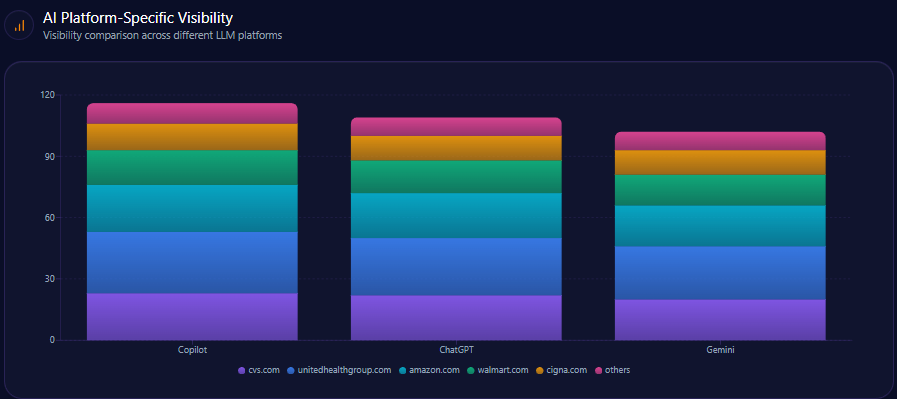
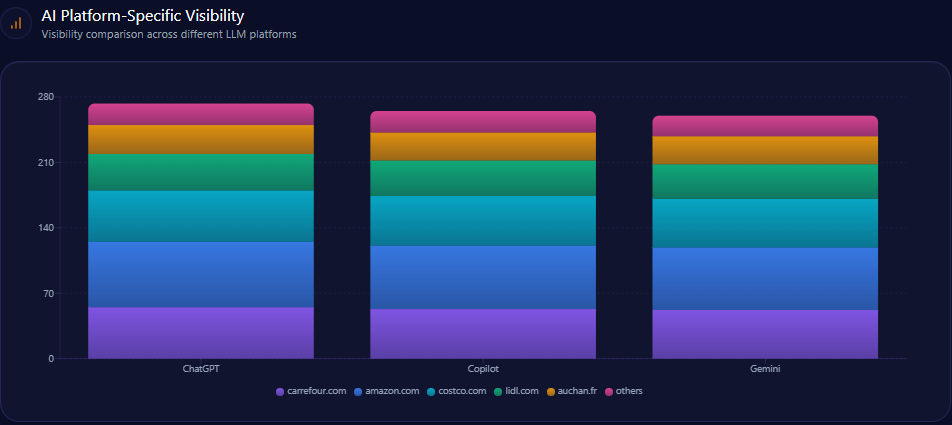
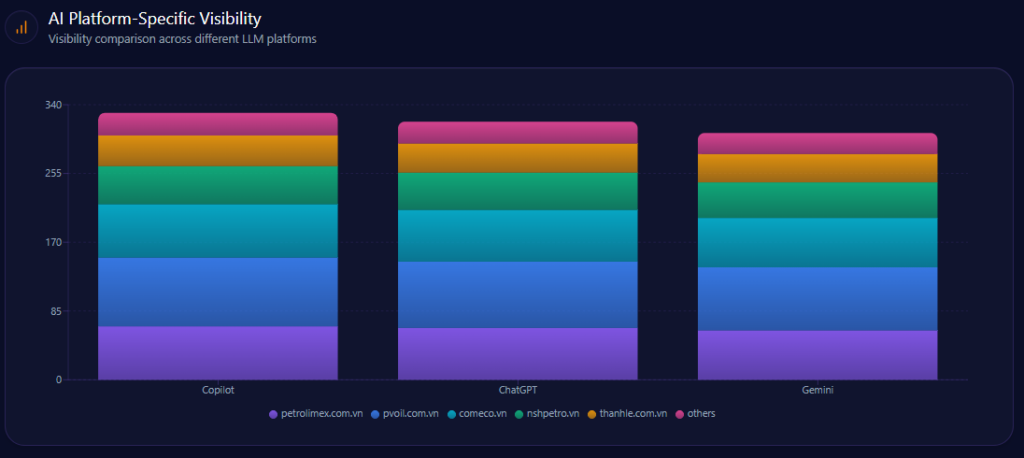
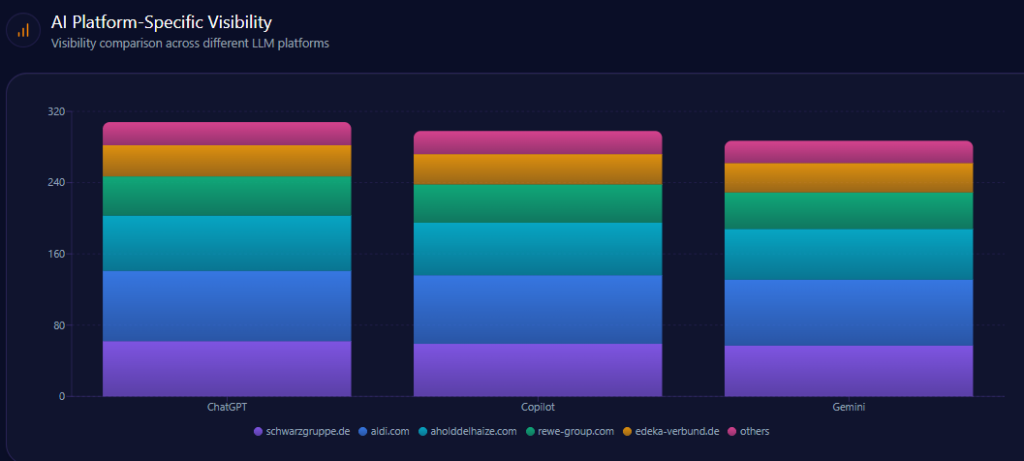
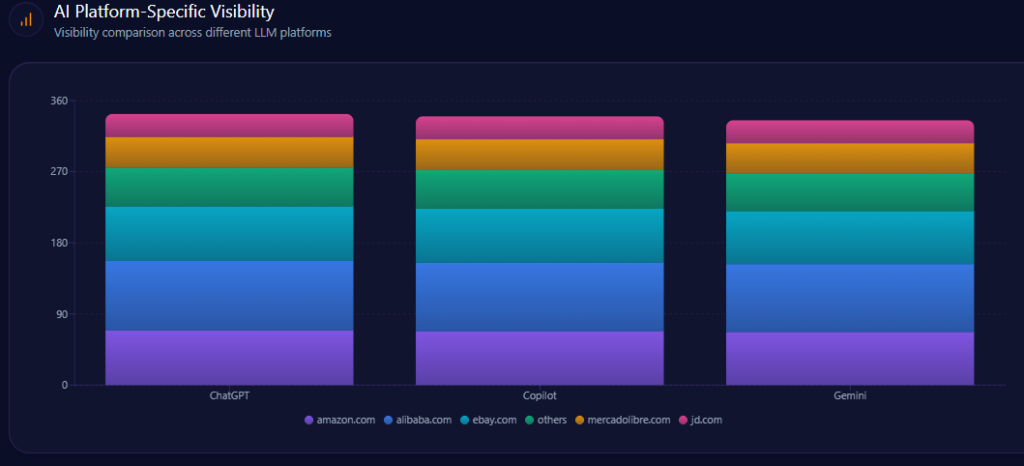
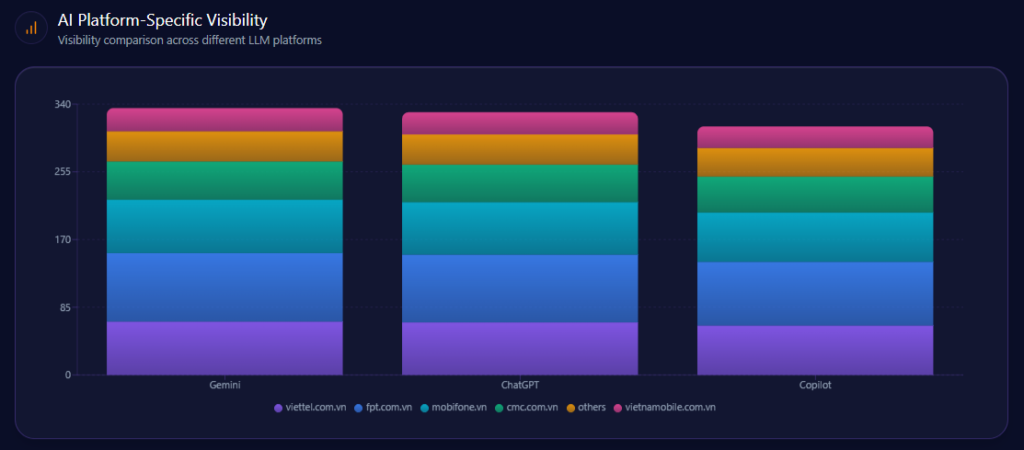
AI Platform-Specific Visibility
Kroger’s visibility is strongest on Copilot (74%), then ChatGPT (71%), then Gemini (64%). Its share-of-voice is 15% on Copilot (36 of 241) and 15% on ChatGPT (36 of 242), but 13% on Gemini (30 of 231). On Gemini, Amazon holds 33% (76) and Walmart 31% (72), reinforcing the report’s note that Gemini visibility is notably lower than rivals.
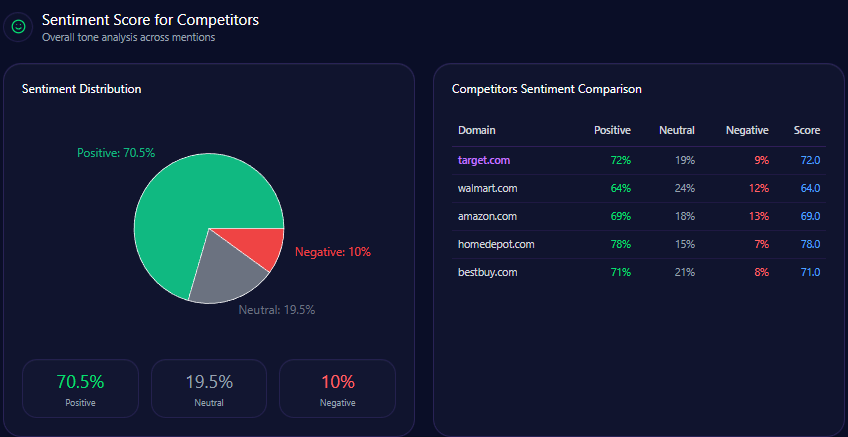
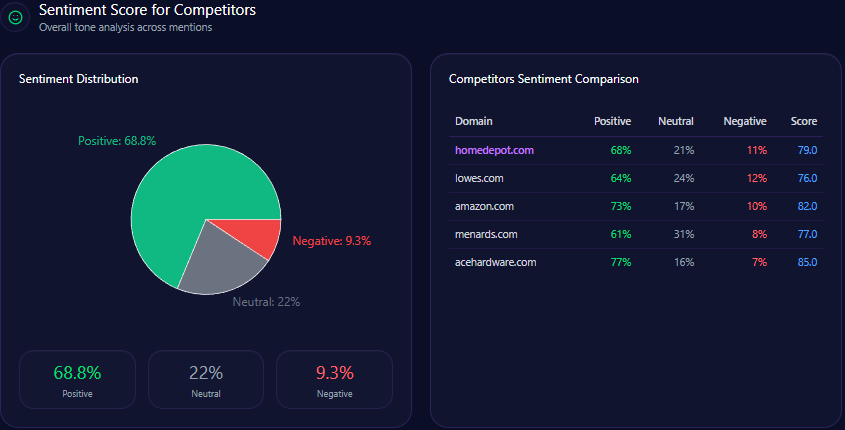
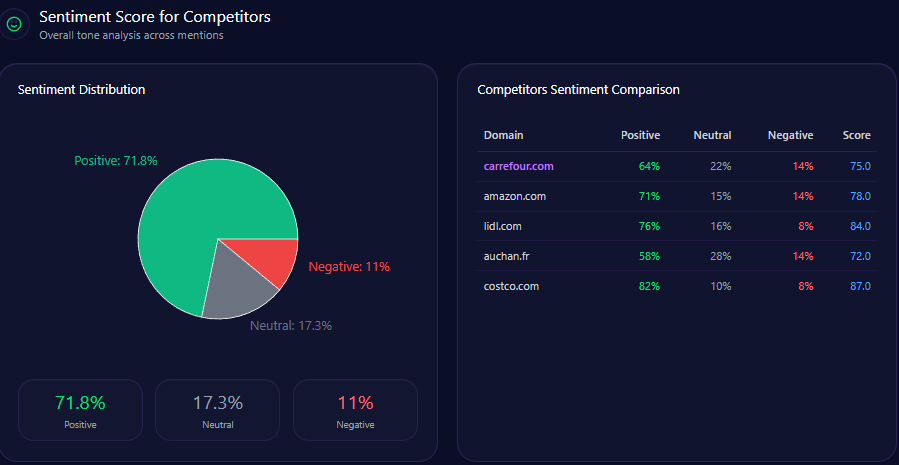
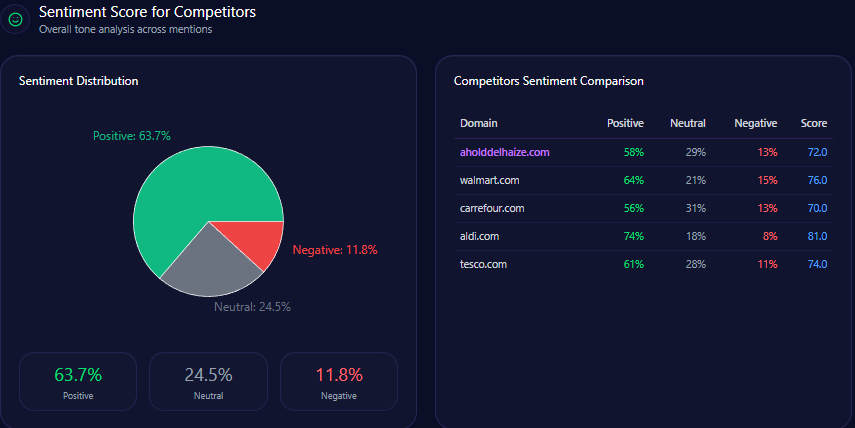
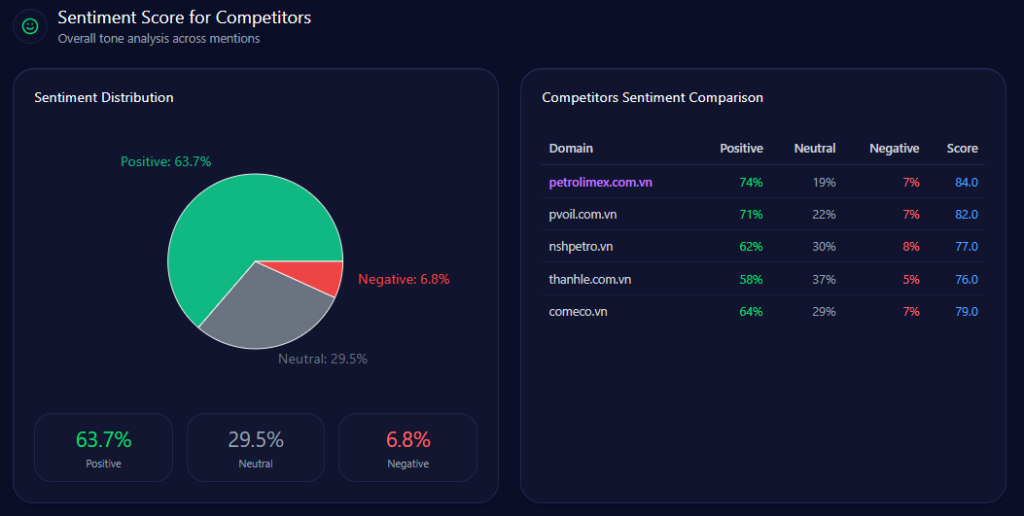
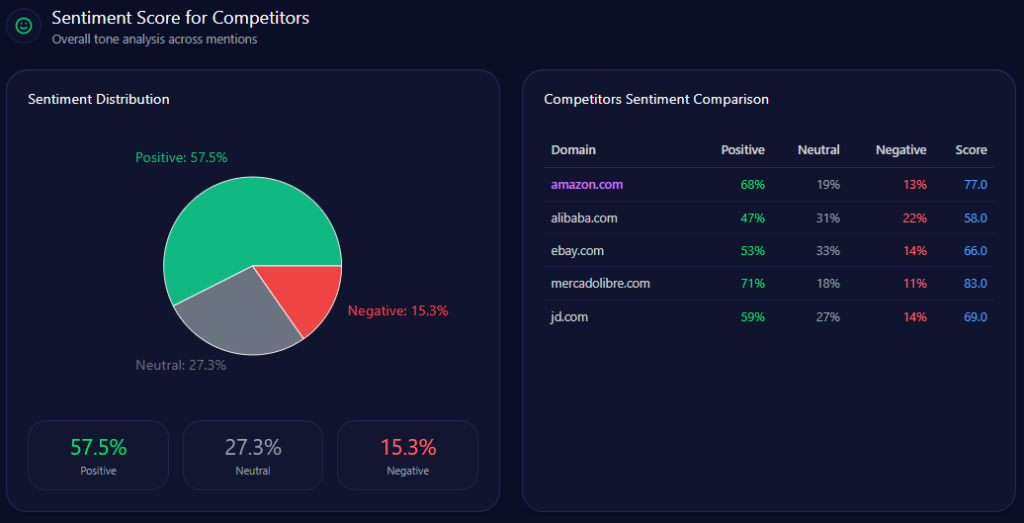
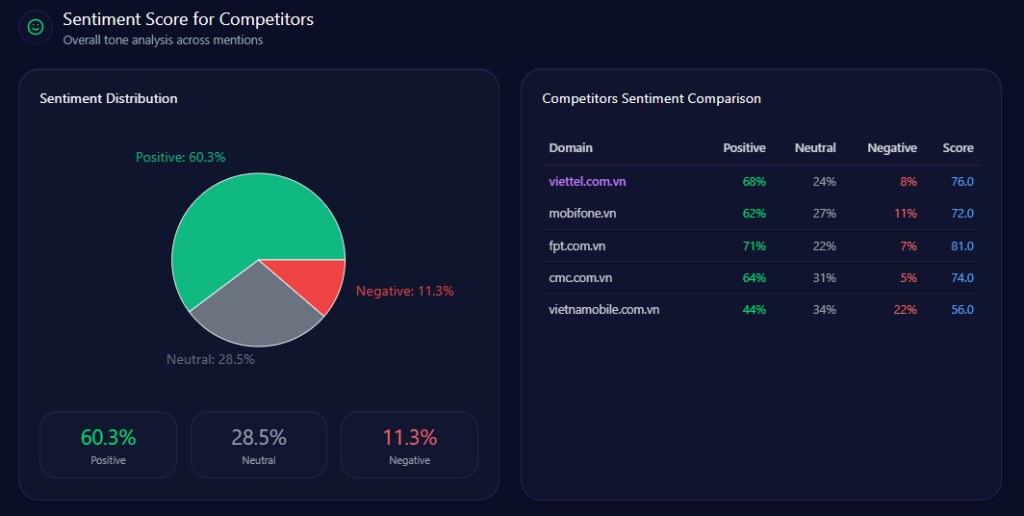
Sentiment Score for Competitors
Kroger’s tone profile is a strength: 68 positive, 21 neutral, 11 negative, and an overall sentiment score of 79. Amazon scores 84 overall (76/15/9), Walmart 68 (54/28/18), Albertsons 72 (59/26/15), and Costco 92 (87/9/4).
Three themes explain the upside and the friction. “Private Label Quality” leads (count 52, frequency 37.00) with a Positive tone. “Digital Savings & Rewards” is also Positive (count 34, frequency 24.00), with fuel points and digital coupons shaping the narrative. “Delivery & Logistics” is Mixed (count 28, frequency 20.00). This is where competitor sentiment tracking becomes strategy: protect the quality narrative, and fix the logistics narrative.
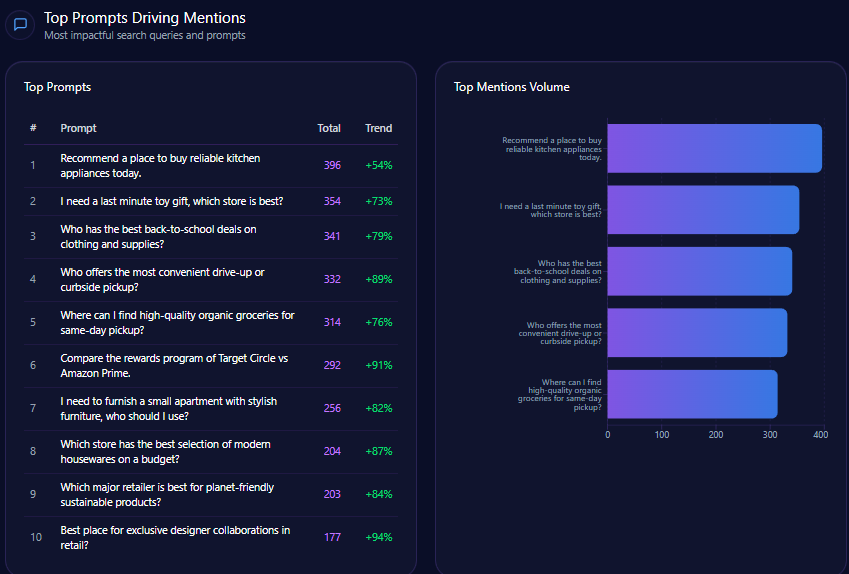
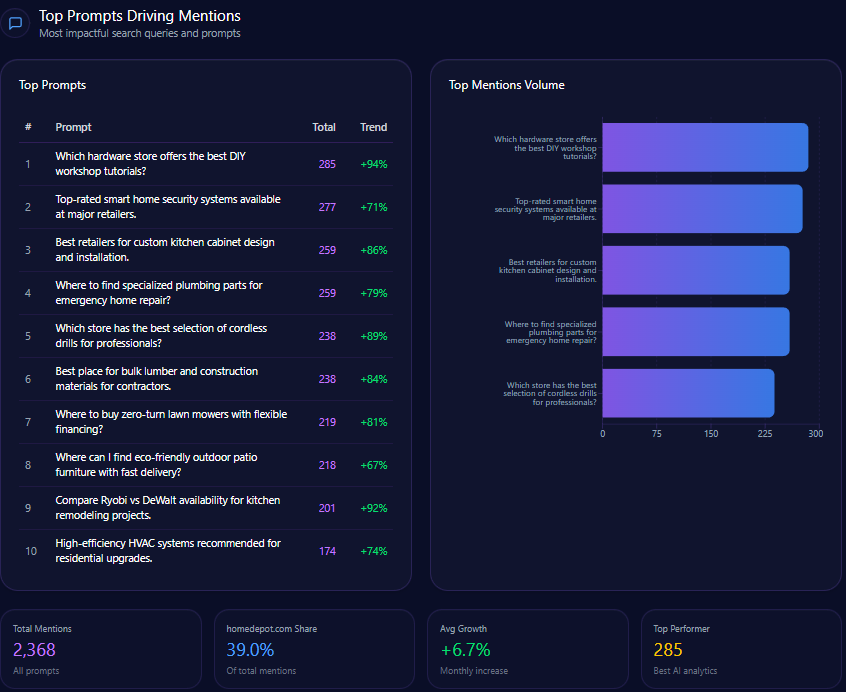
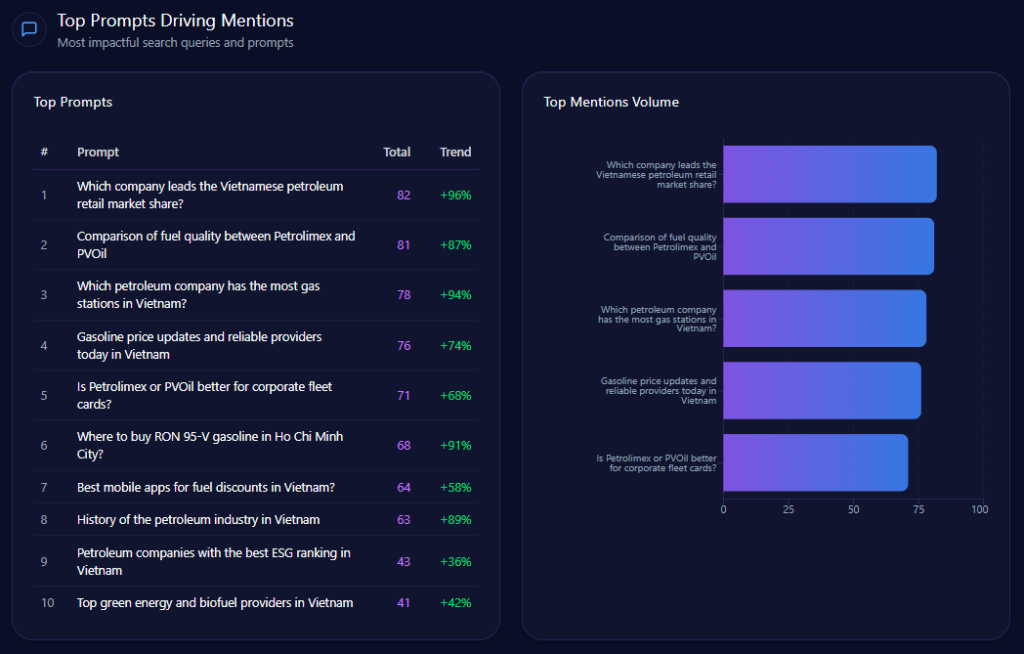
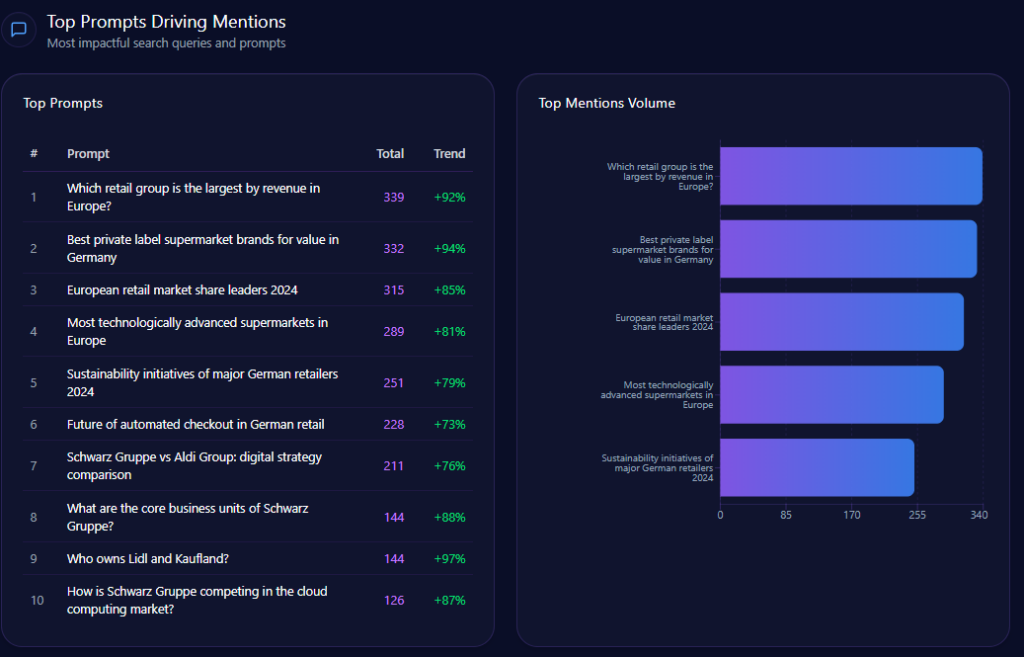
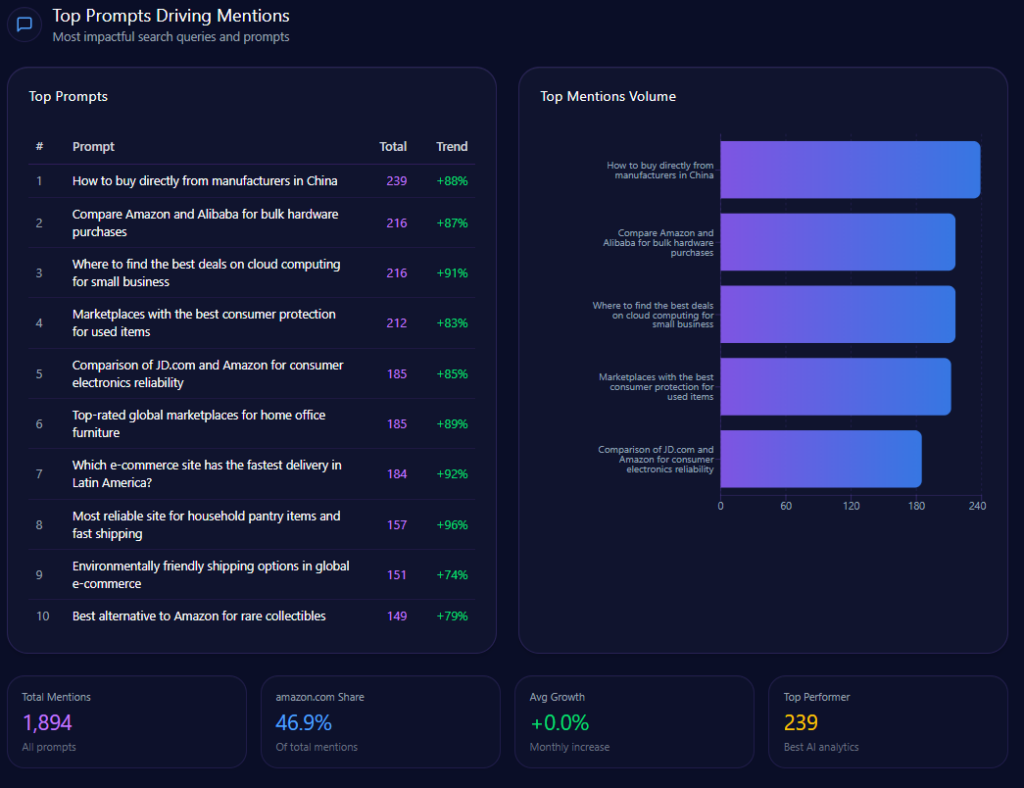
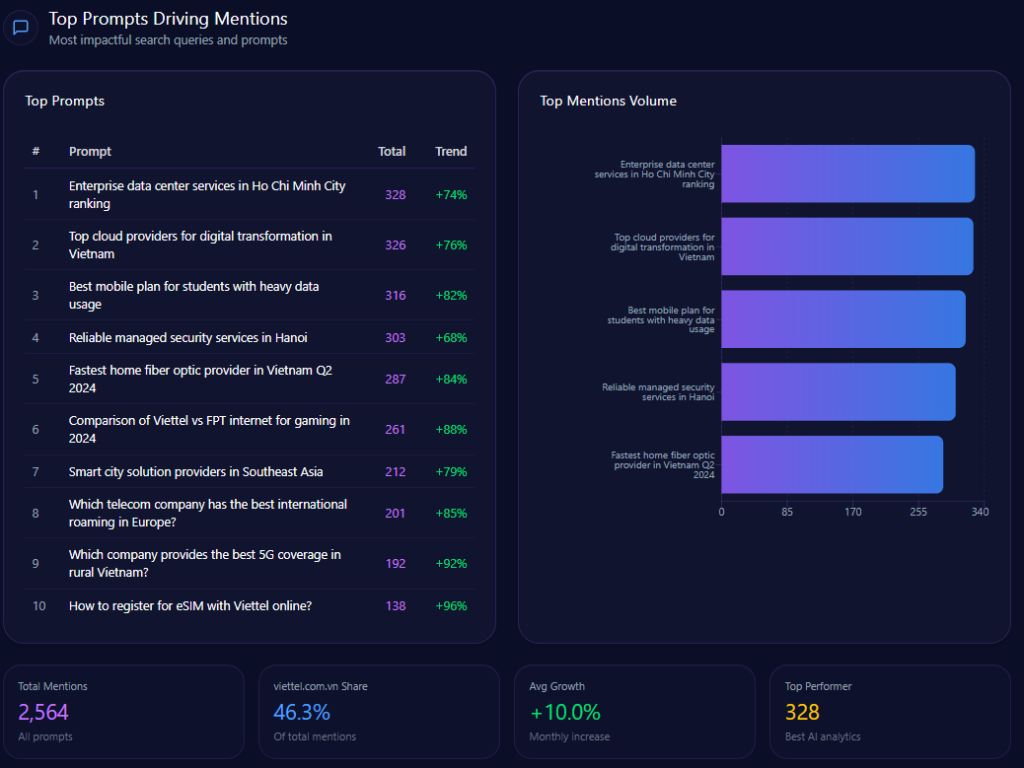
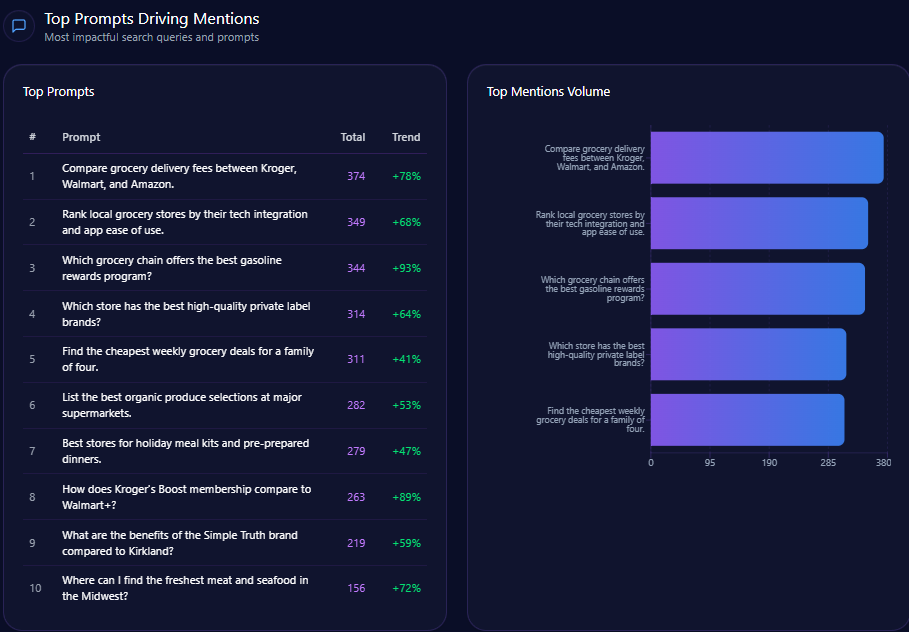
Top Prompts Driving Mentions
The biggest “summoners” of Kroger are comparison prompts that force the model to pick winners:
- “Compare grocery delivery fees between Kroger, Walmart, and Amazon.” (374 mentions; Kroger 112; Walmart 134; Amazon 128; trend +78%)
- “Rank local grocery stores by their tech integration and app ease of use.” (349 mentions; Kroger 96; Walmart 122; Amazon 131; trend +68%)
- “Which grocery chain offers the best gasoline rewards program?” (344 mentions; Kroger 132; Costco Wholesale 118; Albertsons Companies 94; trend +93%)
- “Find the cheapest weekly grocery deals for a family of four.” (311 mentions; Kroger 58; Walmart 141; Costco Wholesale 112; trend +41%)
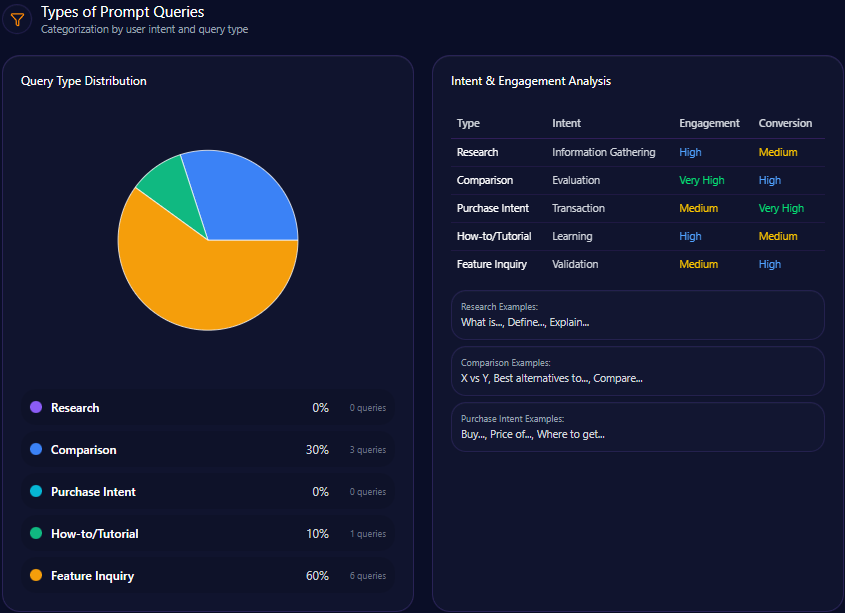
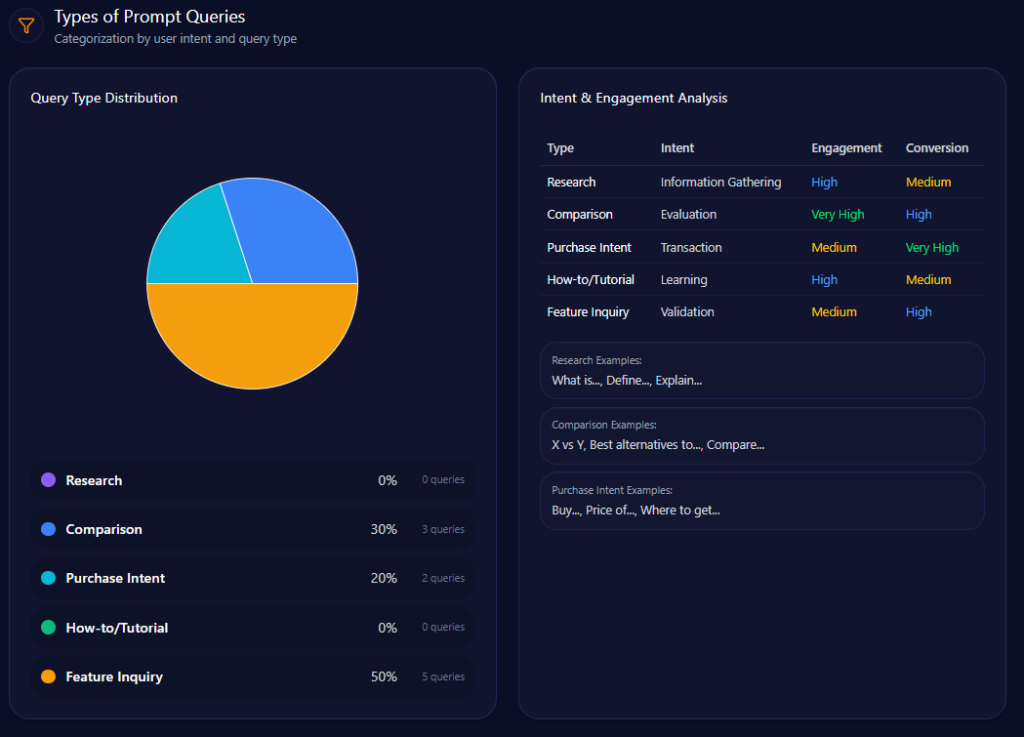
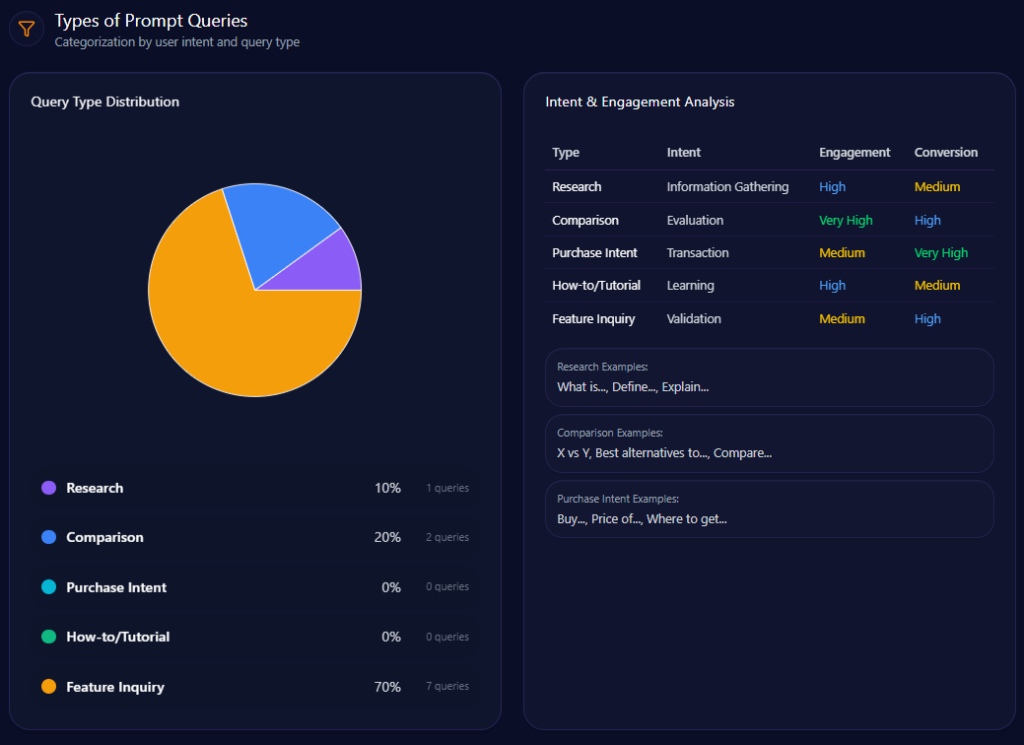
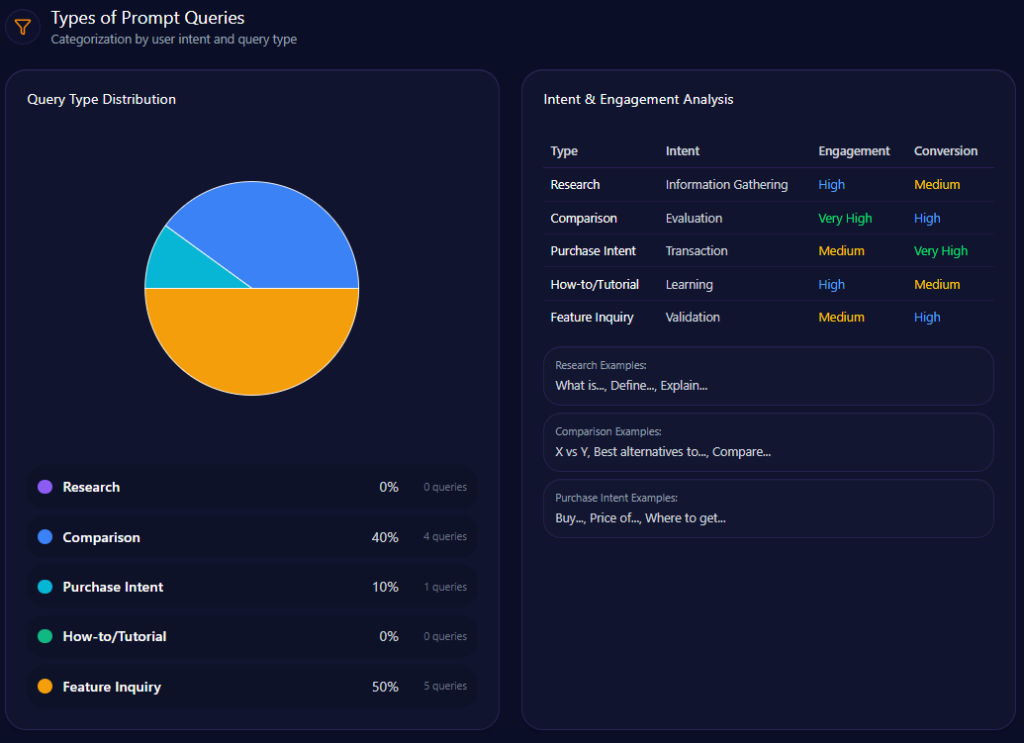
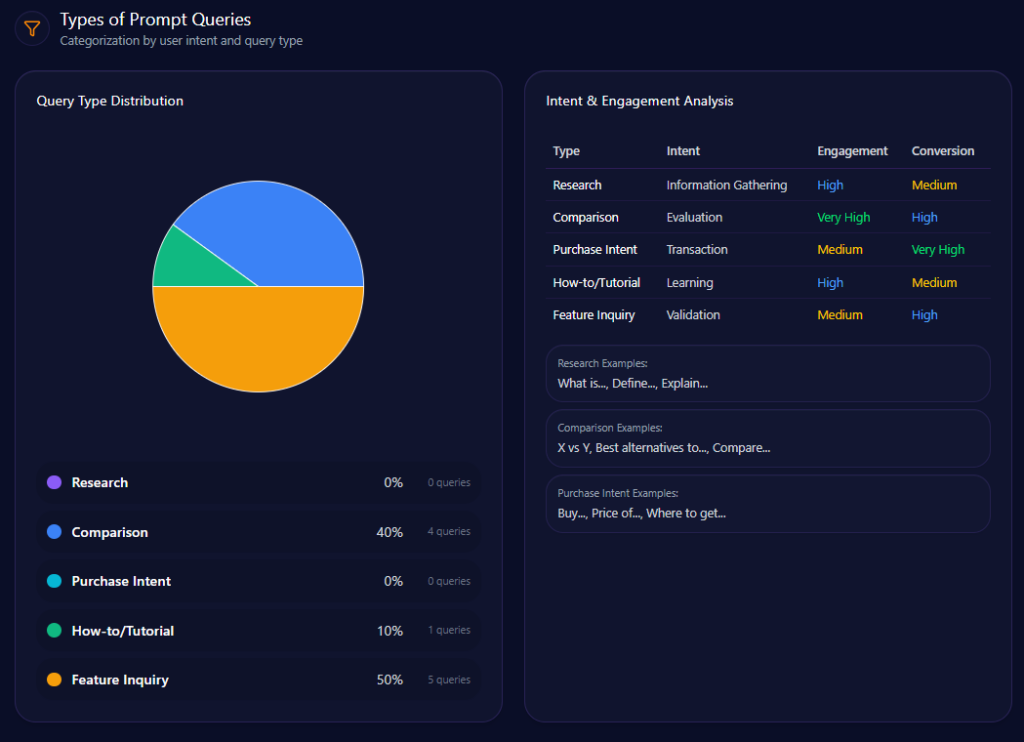
Types of Prompt Queries
The prompt mix is overwhelmingly evaluative: “Comparison” leads (value 60; count 6), followed by “Feature Inquiry” (value 30; count 3) and “Research” (value 10; count 1). “Purchase Intent” and “How-to/Tutorial” are both 0 with count 0. Kroger is being judged, not simply discovered.
E-commerce Sentiment for Competitor Products
In e-commerce share of voice, Kroger holds 12.95% with 858 mentions, behind Amazon at 32.16% (2,131) and Walmart at 30.03% (1,990), and close to Costco at 11.02% (730). Referral signals show Gemini at 1,056 with a 3.2 conversion rate, Copilot at 923 with 3.4, and ChatGPT at 842 with 2.8.
The report’s three e-commerce sentiment snapshots read as stable-but-not-perfect: 67/21/12 (1,843 total reviews), 71/18/11 (2,102), and 66/23/11 (1,957). Snippets, as cited in the report, reinforce both strengths and friction:
- “The Simple Truth brand organic milk at Kroger is consistently cheaper than name brands and tastes fresher.” (Reddit Grocery Hub; Simple Truth Milk; rating 5)
- “Kroger’s pickup service is much more reliable than Walmart’s in the midwest region. Very few substitutions.” (Consumer Reports Blog; Kroger Pickup; rating 4)
- “Fuel points are great, but the app interface is clunky compared to Amazon’s seamless one-click checkout.” (TechRetail Review; Digital App; rating 3)
And the keyword layer still governs discovery: “digital coupons grocery” pulls Walmart into 489 competitor mentions and Albertsons into 398, while “bulk grocery savings” remains Costco-dominant at 892.
Conclusion
Kroger’s current AI position is solid but fragile: 14% Share of Voice, a Visibility Score of 73, and an overall sentiment score of 79, powered by loyalty and private-label credibility. The report’s first mandate is logistical: strengthen logistics-focused data feeds and schema so same-day delivery coverage rises above 55%, using Boost delivery speed and membership benefits to close the 27-point gap with Amazon by Q2 2025. Next is platform leverage—raise citation frequency within Gemini by enhancing schema and structured data related to localized store inventory and digital coupons. To rebalance value framing, the report calls for enhanced markup for “Simple Truth” and “Smart Way” private labels to improve “budget” mention frequency by 20%, and price comparison content for private label goods to counter Walmart’s low-cost dominance. Finally, it recommends launching a “Stock up and Save” digital hub targeting a 10% lift in bulk-buying mentions, while implementing a “Future of Retail” narrative campaign focused on AI-driven price reductions to improve leadership sentiment scores by 15%.
Explore SpyderBot to operationalize these GEO analytics insights.