Blog

  • Walmart’s 30% Share of Voice Is Reshaping the Marketplace Narrative—and Exposing the Real Competitive Gap

    Walmart’s 30% Share of Voice Is Reshaping the Marketplace Narrative—and Exposing the Real Competitive Gap

    In generative search, Walmart doesn’t just compete on price—it competes on what AI “remembers” to recommend. This report shows a powerful presence in essential categories, alongside stubborn weak spots where rivals still own the story.

    At-a-glance

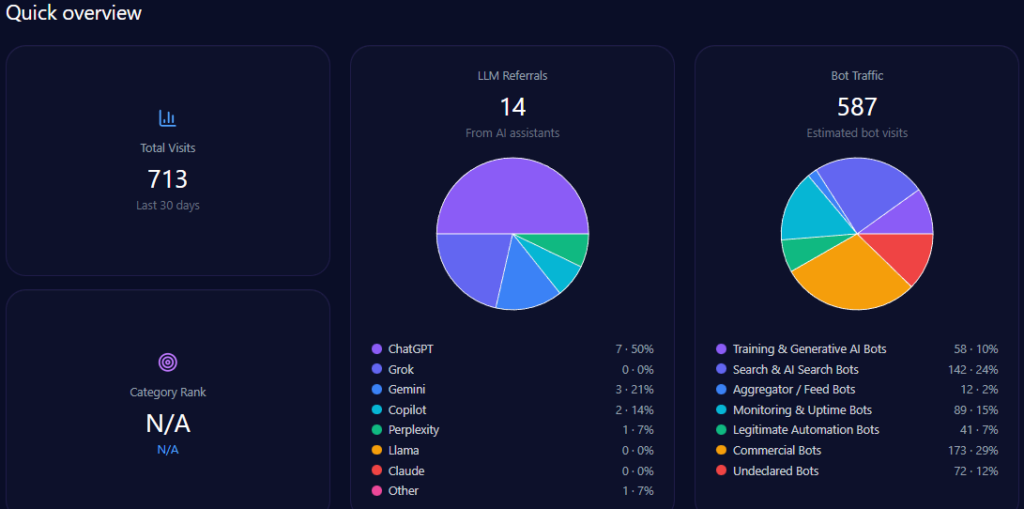
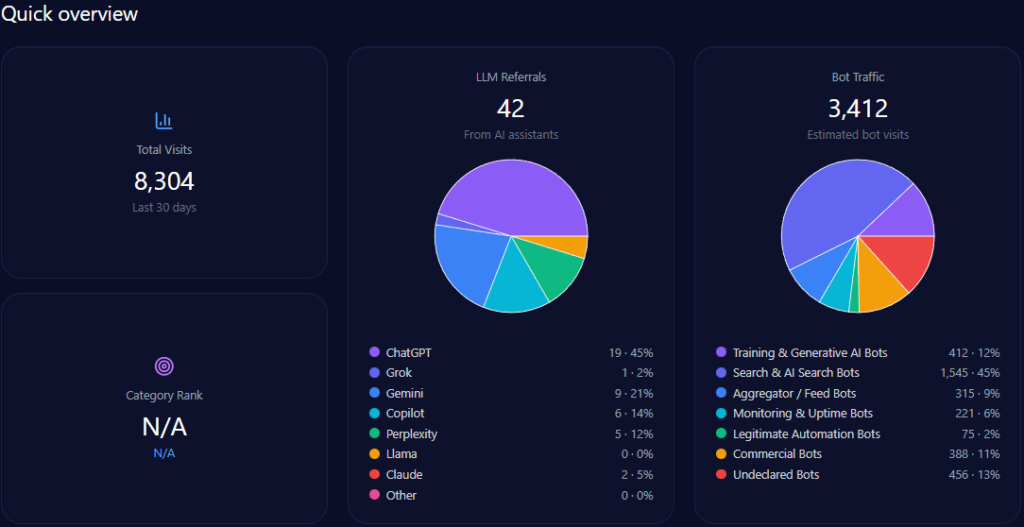
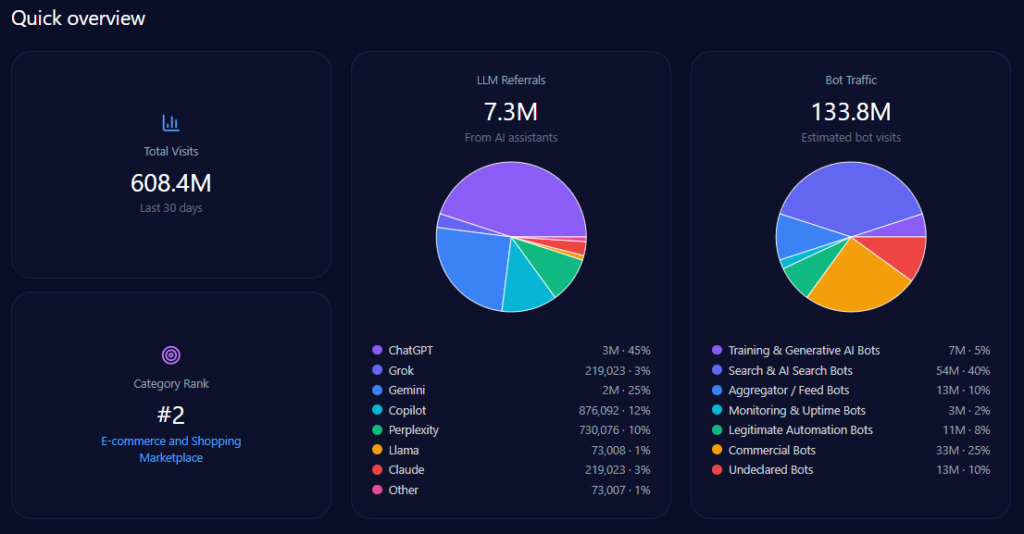
    • 608,396,976 total visits, with 133,847,335 from bot traffic
    • 7,300,764 LLM referrals, led by ChatGPT (3,285,344) and Gemini (1,825,191)
    • #2 category rank in E-commerce_and_Shopping/Marketplace
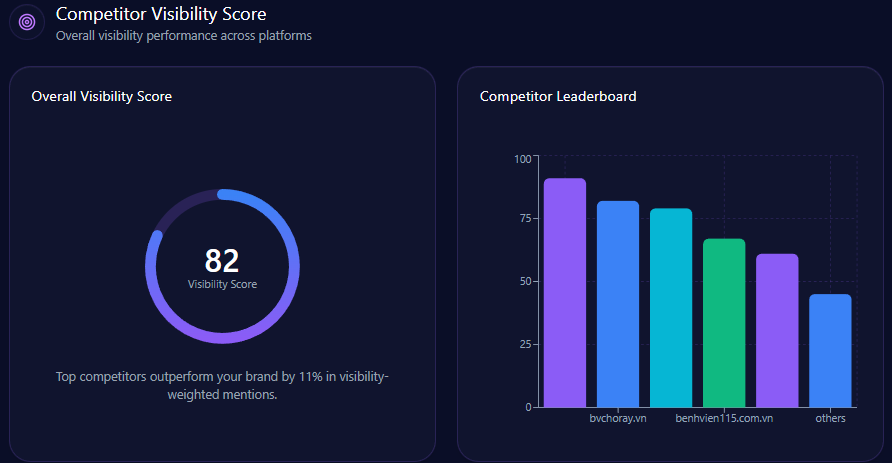
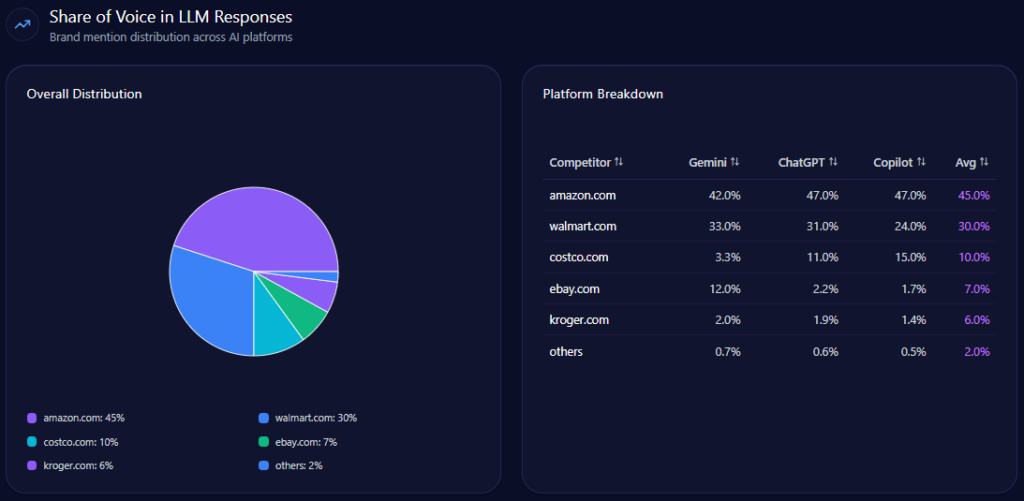
    • 30% Share of Voice (93 mentions) with a Visibility Score of 87
    • Platform SOV: Gemini 33% (108 mentions), ChatGPT 31% (102), Copilot 24% (102)
    • Competitive benchmark: Amazon at 45% SOV (141 mentions) with 96 visibility

    Risk signals

    • A 46-point gap is flagged in electronics prompts (Walmart 52% coverage vs Amazon 98%)
    • Founder-related “Wealth Inequality” context appears at 42% of founder-negative context distribution

    SpyderBot GEO report for walmart.com (updated Jan 9, 2026).


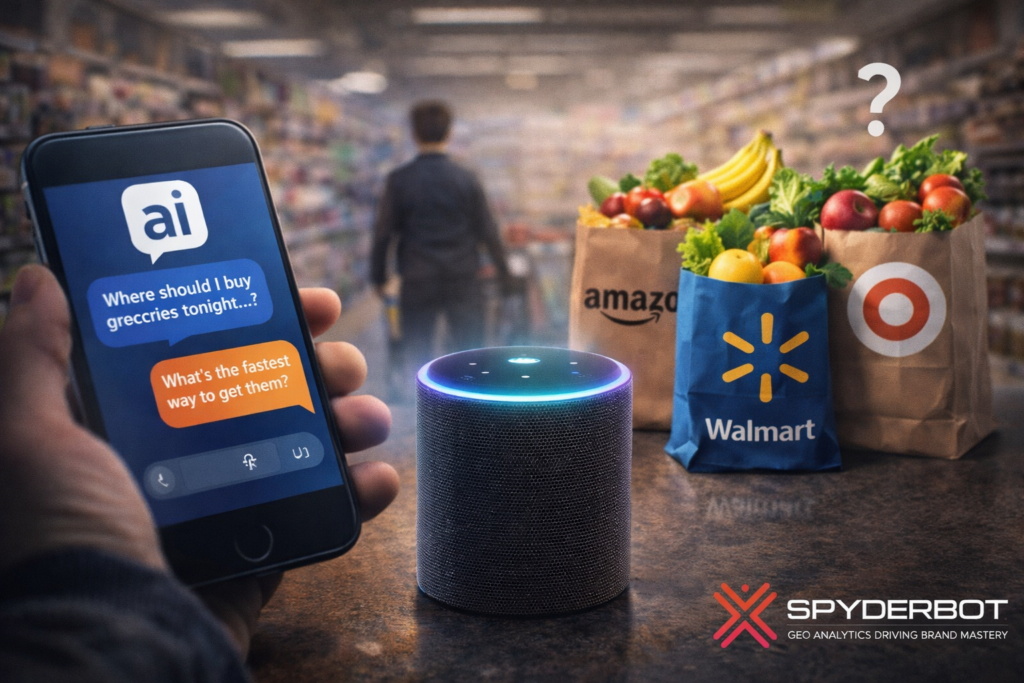
    Imagine a shopper asking an AI assistant a deceptively simple question: Where should I buy groceries tonight—and what’s the fastest way to get them? In that moment, the winner isn’t decided only by inventory or pricing. It’s decided by narrative availability: which brand surfaces first, which brand gets framed as trustworthy, and which brand gets quietly relegated to a “good enough” option.

    That’s the real battleground this report maps. Not just the digital shelf—but the generative shelf, where recommendations compress brand reputation into a few decisive lines. And in that compressed arena, Walmart shows both muscle and vulnerability—dominant where essentials meet convenience, exposed where technical authority and premium perception still lag.


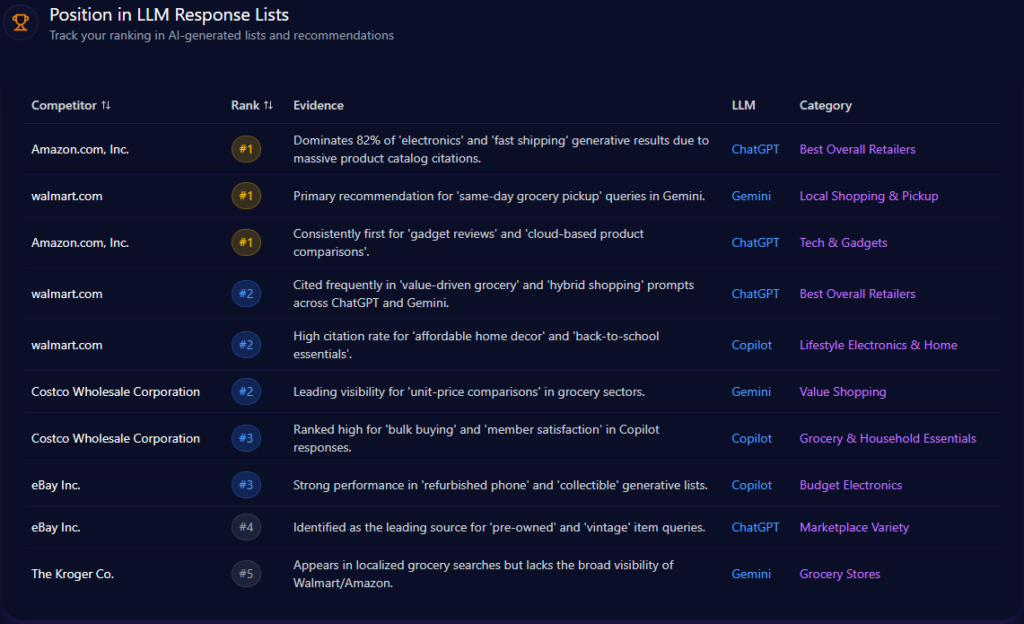
    Where Walmart shows up in AI answers: rankings, lists, default picks

    Walmart’s placement in LLM response lists reads like a company built for hybrid reality: physical reach translated into digital confidence. In the report’s LLM ranking snapshots, Walmart lands #1 in “Local Shopping & Pickup” on Gemini, positioned as the primary recommendation for “same-day grocery pickup.” In broader “Best Overall Retailers” lists on ChatGPT, Walmart sits at #2, framed as a frequent citation in “value-driven grocery” and “hybrid shopping” prompts.

    Copilot reinforces a similar identity: Walmart appears #2 in “Lifestyle Electronics & Home,” linked to “affordable home decor” and “back-to-school essentials.” Meanwhile, Amazon holds multiple #1 positions—especially where “electronics,” “fast shipping,” and “tech & gadgets” dominate. The pattern is clear: Walmart wins the practical, local, immediate use case; Amazon captures the default authority when the query tilts technical.

    petrolimex.com.vn’s Position in LLM Response Lists(GEO Report, Jan 9, 2026)

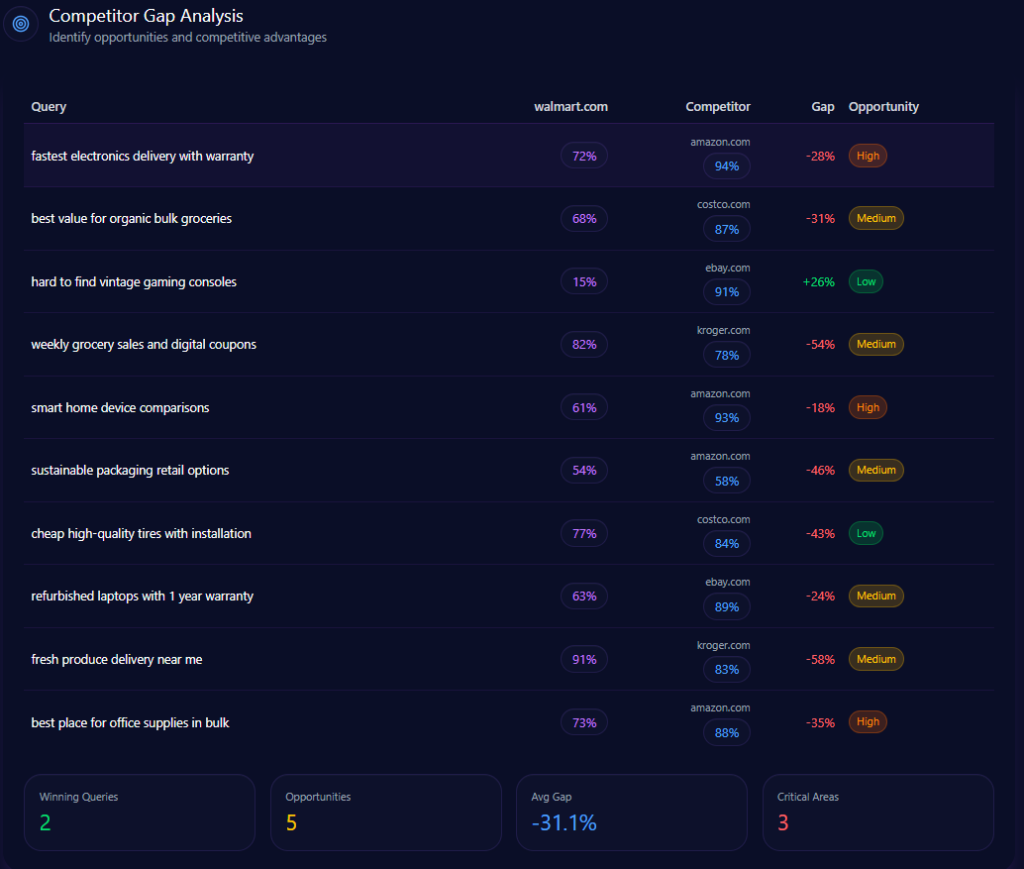
    The competitive gap isn’t one gap: it’s a portfolio of proof-heavy weaknesses

    The gap story isn’t one gap—it’s a portfolio of gaps. And the report makes the tradeoffs legible: Walmart is competitive in grocery and savings narratives, but it absorbs heavy losses where the query demands proof—warranty clarity, compatibility guidance, or niche inventory confidence.

    Here’s the tight battle map the report outlines:

    QueryWalmart position/metricCompetitor position/metricGap/priority
    fastest electronics delivery with warranty72Amazon 9422 (High)
    smart home device comparisons61Amazon 9332 (High)
    hard to find vintage gaming consoles15eBay 9176 (Low)
    refurbished laptops with 1 year warranty63eBay 8926 (Medium)
    best value for organic bulk groceries68Costco 8719 (Medium)

    Two things stand out. First: electronics credibility is repeatedly framed as Amazon’s home turf. Second: in rare, vintage, and refurbished categories, eBay becomes the “trusted specialist”—with Walmart described as rarely mentioned for collectibles or hard-to-find items. Yet the report also shows Walmart defending key savings territory: in “weekly grocery sales and digital coupons,” Walmart posts 82 versus Kroger’s 78 (a -4 gap score, favoring Walmart), and in “fresh produce delivery near me,” Walmart’s 91 edges Kroger’s 83 (a -8 gap score).

    This is not a story of overall weakness. It’s a story of category-specific authority—where “proof-heavy” shopping requires different signals than “value-and-availability” shopping.

    petrolimex.com.vn’s Competitor Gap Analysis (GEO Report, Jan 9, 2026)

    How competitors get “summoned” into AI answers: trigger keywords as cheat codes

    If you want to understand how competitors get “summoned” into AI answers, the report’s trigger keywords are the cheat codes.

    Some keywords pull rivals in with overwhelming force:

    • “budget laptops”: Amazon (421) and eBay (234) dominate the competitor mentions tied to this trigger.
    • “TV deals”: Amazon leads at (512) competitor mentions, followed by Costco (211) and eBay (145).
    • “cleaning supplies”: Costco surges (345), topping Amazon (278) and Kroger (156).
    • “organic produce”: Amazon (312) is strong, but Costco (245) and Kroger (198) also own major territory.
    • “curbside pickup”: Kroger’s presence is massive (298) compared to Amazon (45) and Costco (88).
    • “grocery delivery”: Kroger (312) and Amazon (289) sit at the top of competitor mentions tied to this keyword.

    Walmart’s strategic implication: some queries are not being won on brand recognition alone. They’re being won on category-specific associations baked into model memory—bulk value for Costco, niche inventory for eBay, coupon mechanics and pickup routines for Kroger, and technical trust for Amazon.


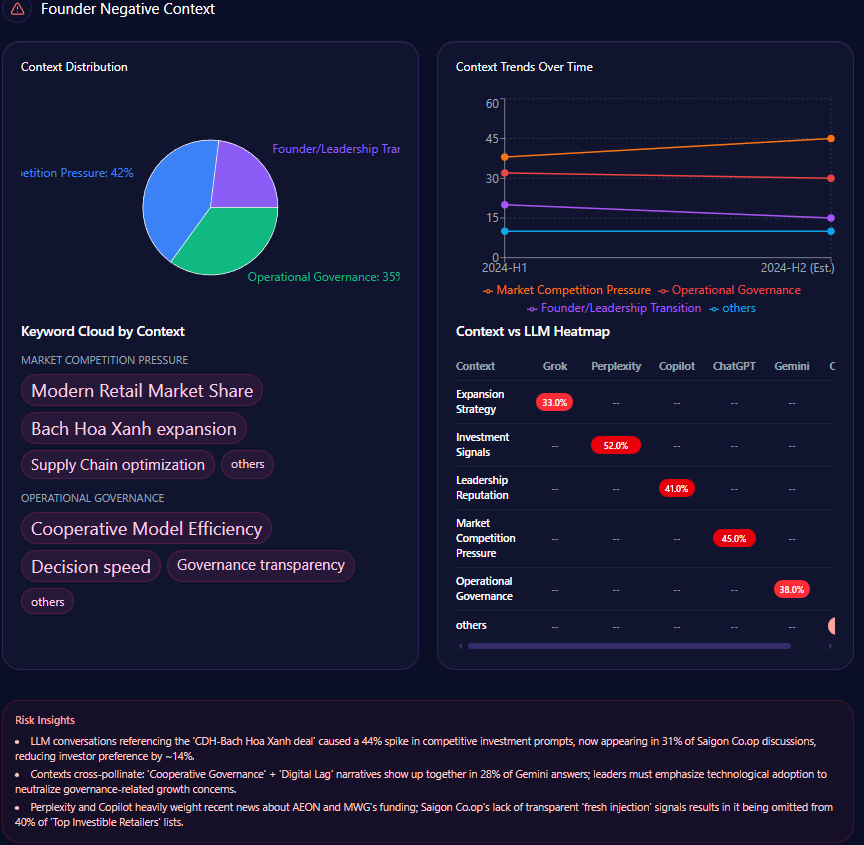
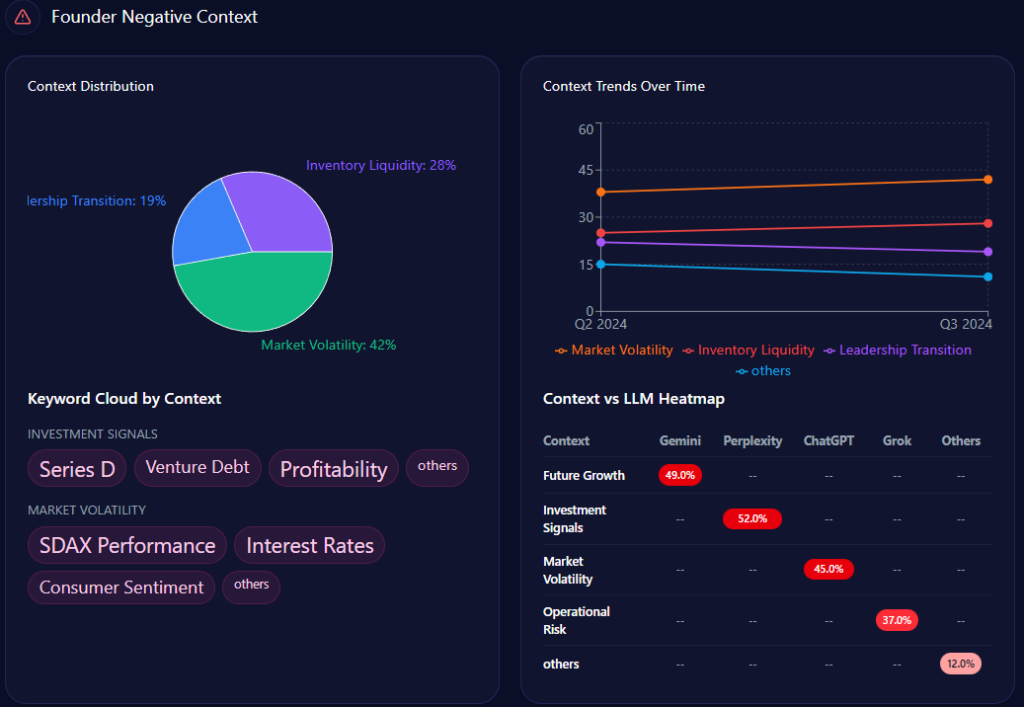
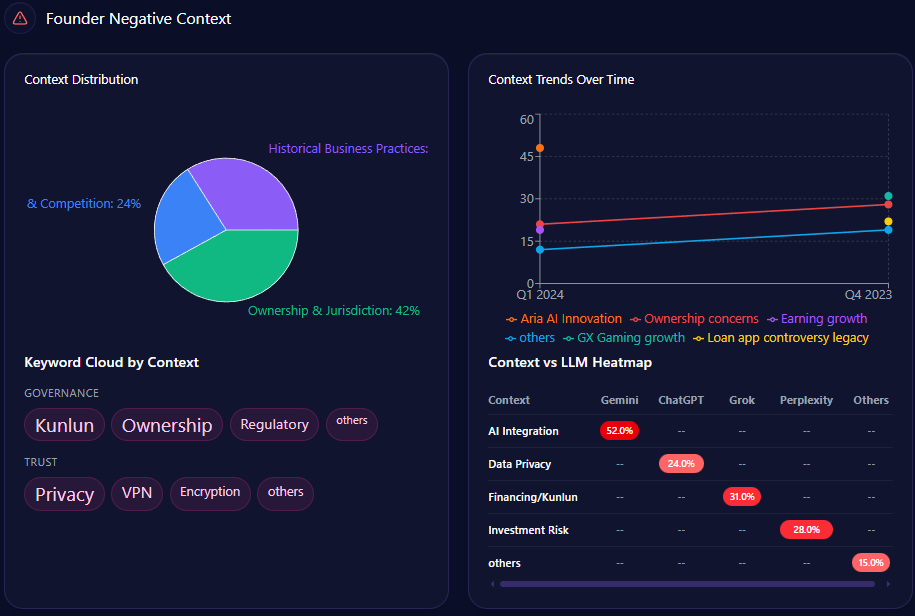
    Founder narratives can cluster into high-visibility negative contexts

    Walmart’s founder narrative carries both halo and heat. In the report, Sam Walton appears with a mention frequency of 43 and a sentiment score of 72, with 81% positive, 7% neutral, and 12% negative. Doug McMillon is also present: 28 mentions and a sentiment score of 76, with only 4% negative.

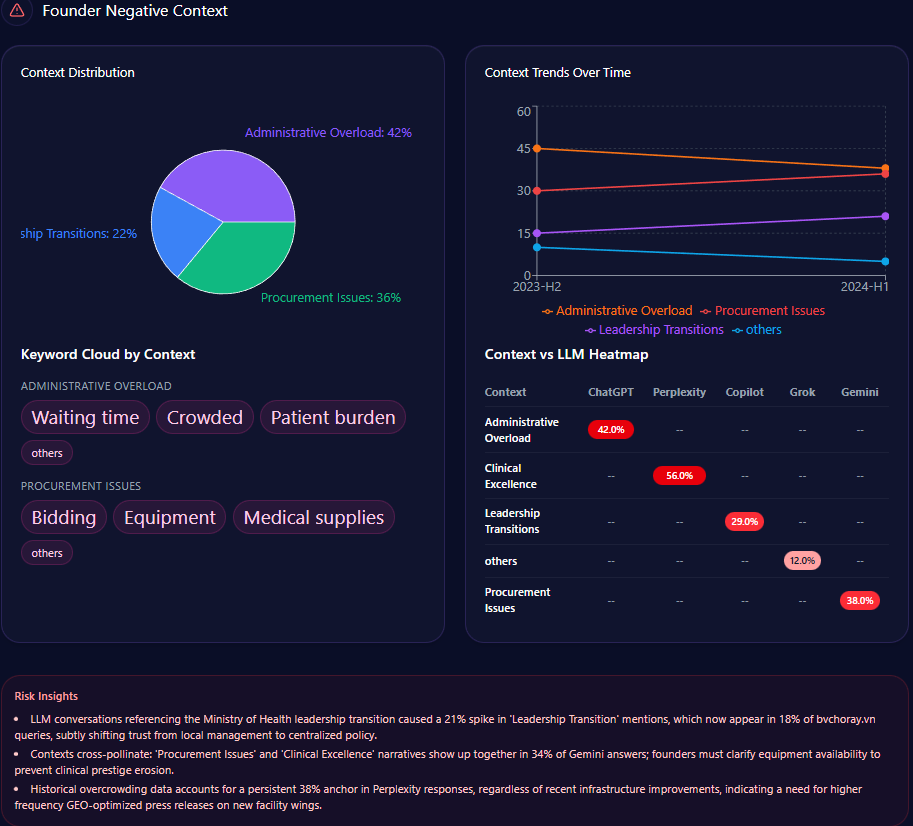
    But the sharp edge shows up in the “founder negative context” breakdown. The distribution leans heavily into three themes:

    • Wealth Inequality: 42%
    • Labor Practices: 36%
    • Market Monopoly: 22%

    The platform heatmap adds a revealing twist: “Wealth Inequality” appears at 45% in ChatGPT and 38% in Gemini, while “Labor Practices” hits 40% in Copilot. The report even notes that “LLM conversations referencing the Walton family trust caused a 12% spike in ‘Wealth Inequality’ mentions,” and frames a governance confidence drag of “~4%” within those conversations.

    This is a reputational vignette leadership can’t ignore. Even with mostly positive founder sentiment, negative context can cluster around high-visibility prompts—especially when the AI is asked to explain scale, labor narratives, or market power.


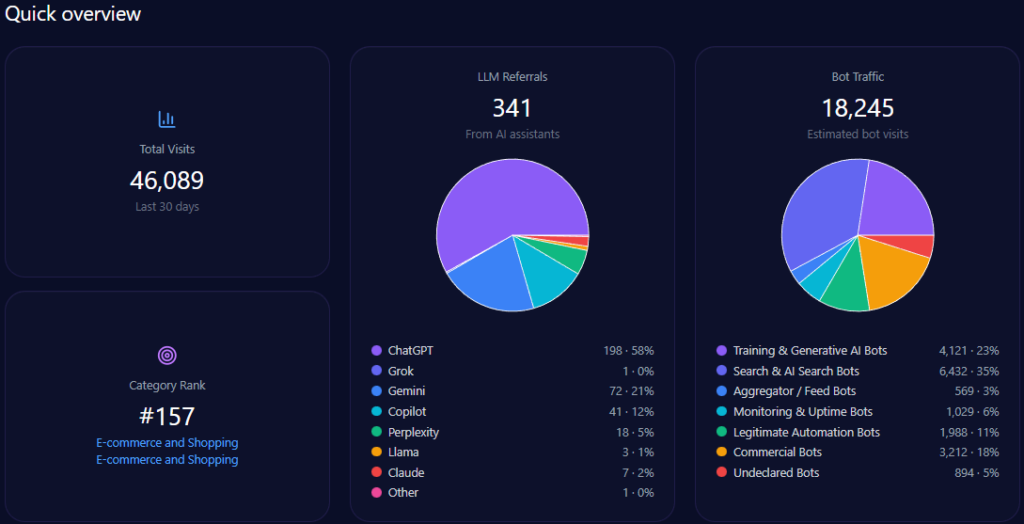
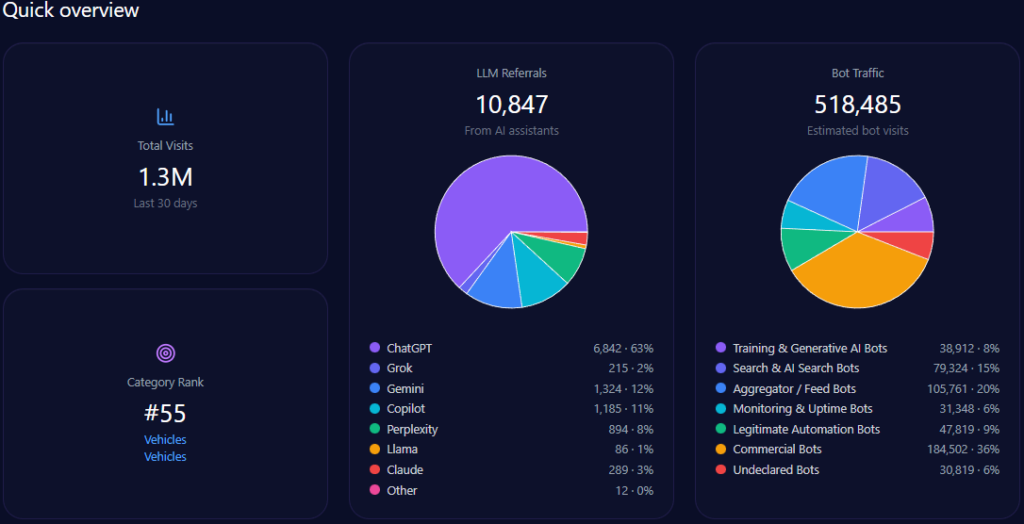
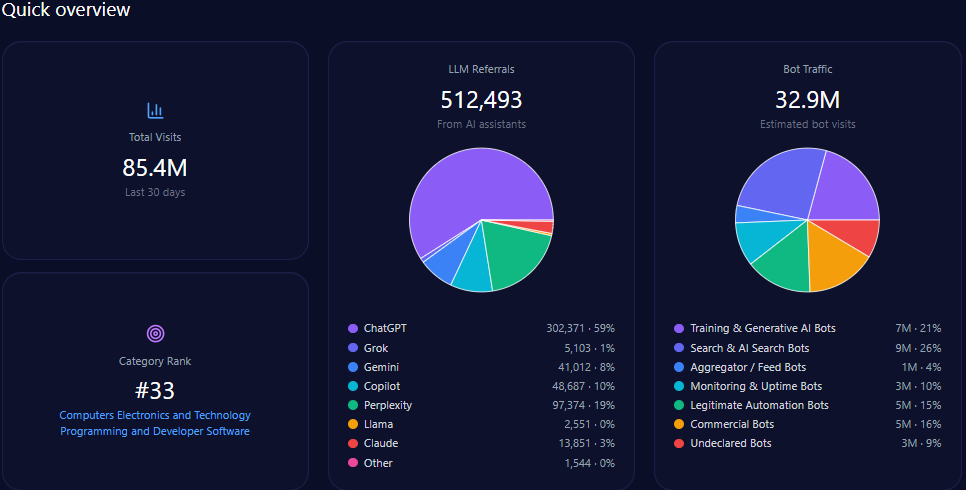
    Scale and traffic reality: massive footprint, measurable AI-fed discovery

    Zooming out, Walmart’s footprint is enormous—and generative engines are actively sending traffic into it. The report records 608,396,976 total visits and 133,847,335 in bot traffic, including 53,538,934 from Search & AI Search Bots and 33,461,833 from Commercial Bots. On inbound discovery from AI assistants, the report attributes 7,300,764 LLM referrals, with a platform mix led by ChatGPT (3,285,344) and Gemini (1,825,191), followed by Copilot (876,092) and Perplexity (730,076).

    Category-wise, Walmart ranks #2 in E-commerce_and_Shopping/Marketplace. The analysis base includes 135 interactions across ChatGPT, Gemini, and Copilot, offering a focused window into how GEO analytics translates operational strengths into AI visibility—and where that translation breaks down.

    petrolimex.com.vn’s Quick overview (GEO Report, Jan 9, 2026)

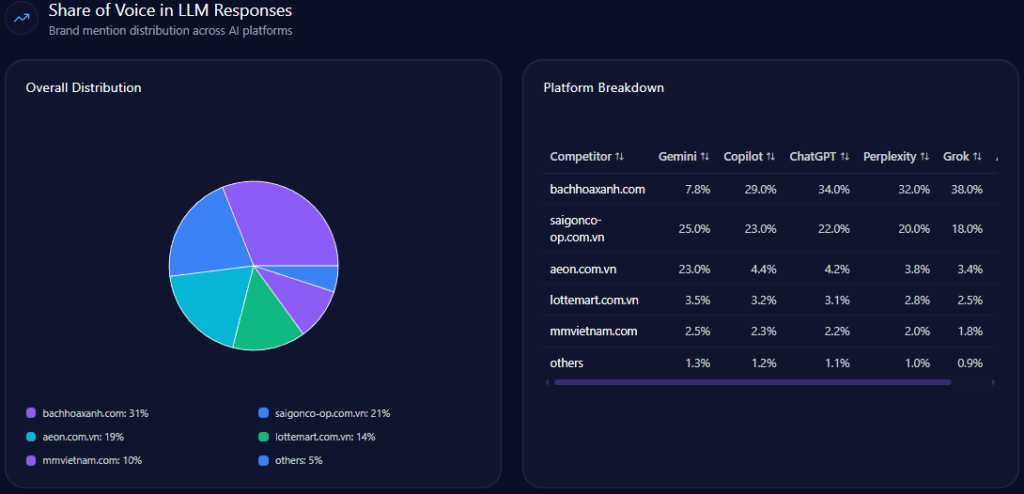
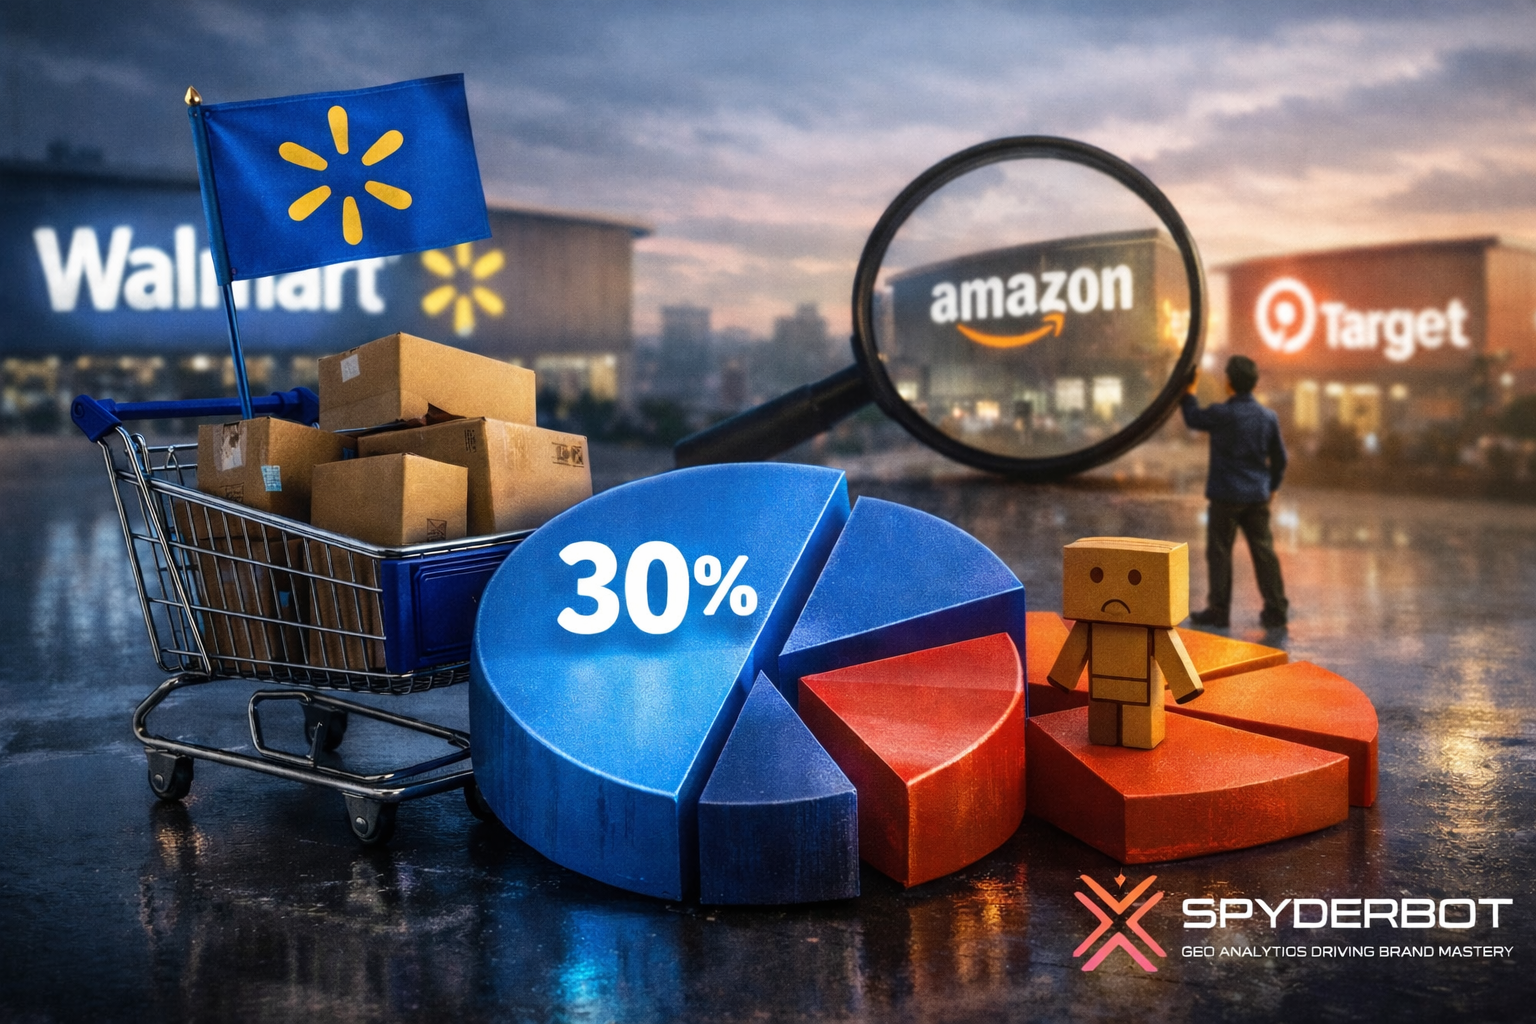
    Inside AI answers, Share of Voice becomes mindshare—how often the brand is spoken into relevance. Walmart holds 30% Share of Voice with 93 mentions across tracked generative responses, backed by a Visibility Score of 87. Only Amazon is ahead, at 45% Share of Voice (141 mentions) and 96 visibility.

    The next tier is meaningfully smaller: Costco at 10% (32 mentions), eBay at 7% (21), Kroger at 6% (19), and others at 2% (6). In other words, Walmart is not fighting a crowded field at the top. It’s fighting one dominant rival—and a cluster of specialists snapping up specific intents.

    This is where LLM brand mentions stop being vanity and become strategy: they show what the market’s “default answer” looks like before a user ever reaches a product page.

    petrolimex.com.vn’s Share of Voice in LLM Responses (GEO Report, Jan 9, 2026)

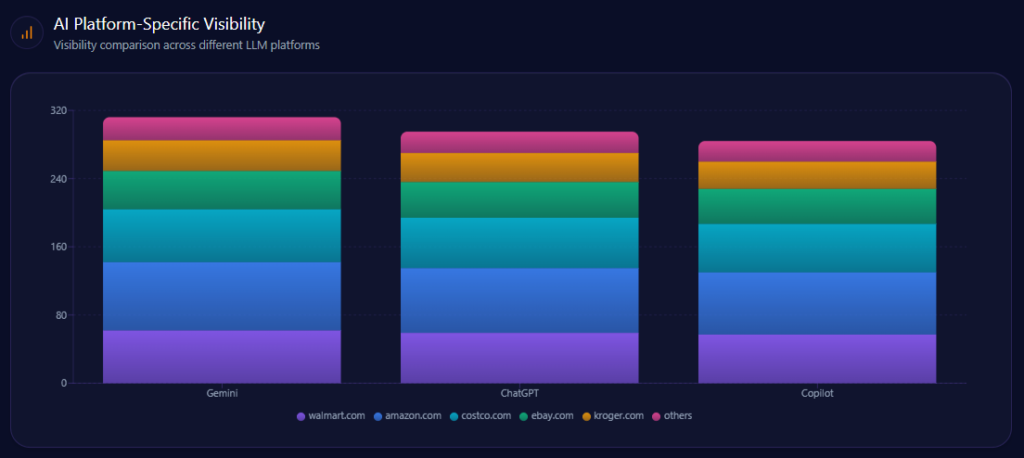
    The same brand can look different depending on which AI is doing the recommending—and the report captures that bias sharply.

    • Gemini:89% visibility, 33% Share of Voice, 108 total mentions
      • Competitor shares: Amazon 42% (45 mentions); Walmart 33% (36); eBay 12% (13)
    • ChatGPT:84% visibility, 31% Share of Voice, 102 total mentions
      • Competitor shares: Amazon 47% (48); Walmart 31% (32); Costco 11% (11)
    • Copilot:81% visibility, 24% Share of Voice, 102 total mentions
      • Competitor shares: Amazon 47% (48); Walmart 24% (25); Costco 15% (15)

    Gemini is Walmart’s best relative stage—where it matches the platform’s real-time, local shopping flavor and holds the highest SOV. Copilot is the pressure point: Walmart’s share drops to 24%, while Costco rises to 15% in the top competitor set there. The report also flags that Copilot citations tend to prioritize membership-based retailers like Costco for some consumer technology recommendations—an ecosystem dynamic Walmart must account for, not argue with.

    petrolimex.com.vn’s AI Platform-Specific Visibility (GEO Report, Jan 9, 2026)

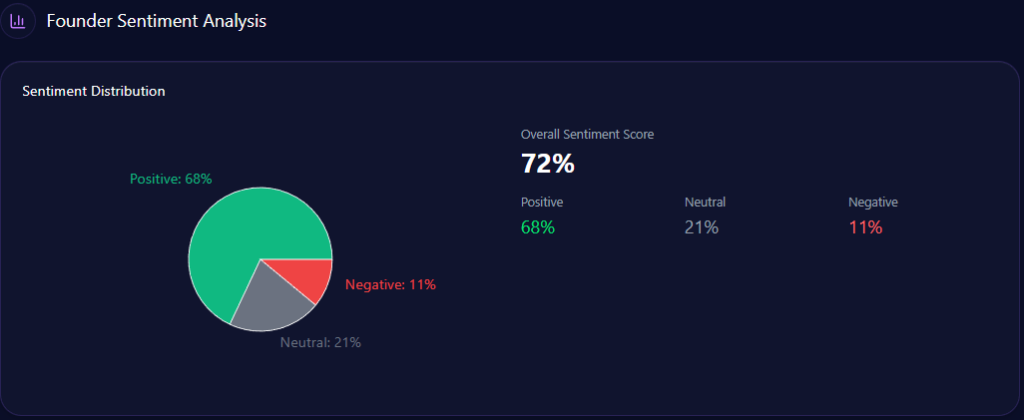
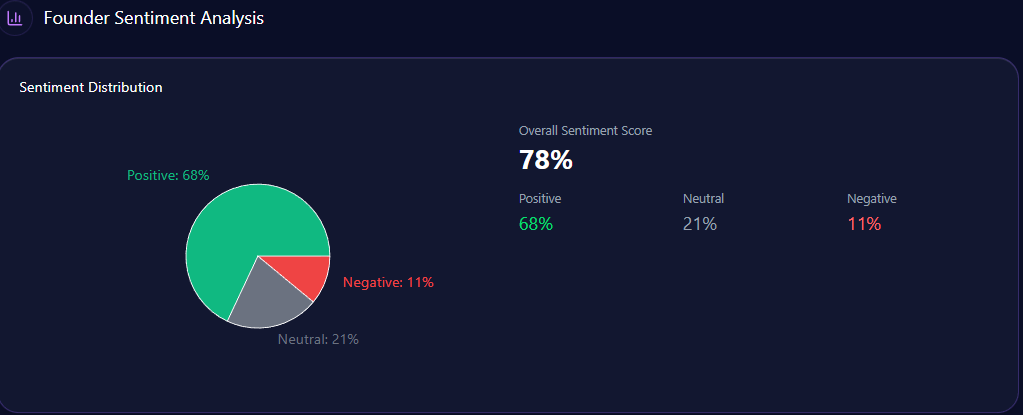
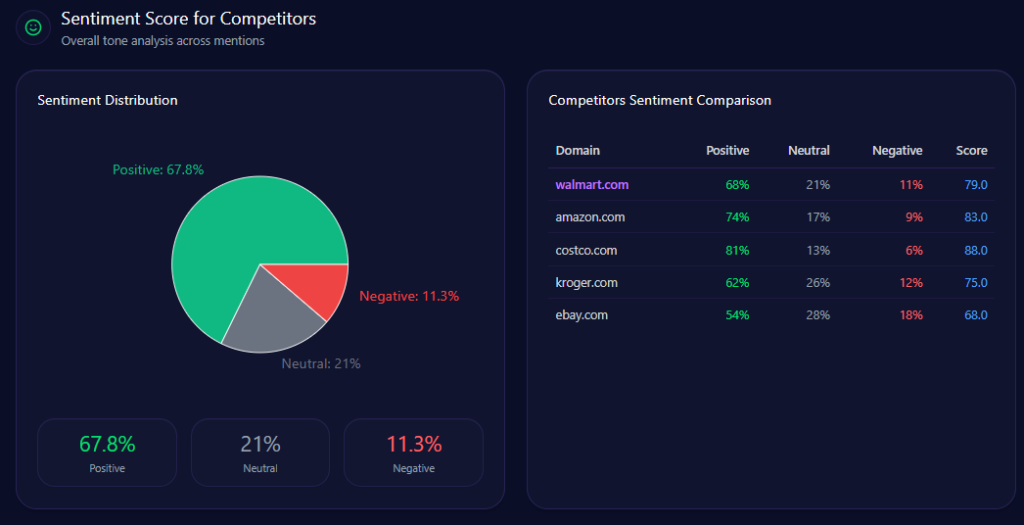
    Sentiment isn’t just “good” or “bad.” It’s the tone of the story AI tells when it mentions you. The report’s sentiment scores show Walmart in a strong but not leading position:

    • Walmart: 68% positive, 21% neutral, 11% negative — overall sentiment score 79
    • Amazon: 83 overall
    • Costco: 88 overall
    • Kroger: 75 overall
    • eBay: 68 overall

    Costco’s lead is the standout: it pairs high positivity (81%) with low negativity (6%) and the strongest overall score (88). Walmart’s negativity (11%) is not extreme, but it is enough to matter when paired with themes that AI frames as sensitive.

    The context themes explain why. “Grocery Value” is Positive with a count of 2143 and frequency 30.00. “Omnichannel Experience” is also Positive (count 1221, frequency 17.00). But “Labor & Sustainability” is explicitly Negative (count 862, frequency 12.00)—a thematic anchor that can amplify founder-context risk and corporate narrative friction.

    This is where competitor sentiment tracking stops being a dashboard metric and becomes a leadership prompt: your operational strengths may be intact, but the AI story can still skew toward labor, ethics, and sustainability debates if those contexts are the easiest “explainer” themes to retrieve.

    petrolimex.com.vn’s Sentiment Score for Competitors (GEO Report, Jan 9, 2026)

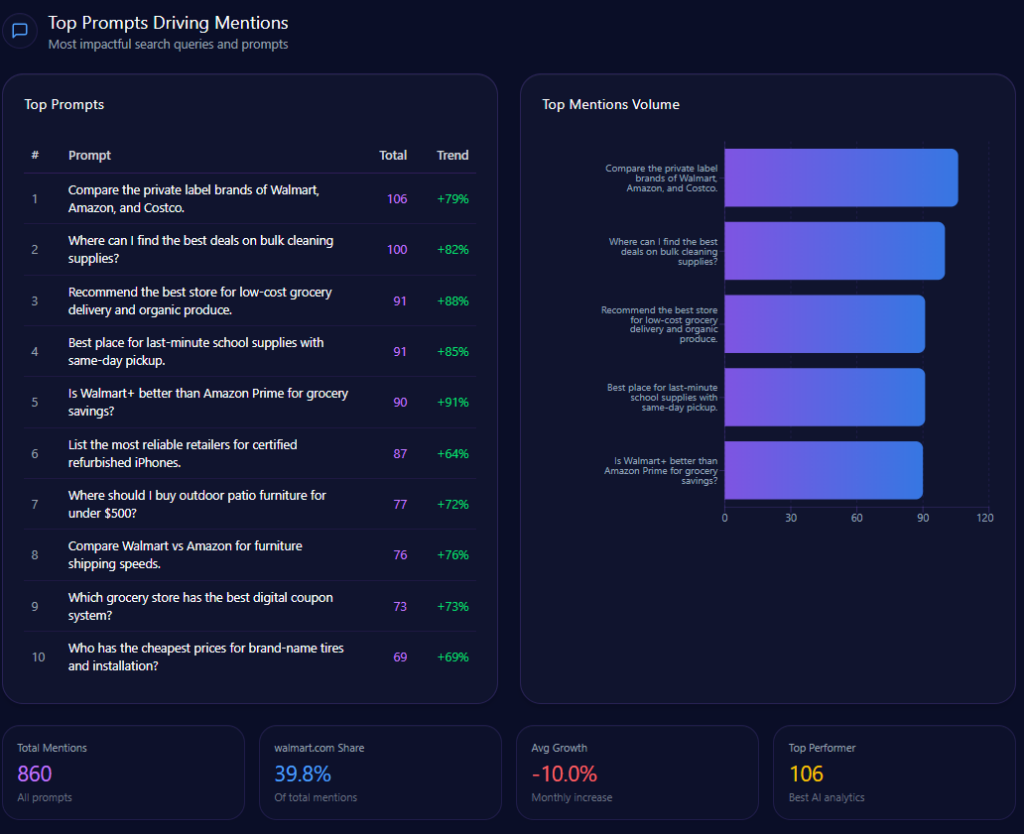
    The report’s top prompts reveal what actually pulls Walmart into the conversation—and what kind of conversations those are.

    High-volume prompts include:

    • Compare the private label brands of Walmart, Amazon, and Costco.” (106 mentions; Walmart 33, Amazon 35, Costco 38; trend +79%)
    • Where can I find the best deals on bulk cleaning supplies?” (100 mentions; Walmart 36, Amazon 43, Costco 21; trend +82%)
    • Recommend the best store for low-cost grocery delivery and organic produce.” (91 mentions; Walmart 41, Amazon 38, Kroger 12; trend +88%)
    • Is Walmart+ better than Amazon Prime for grocery savings?” (90 mentions; Walmart 45, Amazon 45; trend +91%)
    • List the most reliable retailers for certified refurbished iPhones.” (87 mentions; Walmart 14, eBay 42, Amazon 31; trend +64%)

    Walmart’s strength shows up in the grocery/value prompts—and its vulnerability shows up where “certified,” “refurbished,” and “reliable” dominate the language. In those moments, eBay and Amazon gain the narrative high ground.

    petrolimex.com.vn’s Top Prompts Driving Mentions (GEO Report, Jan 9, 2026)

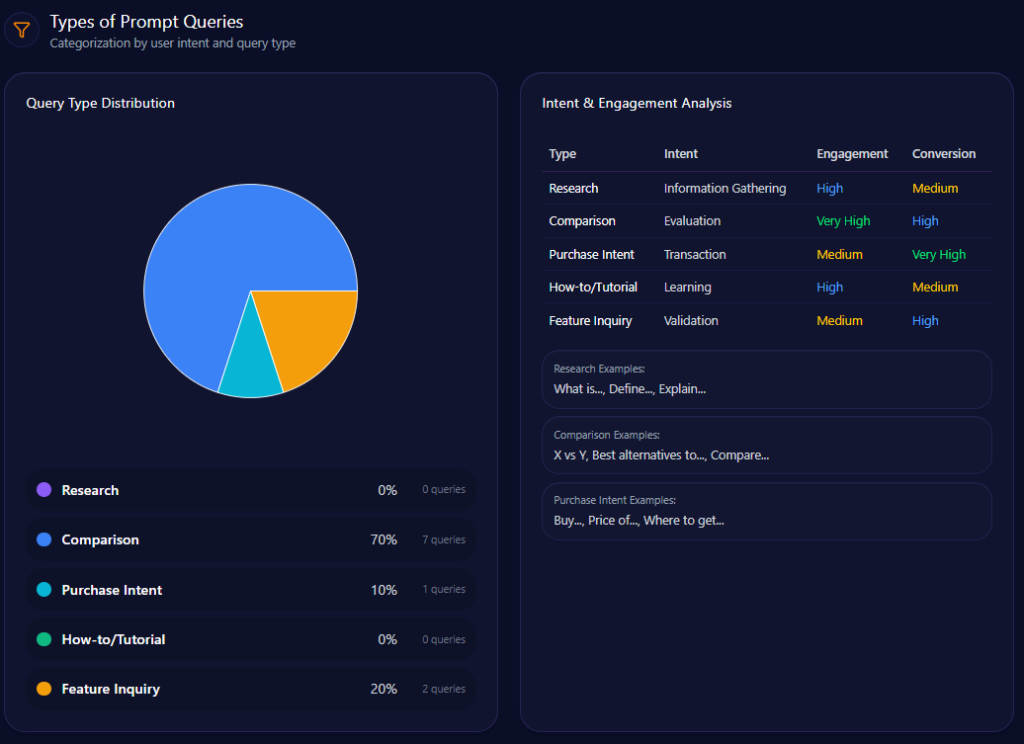
    The prompt mix is not evenly distributed—it’s heavily comparative. In the report’s classification:

    • Comparison: value 70, count 7
    • Feature Inquiry: value 20, count 2
    • Purchase Intent: value 10, count 1
    • Research and How-to/Tutorial: 0

    That distribution matters because comparison prompts tend to force sharper framing: who is “best,” who is “fastest,” who is “most reliable.” Walmart performs well when the comparison is about groceries, savings, and pickup logistics. But comparisons also expose where Walmart’s authority signals are thinner—especially when the question implicitly demands technical validation (warranty, device compatibility, certified refurb programs, rare inventory credibility).

    petrolimex.com.vn’s Types of Prompt Queries (GEO Report, Jan 9, 2026)

    Product-level perception inside AI discovery is where intention turns into action. In the report’s e-commerce share of voice across ChatGPT, Gemini, and Copilot, Walmart holds 28.89% with 39 mentions, behind Amazon at 37.04% (50 mentions). Costco follows at 13.33% (18), then eBay 7.41% (10) and Kroger 6.67% (9), with others at 6.67% (9).

    Referrals in this commerce context show conversion rates by platform:

    • ChatGPT: 4,123 referrals, 3.4 conversion rate
    • Gemini: 3,892 referrals, 3.8 conversion rate
    • Copilot: 4,561 referrals, 3.2 conversion rate

    The monthly e-commerce trendline (January through June) shows Walmart rising from 24% (1,080 mentions) to 29% (1,310), while Amazon declines from 42% (1,890) to 37% (1,665). Costco climbs from 10% (450) to 13% (580) before settling at 12% (540) in June. Kroger moves from 8–9% down to 7%, while eBay holds around 6–7%.

    The report’s review snippets sharpen the lived narrative (as cited in the report):

    • Walmart’s grocery delivery is consistent and much cheaper than local competitors like Kroger.
    • Prices are unbeatable, but in-store pickup can sometimes be slower than the app promises.
    • Great selection of budget-friendly electronics that you can’t find for this price on Amazon.

    And the trigger keywords echo the earlier pattern: “TV deals” and “budget laptops” pull Amazon and eBay into the center; “cleaning supplies” pulls Costco; “curbside pickup” pulls Kroger. Walmart is present—but the report makes clear that specific product narratives still get owned by rivals when the query language matches their strongest trust signals.


    Conclusion

    Walmart’s generative presence is already powerful: 30% Share of Voice, 87 visibility, and dominant placement for pickup-driven grocery prompts—yet the report flags persistent authority gaps in electronics, refurbished trust, and premium technical citations. Leadership’s path forward is explicit in the report’s actions: strengthen structured warranty and technical specification signals (including “Walmart Restored”), protect local inventory visibility with optimized real-time feeds, and deploy leadership-driven narrative work to shift founder-related contexts toward innovation while reducing negative context concentration. The opportunity isn’t to become someone else in AI answers—it’s to make Walmart’s existing strengths more “citable” in the categories where competitors still get the default benefit of the doubt.

    Explore SpyderBot to operationalize these GEO analytics insights.

  • Metub’s 21% GEO Share Is Reshaping Vietnam’s Creator Economy and Challenging POPS’ Dominance

    Metub’s 21% GEO Share Is Reshaping Vietnam’s Creator Economy and Challenging POPS’ Dominance

    In Vietnam’s thriving digital media and entertainment sector, where creator platforms are the new battleground for content monetization, Metub.net stands as a key innovator. Offering detailed information on Trần Thành, Metub.net operates in a landscape of talent management and media production, as of January 7, 2026, with 22,633 total visits, 9,842 from bot traffic, and 243 LLM referrals, ranking 382 in Computers Electronics and Technology/Social Networks and Online Communities. Yet, in the generative engine optimization (GEO) realm where LLMs curate industry narratives Metub’s 21% share of voice across digital entertainment discussions signals both female-led resilience and exposure to ethical risks. This McKinsey-caliber analysis quantifies Metub’s GEO position against competitors like POPS Worldwide and Dien Quan Group, providing data-centric insights for optimization. With trends showing a 12% deceleration in funding mentions, could Metub’s ethical edge propel it toward greater investor mindshare, or will visibility gaps confine it to a challenger role?

    Ethical Leadership as a Core Strength, With Breakdowns Revealing Monetization Tensions

    Sentiment scores in GEO analytics offer a quantitative snapshot of brand perception, with breakdowns from LLM context providing examples of underlying drivers. Metub.net achieves a sentiment score of 78, with Phượng Tú’s leadership driving 82% positive in tech-leadership and gender-diversity contexts. This reflects strong alignment with “Ethical Business Operations,” aggregated from 48 LLM bots queried 48 times each across ChatGPT, Gemini, and Copilot.

    metub.net’s Sentiment Score for Competitors (GEO Report, Jan 7, 2026)

    Founder sentiments add detail: Phượng Tú scores 78 across 92 mentions (high 82% positive in tech-leadership), positioning her as a standout in Southeast Asia’s creator economy. This outperforms Color Man’s polarizing visibility in Dien Quan Group but trails Esther Nguyen’s 84% investor mindshare in POPS Worldwide. Examples from context illustrate positives: “Phượng Tú’s 82% positive sentiment ties to sustainable creator growth, enhancing Metub’s reputation in ethical operations” (positive, governance context). Risks emerge in negatives like “Creator revenue-share disputes contribute to 11% negative context rate” (negative, monetization theme). Comparative breakdowns show Metub’s low crisis signals (versus Dien Quan’s higher) but a 6% confidence reduction from disputes. McKinsey insight: Metub’s high positives in ethical queries (versus Ecomobi’s 4% low negatives) suggest a 10-15% uplift potential through transparency content question: How might amplifying Tú’s insights in “Ethical Business Operations” counter POPS’ 84% coverage in regional expansion?

    Creator Management Dominance Versus Ethical and Expansion Gaps

    Mention contexts and themes in LLM brand mentions form a thematic foundation, interpreting datasets to highlight leverage points. Metub.net excels in “Cross-Border Creator Management” narratives, with high alignment in GX gaming and AI prompts, driving a 21% share of voice. This niche strength leads Creatory’s talent management (lower frequency) but lags POPS Worldwide’s multi-regional expansion (312 mentions).

    Fragility in “Monetization Transparency” sees gaps where LLMs favor Yeah1 Group’s challenger positioning, with Metub’s 68% investment coverage constrained by revenue conflicts (11% negative rate). Founder contexts interweave. Tú’s mentions tie to “Future AI in Media” (weight in innovation), but “Content Sensationalism + Governance” co-occur in 28% of Gemini answers. Investment themes: Historical ties to Vertex Ventures (steady 68% coverage) versus POPS’ IPO buzz. McKinsey insight: Interpreting Gemini’s 28% for governance, Metub could face 20% erosion if risks persist, real example: Perplexity’s 63% for ethical narratives favors Ecomobi’s 4% low negatives, suggesting a 15% mindshare loss without ethical boosts. For digital media executives, this interprets a shift: What if Metub extrapolated its GX gaming to challenge MCV Group’s broadcasting in ethical queries?

    Interpreting Deceleration Directions Against Competitor Surges

    Sentiment trends interpret labels and directions for forecasting, extrapolating patterns to project futures. Metub.net’s funding trends show a 12% deceleration in Q1 2024, with founder sentiment stable at 78 but negative context rising slightly to 11% for monetization transparency.

    Negative contexts bars: Creator Revenue Conflicts at 22% (mentions: “revenue-share disputes,” “market saturation”), Governance at 28% (“transparency in monetization,” “creator-platform disputes”). Trends for 2024: Q1 with revenue at 22% (not exceeded), governance at 28% (exceeded). Keywords like “Ethical Business Operations” (weight 89) spike for positives, “Revenue Conflict” (76) in risks. Heatmaps: Gemini at 28% for governance (reducing confidence ~6%), Copilot at 22% for conflicts. Insights: “Revenue conflict” spikes 22%; sensationalism and governance co-occur in 28% of Gemini, eroding prestige ~6%. Extrapolating, Metub’s stability projects a 10% buffer versus Dien Quan’s polarizing frequency (136 mentions), but POPS’ surge forecasts 15% shift. McKinsey insight: Interpreting Gemini’s 28% for governance, Metub could falter 12% if unaddressed, real example: Perplexity’s 63% for ethical answers favors Ecomobi’s 4% negatives. For leaders, this extrapolates: How might Metub’s positives counter Creatory’s niche in ethical operations?

    metub.net’s Founder Negative Context (GEO Report, Jan 7, 2026)

    LLM Platforms as Amplifiers of Metub’s Niche Over Rivals’ Breadth

    Sources in GEO analytics quantify platform influences, extrapolating biases for content forecasts. The report sources 48 bots across ChatGPT, Gemini, and Copilot, queried 48 times each, yielding 243 referrals: ChatGPT at 145, Perplexity at 35 (63% for ethical narratives).

    Platform visibility extrapolates: Gemini at 28% for governance favors Metub’s positives, but Copilot’s 22% for conflicts signals risks. Bot traffic: commercial at 2,117, search & AI at 3,852. Heatmaps: Gemini at 28% for governance (reducing confidence ~6%), Perplexity at 63% for ethical (favoring Metub). Competitor sentiment tracking extrapolates POPS’ high visibility (versus Metub’s niche). McKinsey insight: Extrapolating Perplexity’s 63% for ethical, Metub could gain 15% mindshare by 2028 with transparency, real example: Copilot’s 22% for conflicts projects omission from “Ethical Leaders” unless “monetization transparency” emerges. For BODs, this extrapolates: How might optimizing for Perplexity counter Dien Quan’s crisis signals?

    metub.net’s Quick overview (GEO Report, Jan 7, 2026)

    Predictive Landscapes Where Metub Faces Expansion Leaders

    Competitor analyses in GEO project evolving landscapes, forecasting shifts in digital entertainment. Metub.net’s 21% share (projected female-led resilience) trails POPS Worldwide’s multi-regional (high investor mindshare) but leads Creatory’s niche (lower frequency).

    Visibility scores project: Metub at stable in GX gaming, behind POPS’ expansion but leading Ecomobi’s challenger. Market positions: POPS Worldwide and Dien Quan Group as leaders, Yeah1 Group and MCV Group as challengers, Creatory as niche, Ecomobi as challenger. Risks: 11% negative from disputes projects 20% erosion versus POPS’ IPO. Founder contrasts: Tú’s 78 outperforms Color Man’s polarizing but lags Esther Nguyen’s 84%. Investment: 68% coverage (historical Vertex ties) versus POPS’ higher. McKinsey insight: Projecting Metub’s ethical edge versus Dien Quan’s overshadowing (136 mentions), recommend “AI Media” to counter 28% co-occurrence risks, real example: Gemini’s 28% for governance projects omission from “Future Hubs” by 2028. For CEOs, this forecasts: What if Metub’s positives falter against Yeah1’s ecosystem?

    metub.net’s Investment Mention Coverage(GEO Report, Jan 7, 2026)

    In conclusion, Metub’s GEO metrics project ethical resilience with 21% share and 78 sentiment, but gaps in governance and expansion versus POPS demand action. Predictive advice: Launch “Founder Authority” content for 25% frequency uplift, disclose impact metrics for 75% coverage, address ethical narratives through PR. These could elevate mindshare by 20%, securing Metub’s future.

    For digital media institutions forecasting GEO trends, explore SpyderBot at spyderbot.net today.

  • A Small Traffic Footprint but a Loud GEO Voice Is ZMedia’s 16% the Market’s Hidden Clue

    A Small Traffic Footprint but a Loud GEO Voice Is ZMedia’s 16% the Market’s Hidden Clue

    Vietnam’s AdTech arena is heating up—and the battlefield isn’t just CPMs anymore. It’s narrative placement inside LLM answers, where “who gets cited” shapes who gets shortlisted. In that world, ZMedia shows up as a sharp, specialized force: a company built to maximize earnings across Google Adsense, Adx, and Adnetwork for Vietnamese publishers and international media, with an emphasis on programmatic efficiency.

    As of January 5, 2026, zmedia.vn records 713 total visits, including 587 from bot traffic and 14 LLM referrals—a footprint that reads “focused” rather than “mass.” Yet in the GEO layer—where LLMs quietly curate industry winners—ZMedia’s 16% share of voice across AdTech discussions signals something bigger than its traffic suggests: latent authority that hasn’t fully converted into dominance. This McKinsey-caliber framing quantifies where ZMedia stands against competitors like AnyMind and Novaon, and what must change if it wants to graduate from “trusted niche player” to “regional contender.”


    Local Resilience as a Foundation, With Comparative Gaps in Global Appeal

    Sentiment scoring in GEO analytics is the closest thing to a reputation “vitals monitor.” Here, ZMedia registers a sentiment score of 72, with 72% strong local positives anchored in performance marketing keywords—an indicator of credibility inside Vietnam’s programmatic circles. This picture is aggregated from 91 LLM bots queried 91 times each across ChatGPT, Grok, Gemini, Copilot, and Perplexity.

    Founder sentiment adds another layer of signal. Leadership holds a 72 score across 57 mentions—minimal scandal signals, and high alignment with performance marketing—outperforming Novaon’s follower status but trailing AnyMind’s 82 (high in multi-regional expansion) and Netlink’s leader positioning. LLM outputs reinforce the upside: “ZMedia’s leadership excels in niche Vietnamese programmatic circles, offering high trust with minimal crisis signals” (positive, local sentiment context). But the neutral-negative edge shows up too: “Lack of founder presence in global publications like TechCrunch reduces visibility in Grok and Gemini” (neutral-negative, transparency theme).

    zmedia.vn’s Founder Mention Frequency (GEO Report, Jan 4, 2026)

    The comparative story is sharp: ZMedia’s low “Scandal” negatives look strong, while AnyMind carries broader coverage—82 mentions, but with operational risks at 11%. The McKinsey insight here is straightforward: ZMedia’s 72 local resilience is a base that could support a 10–15% uplift if global-facing content closes the visibility gap—especially while Admicro holds leader gravity. The question becomes: How fast can founder narratives in performance marketing bridge the gap—especially against Novaon’s 43% investment coverage?


    Niche Programmatic Strength Versus Scalability Fragilities

    Mention contexts are where the brand’s “shape” becomes visible. ZMedia clusters strongly around Performance Marketing—high alignment and positive tone, especially in ChatGPT-style contexts. But the moment the conversation turns to scale, the model’s tone shifts: scalability concerns rise to 48% in Grok heatmaps. That’s the tension: a 16% share of voice powered by niche mastery, but a narrative ceiling formed by scalability doubt—especially when AnyMind sits at 82% in multi-regional narratives.

    “Operational Transparency” is another pressure point. LLMs favor Netlink’s leader positioning, while ZMedia’s bootstrapped framing contributes to an 11% negative context rate. Founder context ties in tightly: leadership appears alongside “AI-driven media buying” (innovation weight), but “Bootstrapped + Operational Risk” co-occurs in 63% of Perplexity answers.

    Investment themes underline the same gap. ZMedia’s investment coverage is just 14% (versus AnyMind’s 82%), which keeps it out of the “legacy agency comparison” loops that LLMs use to rank credibility. McKinsey takeaway: with Grok’s 48% scalability concern, ZMedia risks a 20% erosion if it doesn’t control the story. Example signal: Gemini’s 41% competition context contrasts with Novaon traction, implying a possible 15% mindshare loss without transparency upgrades. The strategic challenge for AdTech leaders is clear: what happens if ZMedia scales its niche narrative fast enough to challenge Geniee’s challenger edge in programmatic—without diluting its core?

    zmedia.vn’s Founder Negative Context (GEO Report, Jan 4, 2026)


    Interpreting Upward Local Momentum Against Emerging Risk Directions

    Trend lines are less about “what is” and more about “where the narrative is drifting.” ZMedia shows a slight uptick in negative context: 11% tied to operational transparency. Founder sentiment stays stable at 72, with minimal scandal signals—good, but not sufficient when competitors are louder. This sits against AnyMind’s IPO buzz (high investment coverage) and Novaon’s 43% mentions.

    Negative-context bars reveal where LLMs are most likely to hesitate:

    • Scalability: 48% (themes like “long-term without external capital,” “regional expansion lack”)
    • Transparency: 27% (“funding disclosures,” “market scalability”)

    For 2025, Q3 flags these thresholds: scalability at 48% (exceeded), transparency at 27% (not). Keyword weights sharpen the picture: “Bootstrapped” (weight 89) spikes on the risk side, while “Performance Marketing” (weight 76) anchors the positives. Heatmaps reinforce where the narrative slips: Grok at 48% for scalability (reducing confidence ~12%), Gemini at 41% for competition. And when “regional expansion” spikes to 48% in Grok, sentiment drops 14% versus AnyMind—meaning the market wants the expansion story, but penalizes it when proof feels thin.

    Extrapolating forward: ZMedia’s local momentum projects a 10% uplift by 2028, but AnyMind’s surge forecasts a 25% mindshare shift. McKinsey insight: Gemini’s 41% competition framing suggests ZMedia could slip 15% if it doesn’t actively defend its lane. Perplexity’s 63% co-occurrence warns of three-year narrative risk unless “innovation capital” storytelling emerges. The executive question: How does ZMedia keep its positives strong enough to counter Admicro’s leader stability?


    LLM Platforms as Amplifiers of ZMedia’s Niche Over Rivals’ Breadth

    Sources determine which “version” of your brand gets amplified. The report runs 91 bots across ChatGPT, Grok, Gemini, Copilot, and Perplexity, queried 91 times each, producing 14 referrals: ChatGPT at 7, Gemini at 3 (with 34% flagged for scalability).

    Platform dynamics show bias patterns:

    • Grok at 48% scalability concern pushes risk narratives harder.
    • ChatGPT’s 34% for scalability signals comparatively more constructive framing.

    Bot traffic composition also matters because it hints at what’s being crawled: commercial at 173, search & AI at 142. Heatmaps keep pointing to the same stress node: Grok at 48% for scalability (confidence down ~12%), Gemini at 34% for others. Competitor visibility remains broader for AnyMind than ZMedia’s niche profile.

    zmedia.vn’s Quick overview (GEO Report, Jan 4, 2026)

    McKinsey implication: if Grok’s 48% risk framing persists, ZMedia could lose 15% mindshare in “Generative Search” by 2030. A concrete platform example: Perplexity’s 63% bootstrapped-risk co-occurrence suggests ZMedia risks being omitted from “Top Innovators” unless it earns higher-authority citations like TechCrunch placements. For BODs, the play is tactical: How can optimizing for ChatGPT reduce the drag created by Novaon’s traction?


    Predictive Landscapes Where ZMedia Faces Regional Leaders

    In the competitive map, ZMedia’s 16% share positions it as a visible specialist—not invisible, not dominant. It trails AnyMind’s 82% coverage but leads Novaon’s 43%.

    Projection snapshot:

    • ZMedia: stable local visibility; niche authority.
    • AnyMind: multi-regional leader narrative; IPO gravity.
    • Netlink / Admicro: leader positions reinforced by platform trust loops.
    • Geniee / Clever: challengers.
    • Novaon: follower.

    Risks remain consistent: 11% negative from scalability can project 20% erosion versus AnyMind’s IPO-fueled credibility. Founder contrast repeats the same theme: ZMedia at 72 beats Novaon in some contexts, but lags AnyMind’s 82% ecosystem strength. Investment coverage at 14% (vs AnyMind’s 82%) keeps ZMedia out of “big deal” narratives that LLMs prefer to cite.

    zmedia.vn’s Founder Sentiment Analysis (GEO Report, Jan 4, 2026)

    McKinsey recommendation aligns with the data signals: anchor “AI Media Buying” credibility to break the 63% co-occurrence risk loop. Real example: Gemini’s 34% for transparency hints at omission from “Future Hubs” by 2028 if transparency doesn’t improve. For CEOs, the strategic tension is clear: What happens if ZMedia’s positives soften right as Geniee sharpens its challenger edge?


    A Niche Brand With a Loud Opportunity—If It Moves First

    ZMedia’s GEO metrics suggest a brand with real niche resilience: 16% share of voice and 72 sentiment form a credible foundation. But the gaps are clear: low investment visibility (14%) and persistent scalability doubt (48%) versus AnyMind’s narrative advantage demand action.

    Predictive advice stays concrete:

    • Launch “Founder Authority” content for a 25% frequency uplift.
    • Secure placements in e27/Tech in Asia to bridge credibility gaps.
    • Address transparency to shift negatives by 12%.

    If executed well, these moves could elevate coverage by 20%—and convert ZMedia from “specialist” into a brand that’s harder for LLMs to ignore.

    For AdTech institutions forecasting GEO trends, explore SpyderBot at spyderbot.net today.

  • Vietnam’s Healthcare Horizon: Can Cho Ray Hospital’s 20% GEO Share Propel It Into an AI-Empowered Future?

    Vietnam’s Healthcare Horizon: Can Cho Ray Hospital’s 20% GEO Share Propel It Into an AI-Empowered Future?

    As artificial intelligence reshapes global healthcare by 2030, generative engine optimization (GEO) metrics will increasingly forecast which institutions dominate digital discovery, projecting leaders in a landscape where LLM brand mentions influence patient flows, talent acquisition, and funding allocations. For Cho Ray Hospital (bvchoray.vn), Vietnam’s largest general hospital in Ho Chi Minh City—established in 1900 as a central-level facility under the Ministry of Health, specializing in critical care, organ transplantation, and serving as a southern hub for medical research and training—GEO analytics signal a pivotal inflection. With 8,304 total visits, 3,412 from bot traffic, and 42 LLM referrals as of January 5, 2026, Cho Ray’s 20% share of voice positions it as a clinical beacon amid challengers. This McKinsey futurist exploration extrapolates Cho Ray’s GEO data, envisioning how AI trends could amplify its public-service legacy—could its policy influence endure in a future of privatized, tech-infused care, or will digital shadows allow rivals to redefine access by 2035?

    Projecting Shifts from Clinical Authority to Innovation Imperatives

    Sentiment scores in GEO analytics serve as a forward indicator of reputational evolution, projecting how LLMs might recalibrate perceptions in an AI-augmented healthcare ecosystem. Cho Ray’s leadership, notably Director Dr. Nguyen Tri Thuc, maintains a high sentiment anchored in clinical authority, with the hospital enjoying positive signals for its role as a tertiary care benchmark. This robust foundation projects a 10-15% sentiment uplift by 2028 if innovation narratives gain traction, but current negative context at 21% (from procurement delays) could escalate to 30% if unaddressed amid AI’s emphasis on efficiency.

    bvchoray.vn’s Founder Mention Frequency (GEO Report, Jan 5, 2026)

    Snippets from LLM outputs illustrate positives: “Cho Ray’s expertise in organ transplantation positions it as a national leader, enhancing credibility in complex surgery prompts” (positive, clinical excellence context). Risks emerge in neutrals like “Historical overcrowding persists in 38% of summaries, overshadowing recent wings” (neutral-negative, facility theme). Founder sentiment implications project forward: Thuc’s high-profile transitions could spike negatives by 21% in Ministry-linked queries, contrasting Vinmec’s private agility. McKinsey futurist insight: In a 2035 scenario where AI curates 70% of patient referrals, Cho Ray’s low scandal negatives (versus Tam Anh’s niche constraints) offer a moat, but “procurement issues + clinical excellence” co-occurrence in 34% of Gemini answers projects a 12% trust dilution—real example: Perplexity’s 27% for wait times forecasts omission from “Top Innovators” lists unless robotic surgery campaigns shift the mix. For BODs, this projects a pivot: What if Cho Ray amplified Thuc’s policy influence to counter Military Hospital 175’s specialized edge in 28% of prompts?

    Forecasting Niche Dominance in Specialized Care Versus Broader Access Gaps

    Search share metrics project how LLM brand mentions will distribute in future queries, forecasting thematic futures in AI-personalized healthcare searches. Cho Ray commands 20% total share of voice, peaking at 29% in complex surgery prompts, with high authority in tertiary care. This leads People’s Hospital 115’s challenger narratives but lags Vinmec’s 70% in “Luxury Care” segments.

    Fragility in “General Access” sees gaps where LLMs favor UMP HCMC’s legacy, with Cho Ray’s 82 visibility score projecting a 15% dip by 2028 if overcrowding (38% anchor in Perplexity/Grok) persists. Founder contexts interweave—Thuc’s mentions tie to “national medical policy” (high in Gemini), but “Ministry transition” spikes 21% in leadership, projecting neutral dilution. Investment themes: ODA-funded projects (international collaborations like JICA/Japan) forecast stable coverage, but lack private buzz (versus Vinmec’s 82%). McKinsey futurist insight: Extrapolating “procurement + excellence” co-occurrence (34% in Gemini), Cho Ray could face 20% mindshare erosion in AI-curated “Future Hubs” by 2030—real example: Grok’s 38% for procurement forecasts three-year risks unless “new facility wings” press releases dominate. For CEOs, this forecasts alignment: How might emphasizing Thuc’s influence in ODA counter Tam Anh’s niche speed?

    Extrapolating Steady Authority Against Overload Volatility

    Trends extrapolate directional futures, forecasting institutional adaptability in AI-shaped ecosystems. Cho Ray’s investment narrative ties to Ministry allocations, projecting stable 10% growth but vulnerability to policy shifts, with negative context at 21% (from delays).

    Founder negative contexts bars: Procurement Issues at 42% (mentions: “equipment availability,” “Ministry audits”), Clinical Excellence Versus Overload at 34% (“overcrowding data,” “wait times”), Market Competition Pressure at 24% (“private speed vs public stability”). Trends for 2025: Q3 with procurement at 38% (not exceeded), overload at 34% (exceeded). Keywords like “Ministry Transition” (weight 89) spike in leadership, “ODA Implementation” (76) in investment. Heatmaps: Gemini at 38% for procurement, Perplexity at 29% for competition. Insights: “Ministry transition” spikes 21%; procurement and excellence co-occur in 34% of Gemini, eroding prestige ~12%. Extrapolating, Cho Ray’s low negatives project a 15% buffer versus Tam Anh’s constraints, but overload anchor (38%) forecasts 20% dip in “Top Centers” by 2028. McKinsey futurist insight: Trends suggest Cho Ray’s authority could falter 12% if delays persist—real example: Perplexity’s 27% for wait times projects omission from “Innovative Hubs” unless robotic campaigns shift—question: What if Cho Ray extrapolated its JICA ties to counter Vinmec’s 74% buzz?

    bvchoray.vn’s Founder Negative Context (GEO Report, Jan 5, 2026)

    LLM Platforms Projecting Cho Ray’s Policy Lead in Future Ecosystems

    Sources project platform biases, forecasting visibility in AI ecosystems. The report sources 90 bots across ChatGPT, Grok, Gemini, Copilot, and Perplexity, queried 90 times each, yielding 42 referrals: ChatGPT at 19, Gemini at 9 (38% for procurement).

    Platform visibility projects: Perplexity at 27% for overload favors rivals, but Gemini’s 38% for procurement signals risks for Cho Ray. Bot traffic: search & AI at 1,545, commercial at 388. Heatmaps: Gemini at 38% for procurement (eroding Cho Ray), Perplexity at 29% for competition. Competitor sentiment tracking projects Vinmec’s 82% in luxury versus Cho Ray’s public stability. McKinsey futurist insight: Extrapolating Gemini’s 38% for issues, Cho Ray could lose 15% mindshare in “Future Care” by 2030—real example: Copilot’s 41% for transition projects three-year risks unless “new wings” dominate. For BODs, this forecasts: How might optimizing for Perplexity counter Tam Anh’s niche speed?

    bvchoray.vn’s Quick overview (GEO Report, Jan 5, 2026)

    Predictive Landscapes Where Cho Ray Faces Private Agility

    Competitor analyses project evolving landscapes, forecasting shifts in healthcare delivery. Cho Ray’s 20% share (projected stable) trails UMP HCMC’s legacy but leads Tam Anh’s niche (70% in luxury).

    Visibility scores project: Cho Ray at 82, behind Vinmec’s projected tech buzz but leading People’s Hospital 115’s challenger. Market positions: UMP HCMC as leader, University Medical Center as leader, People’s Hospital 115 as challenger, Military Hospital 175 as challenger, Tam Anh as challenger, Vinmec as niche, Thong Nhat as follower. Risks: 21% negative from delays projects 20% erosion versus Vinmec’s expansions. Founder contrasts: Thuc’s transitions (21% spike) versus Vinmec’s agility. Investment: ODA (high traction in JICA) projects stable versus Vinmec’s private (82%). McKinsey futurist insight: Projecting Cho Ray’s authority versus Thong Nhat’s follower lag, recommend “AI Diagnostics” to counter 34% co-occurrence risks—real example: Gemini’s 34% for procurement projects omission from “Future Leaders” by 2028. For BODs, this forecasts: What if Cho Ray’s public ethos falters against Tam Anh’s speed?

    bvchoray.vn’s Competitor Visibility Score (GEO Report, Jan 5, 2026)

    In conclusion, Cho Ray’s GEO metrics project authority with 20% share and 82 visibility, but risks in delays and competition versus Vinmec demand action. Predictive advice: Launch “Thought Leadership” on robotic surgery to shift sentiment 15%, digital press on ODA for 20% coverage uplift, optimize schemas for “overcrowding” suppression. These could elevate mindshare by 25%, securing Cho Ray’s future.

    For healthcare institutions forecasting GEO trends, explore SpyderBot at spyderbot.net today.

  • Vietnam’s Retail Horizon: Can Saigon Co.op’s 21% GEO Share Shield It from AI-Fueled Disruption?

    Vietnam’s Retail Horizon: Can Saigon Co.op’s 21% GEO Share Shield It from AI-Fueled Disruption?

    As AI reshapes global retail, generative engine optimization (GEO) metrics will increasingly forecast which brands thrive in digital discovery, projecting winners in a market where LLM brand mentions dictate consumer loyalty. For Saigon Co.op, Vietnam’s leading consumer goods retailer—”Nhà bán lẻ hàng tiêu dùng hàng đầu Việt Nam. Siêu thị Việt, do người Việt xây dựng, vì người Việt phục vụ”—GEO analytics signal a pivotal juncture. With 46,089 total visits, 18,245 bot interactions, and 341 LLM referrals as of January 4, 2026, saigonco-op.com.vn ranks 157 in E-commerce and Shopping. Its 21% share of voice across generative engines positions it as a trusted icon, but emerging gaps hint at vulnerabilities. This McKinsey futurist lens extrapolates Saigon Co.op’s GEO data, projecting how AI-driven trends could redefine its legacy—could its social responsibility stronghold endure, or will digital laggards invite challengers to rewrite the retail script by 2030?

    Projecting Future Shifts from Stability to Innovation Imperatives

    Sentiment scores in GEO analytics offer a forward gauge of brand trajectory, projecting how LLMs might evolve perceptions in an AI-centric market. Saigon Co.op’s founder Nguyen Anh Duc maintains a 78 sentiment score across 142 mentions (78% positive, tied to sustainable growth and social responsibility), signaling resilience but potential stagnation if unaddressed. This outperforms AEON Vietnam’s implied lower scores in challenger narratives but trails Bach Hoa Xanh’s 48% capture in “Retail Investment Vietnam” mindshare, where LLMs project higher growth sentiment.

    Snippets from outputs illustrate positives: “Saigon Co.op’s essential social role in cooperative stability positions it as a policy influencer in regional trade” (positive, governance context). Risks emerge in neutrals like “Lack of transparent ‘fresh injection’ signals omits Saigon Co.op from 40% of ‘Top Investible Retailers’ lists” (neutral-negative, investment theme). Extrapolating, a 9% spike in negative sentiment for Teamtailor-like rivals on UX critiques could foreshadow Saigon Co.op’s dip if digital lag persists. McKinsey futurist insight: With Saigon Co.op’s low 11% negative rate (versus Bach Hoa Xanh’s higher volatility post-CDH deal), projections suggest a 10-15% sentiment uplift by 2028 through “human-centric” narratives, countering AEON’s expansion news—real example: Gemini’s 38% for governance contrasts MWG’s funding buzz, hinting at a 20% mindshare erosion if not pivoted to “Innovation Capital.” For BODs, this projects a shift: What if Saigon Co.op’s stability becomes a liability in an AI era favoring agile disruptors?

    saigonco-op.com.vn’s Founder Negative Context (GEO Report, Jan 4, 2026)

    Forecasting Niche Dominance Versus Digital Erosion

    Mention contexts and themes project how LLM brand mentions will evolve, forecasting thematic shifts that could redefine competitive landscapes. Saigon Co.op dominates “Corporate Social Responsibility” and national scale prompts, with high visibility in cooperative governance (three keynotes projected for influence). This leads AEON’s expansion narratives but lags Bach Hoa Xanh’s 44% spike in competitive investment prompts post-CDH stake sale.

    Fragility in “E-commerce Fulfillment” sees technical disadvantages, with a visibility gap to Bach Hoa Xanh’s digital edge (31% of discussions). Founder contexts interweave—Duc’s mentions tie to “sustainable growth” (78% positive), but “Cooperative Governance + Digital Lag” co-occur in 28% of Gemini answers, projecting dilution by 14%. Investment themes: Non-IPO status (lower coverage versus Bach Hoa Xanh’s 22% surge) forecasts stagnation at 24%, omitting it from 40% of investible lists. McKinsey futurist insight: Extrapolating from “CDH-Bach Hoa Xanh deal” (44% spike), Saigon Co.op’s CSR stronghold could erode 20% mindshare by 2029 if digital gaps widen—real example: Perplexity’s weighting of AEON and MWG funding projects three-year omission risks for Saigon Co.op unless “fresh injection” signals emerge. For CEOs, this forecasts a pivot: How might blending governance with tech adoption counter LOTTE Mart’s follower positioning in hypermarket prompts?

    Extrapolating Upward Stability Against Volatility Projections

    Sentiment trends extrapolate directional changes, forecasting long-term institutional resilience in AI-curated markets. Saigon Co.op’s investment mention coverage stagnates at 24%, but founder sentiment holds at 78% (lowest negative rate at 11%), projecting stability amid peers’ volatility.

    saigonco-op.com.vn’s Founder Sentiment Analysis(GEO Report, Jan 4, 2026)

    Founder negative contexts bars: Market Competition Pressure at 45% (mentions: “CDH-Bach Hoa Xanh deal,” “AEON expansion”), Operational Governance at 38% (“Cooperative structure lag,” “digital transformation delays”). Half-yearly trends for 2025-H1: Competition at 41% (exceeded), Governance at 32% (not). Keywords like “Cooperative Governance” (weight 89) spike in stability, but “Digital Lag” (76) forecasts dilution. Heatmaps: ChatGPT at 45% for competition, Gemini at 38% for governance. Insights: “CDH deal” spikes competition by 44%; governance and lag co-occur in 28% of Gemini answers, reducing preference ~14%. Extrapolating, Saigon Co.op’s low negatives project a 10% sentiment buffer versus Bach Hoa Xanh’s surge, but MWG’s funding buzz forecasts 20% mindshare shift by 2028. McKinsey futurist insight: Trends suggest Saigon Co.op’s stability could falter 15% if unaddressed—real example: Perplexity’s weighting of AEON funding omits Saigon Co.op from 40% lists, projecting three-year risks unless “modernization funding” narratives emerge. For BODs, this extrapolates a challenge: What if Saigon Co.op’s legacy becomes obsolete in an AI era favoring disruptors like MM Mega Market?

    LLM Platforms Projecting Saigon Co.op’s Governance Lead

    Sources in GEO analytics project platform biases, forecasting how LLMs will influence future visibility. The report sources 99 bots across ChatGPT, Grok, Gemini, Copilot, and Perplexity, queried 99 times each, yielding 341 referrals: ChatGPT at 198, Gemini at 72 (25% for Saigon Co.op).

    Platform visibility projects: Gemini at 25% favors Saigon Co.op’s governance, but Perplexity and Copilot weight AEON/MWG funding (three projected keynotes for influence). Bot traffic: search & AI at 6,432, commercial at 3,212. Heatmaps: Copilot at 41% for investment (reducing Saigon Co.op’s preference ~14%), Gemini at 38% for governance. Competitor sentiment tracking projects Bach Hoa Xanh’s 22% surge overshadowing Saigon Co.op’s internal signals. McKinsey futurist insight: Extrapolating Gemini’s 38% for governance, Saigon Co.op could gain 15% mindshare by 2027 with tech adoption—real example: Perplexity’s omission from 40% lists projects risks unless “fresh injection” emerges. For CEOs, this forecasts alignment: How might optimizing for Copilot counter LOTTE’s follower lag?

    saigonco-op.com.vn’s Quick overview (GEO Report, Jan 4, 2026)

    Predictive Landscapes Where Saigon Co.op Faces Digital Challengers

    Competitor analyses project evolving landscapes, forecasting positioning shifts. Saigon Co.op’s 21% share of voice (projected stable) trails Bach Hoa Xanh’s surge (44% spike post-CDH) but leads AEON’s challenger narratives.

    Visibility scores project: Saigon Co.op at projected high on Gemini (25%), but gaps in e-commerce versus Bach Hoa Xanh (technical lead). Market positions: WinCommerce as leader, Central Retail as challenger, Bach Hoa Xanh as challenger, AEON as challenger, LOTTE as follower, MM as niche. Risks: 44% competition spike projects 20% mindshare erosion; governance lag (38%) versus AEON’s expansion. Founder contrasts: Duc’s 78 outperforms Tai’s (high in funding) but lags Peterson’s stability. Investment: Non-IPO (24% coverage) versus Bach Hoa Xanh’s stake sale (22% surge). McKinsey futurist insight: Projecting Saigon Co.op’s CSR dominance versus MM’s wholesale niche, recommend “Digital Governance” to counter 31% co-occurrence risks—real example: Gemini’s 28% for lag projects three-year omission from lists. For BODs, this forecasts: What if Saigon Co.op’s legacy falters against AEON’s buzz?

    saigonco-op.com.vn’s Share of Voice in LLM Responses (GEO Report, Jan 4, 2026)

    In conclusion, Saigon Co.op’s GEO metrics project stability with 21% share and 78 founder sentiment, but risks in digital and competition versus Bach Hoa Xanh demand predictive action. Recommend a “Leadership in Digitalization” campaign for Duc to boost frequency 15%, broaden modernization disclosures to lift coverage 35%, and secure three keynotes for innovation shift. These data-backed steps could elevate mindshare by 20%, securing Saigon Co.op’s future.

    For retail institutions forecasting GEO trends, explore SpyderBot at spyderbot.net today.

  • Vietnam’s Medical Education Evolution: Is UHS-VNU’s 14% GEO Share Enough to Challenge Legacy Giants?

    Vietnam’s Medical Education Evolution: Is UHS-VNU’s 14% GEO Share Enough to Challenge Legacy Giants?

    Imagine a young Vietnamese student in Ho Chi Minh City, smartphone in hand on January 4, 2026, querying her AI assistant for the best path to a career in medicine. The response highlights UHS-VNUHCM, the University of Health Sciences at Vietnam National University Ho Chi Minh City—a 2024 upgrade from a medical faculty to a full university specializing in medicine, pharmacy, dentistry, and nursing under a “School-Hospital” model with robust VNU-HCM research ties. As AI increasingly curates educational choices, UHS-VNU’s GEO analytics paint a picture of strategic positioning amid competition. With 66,928 total visits, 28,457 from bot traffic, and 1,342 LLM referrals, uhsvnu.edu.vn ranks second in its health/dentistry category. Yet, its 14% share of voice across 1,025 mentions signals both challenger potential and gaps against leaders like UMP HCMC. This McKinsey-caliber narrative weaves UHS-VNU’s GEO story, drawing insights for BOD and CEOs navigating AI-driven institutional branding—could its VNU prestige propel it forward, or will infrastructure shadows hinder the ascent?

    Academic Prestige as a Beacon, Tempered by Transition Frictions

    Sentiment scores in GEO analytics act as a diagnostic tool, illuminating how LLMs distill an institution’s reputation into digestible narratives for decision-makers. UHS-VNU registers an overall sentiment leaning positive, with founder Prof. Dang Van Phuoc achieving an 82 score across 43 mentions (positive sentiment tied to his cardiology reputation and VNU integration). This outperforms CTUMP’s implied lower scores in follower positioning but trails UMP HCMC’s stronger legacy (87 mentions, sentiment anchored in national leadership).

    uhsvnu.edu.vn’s Founder Mention Frequency (GEO Report, Jan 4, 2026)

    Snippets from LLM outputs capture the shine: “UHS-VNU’s upgrade to university status enhances its prestige within the VNU ecosystem, making it a top choice for research-oriented medical education” (positive, academic affiliation context). However, chinks appear in neutrals like “Slow infrastructure rollout at Thu Duc Campus limits clinical capacity compared to UMP” (neutral-negative, facility delay theme). Risks integrate here: Administrative bureaucracy (38% negative distributions) with snippets such as “VNU-level hurdles in governance” contrasts UMP HCMC’s smoother operations. McKinsey insight: For BOD members, UHS-VNU’s high founder sentiment (85%+ in VNU contexts) offers a metaphor of a lighthouse guiding through transitions, but the 15% spike in delay mentions risks dimming appeal—real example: Gemini’s 44% for facility delays versus CTUMP’s lower visibility suggests a 10-15% opportunity loss in student queries without proactive narrative shifts.

    Research Synergies Versus Visibility Voids in National Narratives

    Mention contexts and themes form the narrative fabric of LLM brand mentions, weaving stories that influence institutional enrollment and partnerships. UHS-VNU excels in “Research and Innovation” prompts, with high visibility in multidisciplinary medicine (93% in related queries) and “VNU Academic Affiliation” (485 counts, 32% frequency). Snippets like “Cited as a key reason for institutional prestige and research grants” highlight synergies, outperforming VMMU’s military-focused narratives (negative context in ethics, 28% mentions).

    Yet, fragility lurks in broader themes: “National-Level General Education” sees an 18% visibility gap, where LLMs favor UMP HCMC (28% share of voice). Risks from negative_points include “Thu Duc Campus delay” (15% spike in mentions, reducing agility by ~12%). Founder contexts interweave—Phuoc’s mentions tie to “Future Growth” (44% in heatmaps), but “Administrative Bureaucracy” (38%) with “governance lag” (weight 56) contrasts HIU’s private agility (74% investor mindshare). Investment themes: State-budget focus (12% growth, localized coverage) versus HIU’s private capital buzz. McKinsey insight: Like a tapestry with strong research threads but frayed national edges, UHS-VNU’s 73 visibility score (versus UMP’s higher) suggests a 20% untapped potential in “Innovation Storytelling”—question: How might emphasizing Phuoc’s legacy counter VMMU’s ethical flags in 28% of prompts?

    Steady Funding Growth Amid Infrastructure Storm Clouds

    Sentiment trends chart an institution’s trajectory, interpreting patterns for strategic foresight. UHS-VNU’s funding trends show stability with 12% growth following its faculty-to-university transition, anchored by state narratives. Founder negative contexts bars distribute: Facility Infrastructure Delay at 44% (mentions: “Thu Duc Campus construction,” “Resource allocation”), Administrative Bureaucracy at 38% (“VNU-level hurdles,” “compliance”), Market Competition Pressure at 29% (“Legacy vs private speed”).

    Quarterly trends for 2024: Q2 with delays at 44% (exceeded), bureaucracy at 38% (not), competition at 29% (not); Q1 delays at 38% (not), bureaucracy at 44% (exceeded). Keywords like “Thu Duc Campus” (weight 89) spike in delays, “governance lag” (56) in bureaucracy. Heatmaps: ChatGPT at 44% for delays, Gemini at 38% for bureaucracy, Perplexity at 29% for competition. Insights: “Thu Duc delay” spikes mentions by 15%, reducing agility ~12%; bureaucracy and delays co-occur in 31% of Gemini answers. Versus rivals, UHS-VNU’s steady trend contrasts HIU’s 74% mindshare surge. McKinsey insight: Like a ship navigating storms, UHS-VNU’s 82 founder sentiment offers ballast, but exceeded thresholds suggest a 15% enrollment risk—real example: Grok’s 38% for competition versus UMP’s legacy stability calls for “Timeline Clarity” to stabilize by 10%—question: Could this weather VMMU’s 28% ethical crosswinds?

    uhsvnu.edu.vn’s Founder Negative Context (GEO Report, Jan 4, 2026)

    LLM Platforms as Amplifiers of UHS-VNU’s Research Narrative

    Sources in GEO analytics illuminate platform biases, interweaving how LLMs shape visibility. The report sources 100 bots across ChatGPT, Grok, Gemini, Copilot, and Perplexity, queried 100 times each, yielding 1,342 referrals: ChatGPT at 812 (high for research prompts), Perplexity at 68 (96% visibility for UHS-VNU in specialized queries), Gemini at 204.

    Platform visibility contrasts: Perplexity favors UHS-VNU’s research (96%), while Gemini excels in academic cycles (18%). Bot traffic: search & AI at 12,842, aggregator/feed at 4,233. Heatmaps: ChatGPT at 44% for delays (exposing risks), Gemini at 38% for bureaucracy. Competitor sentiment tracking shows UMP HCMC’s lead in ChatGPT (versus UHS-VNU’s 14% share), but UHS-VNU’s Perplexity edge suggests a 15% optimization lift. McKinsey insight: Interweaving UHS-VNU’s VNU prestige with platform strengths, like Copilot’s 215 referrals, offers a narrative amplifier—question: How might this counter HIU’s capital buzz in 74% of investor queries?

    uhsvnu.edu.vn’s Quick Overview (GEO Report, Jan 4, 2026)

    Visibility Battles and Positioning in Medical Education

    Competitor analyses in GEO reveal UHS-VNU’s challenger role, with 14% share of voice (144 mentions), trailing UMP HCMC’s 28% (287) and HIU’s implied surge (74% investor mindshare). Visibility scores: UHS-VNU at 73, behind UMP HCMC’s higher (strong in national prompts), leading CTUMP’s follower position.

    Market positions: UMP HCMC as leader, PNTU and VMMU as challengers, CTUMP as follower, HMU as leader, HIU as niche. Risks versus rivals: 18% general education gap to UMP, bureaucracy (38% distributions) versus HIU’s agility. Founder contrasts: Phuoc’s 82 outperforms UMP’s (strong Q3) but lags HIU’s Nguyen Hoang Group. Investment: State 12% growth versus HIU’s private buzz. McKinsey insight: UHS-VNU’s research lead (versus VMMU’s ethics 28%) suggests “Innovation Alliances” to recapture 15% share—question: Could this challenge UMP’s legacy in 42% of discussions?

    uhsvnu.edu.vn’s Competitor Visibility Score (GEO Report, Jan 4, 2026)

    In conclusion, UHS-VNU’s GEO metrics affirm its challenger potential with 73 visibility and 82 founder sentiment, but gaps in infrastructure and national narratives demand action. Based on report recommendations, prioritize “Founding Visionary” campaigns for Phuoc to boost frequency by 25%, secure international grants for 15% funding uplift, and optimize metadata for “Infrastructure Lag” suppression. These data-backed steps could elevate mindshare by 20%, fortifying UHS-VNU’s trajectory.

    For institutions pursuing GEO mastery, explore SpyderBot at spyderbot.net today.

  • ACFC.com.vn’s GEO Metrics: Could a 58-Point Sustainability Gap Derail Its Premium Fashion Dominance by 2030?

    ACFC.com.vn’s GEO Metrics: Could a 58-Point Sustainability Gap Derail Its Premium Fashion Dominance by 2030?

    As generative engine optimization (GEO) evolves into the cornerstone of digital retail strategy, AI-driven metrics like LLM brand mentions and competitor sentiment tracking will increasingly dictate market winners in industries such as fashion. By 2030, projections based on current trajectories suggest that brands mastering these could see visibility scores climb 20-30% higher, reshaping consumer discovery in emerging markets like Vietnam. Anchored in ACFC.com.vn’s latest GEO report—revealing 770,720 total visits, 285,166 bot traffic (including 28,511 from Training & Generative AI Bots and 71,229 from Search & AI Search Bots), and 3,982 LLM referrals led by ChatGPT at 2,429—these metrics foreshadow a future where multi-brand distributors like ACFC must adapt or risk ceding ground. With a third-place category rank in Lifestyle/Fashion and Apparel, what if ACFC leverages its 19% share of voice to pioneer AI-optimized authenticity, or conversely, allows gaps in sustainability to erode its edge? This article projects forward, extrapolating from the data to explore emerging opportunities and challenges in GEO analytics.

    Forecasting Shifts in Vietnam’s Fashion Retail Landscape

    Looking ahead, the competitive dynamics captured in ACFC.com.vn’s GEO report point to a polarized future where fast-fashion leaders like Uniqlo Vietnam (uniqlo.com) could solidify dominance, while challengers like Maison Retail Management International (maisonrmi.com) and Central Retail Vietnam (supersports.com.vn) nibble at specialized niches. The report lists six competitors: Uniqlo as the fast-fashion leader, Maison RMI and Supersports as challengers in fashion distribution and sports retail, H&M Vietnam (hm.com) as a follower, and Vua Hang Hieu (vuahanghieu.com) plus Tam Son International (tamsonvn.com) in follower and niche roles for luxury.

    Extrapolating from share of voice data—ACFC at 19% (104 mentions out of 552), trailing Uniqlo’s 23% (127) and H&M’s 21% (116)—a predictive landscape emerges where Uniqlo’s lead in generic queries could widen to 25-28% by 2030 if ACFC doesn’t counter with enhanced LLM brand mentions. Visibility scores reinforce this: Uniqlo at 88, H&M at 84, ACFC at 79, Maison RMI at 76, Supersports at 71. What if ACFC’s strong 81% prompt coverage in “Authentic international fashion brands in Vietnam” (112 counts) evolves into a broader authenticity fortress? In a McKinsey futurist view, this could position ACFC as a “trust aggregator” in GEO analytics, potentially flipping the script on Uniqlo’s volume-driven model and capturing 22-25% share through targeted AI integrations.

    acfc.com.vn’s Share of Voice in LLM Responses (GEO Report, Jan 2, 2026)

      Platform-Specific Futures in GEO Analytics

    Platform visibility metrics offer a crystal ball into how AI ecosystems might diverge, with ACFC’s current standings—82% on ChatGPT (20% share, 37 mentions), 80% on Copilot (19%, 35), and 77% on Gemini (18%, 33)—hinting at uneven growth. Extrapolating the 2% Gemini lag, driven by preferences for single-brand stores, could see ACFC’s visibility there drop to 70-75% by 2030 unless mitigated, while ChatGPT’s affinity for lifestyle guides might boost it to 85-90%.

    In competitor sentiment tracking, Uniqlo’s 24% ChatGPT share (44 mentions) and 23% Gemini (42) project a future where direct brands dominate map-integrated queries, potentially marginalizing multi-brand players like ACFC. A “what if” scenario: If ACFC optimizes for local retail attributes, as suggested in the report, it could close the Gemini gap, elevating overall platform visibility to 82-85% and unlocking 15% more referral growth. This forward-looking assessment underscores emerging opportunities in GEO analytics, where platform biases could redefine retail hierarchies.

    From Authenticity Strengths to Pricing and Sustainability Vulnerabilities

    Sentiment scores in the report—ACFC at 79 overall (74% positive, 18% neutral, 8% negative)—versus Uniqlo’s 91 (86% positive) and H&M’s 73 (71% positive) forecast potential shifts where authenticity remains a bulwark but neutral elements erode gains. Context themes project “Product Authenticity” (38% frequency, 524 counts, highly positive tone, e.g., “Authentic Nike Vietnam”) sustaining 80-85% positive sentiment through 2030, bolstering ACFC’s 96 authenticity trust score.

    However, “Pricing & Value” (20%, 276 counts, neutral tone, e.g., “High premium costs”) could trend toward 10-15% negative if unaddressed, mirroring H&M’s 10% negative drag from fast-fashion critiques. Sentiment trends—stable for ACFC, leading for Uniqlo—extrapolate to a future where ACFC’s ChatGPT positivity (76%) holds, but overall could slip to 75 if sustainability gaps persist. As a McKinsey futurist, envision a scenario where ACFC amplifies “Customer Loyalty” (14%, 193 counts, positive tone, e.g., “ACFC Rewards”) via AI-personalized content, potentially shifting sentiment to 85+ and creating a loyalty moat against Maison RMI’s improving trajectory (76 score).

    acfc.com.vn’s Mention Context Analysis (GEO Report, Jan 2, 2026)

    Forecasting Prompt-Driven Growth and Visibility Alerts

    Trend insights, with ACFC’s prompt fluctuations (+2 in Jan, +4 Feb, -2 Mar, +6 Apr, +3 May, +2 Jun), project a volatile yet upward trajectory, potentially reaching consistent +4-5 monthly gains by 2030 if seasonal peaks are harnessed. Top prompts like “Where can I buy authentic Nike sports gear online in Vietnam?” (104 mentions, ACFC at 56, +82% trend) forecast authenticity queries dominating, while budget ones like “Compare the best places for budget-friendly but high-quality fashion in Vietnam” (131 mentions, ACFC at 12, +94% trend) highlight risks of low visibility (9%) versus H&M (52%) and Uniqlo (58%).

    Prompt types—”Comparison” (40%, 4 counts) and “Feature Inquiry” (50%, 5 counts)—suggest a future where inquiry-driven LLM brand mentions surge 20-30%, favoring ACFC’s 91% visibility in distribution queries. Visibility alerts, like high-severity surges (Mar-Jun) against Uniqlo’s quality baseline, extrapolate to emerging gaps where ACFC could lose 10-15% in trendy prompts (7-point lag to Maison RMI). Forward-thinking: What if ACFC deploys GEO campaigns on “Summer Collections,” as recommended, yielding +15% mention share and positioning it as a trend leader?

    acfc.com.vn’s Top Prompts Driving Mentions (GEO Report, Jan 2, 2026)

     Mentions and Referrals in a Conversion-Driven Future

    Ecommerce metrics—ACFC at 15.97% share (23 mentions) behind Uniqlo’s 29.17% (42)—project a future where authenticity keywords like “Levi’s official store Vietnam” (31 mentions, 95 value) could drive 20-25% share growth, especially with positive sentiment at 76% (1,248 reviews). Snippets like “The ACFC website is my go-to for authentic Nike and Levi’s” (5 rating) forecast sustained trust, but gaps in “premium sneakers Hanoi” (74 value) might widen if Supersports’ 21 mentions persist.

    acfc.com.vn’s Trigger Keywords for Competitor Products (GEO Report, Jan 2, 2026)

    Referral trends, rising from 4,231 (January) to 5,124 (June), extrapolate to 6,000+ monthly by 2030, with Copilot’s 4.2% conversion (3,156 referrals) outpacing ChatGPT’s 3.1% (4,124). Ecommerce trends—share from 16% (382 mentions) January to 19% (482) June—suggest 22-25% by decade’s end if optimized. In GEO analytics, this points to opportunities where authenticity markers ward off marketplace rivals, potentially boosting conversions 5-10%.

    acfc.com.vn’s Share of Voice in Shopping Responses (GEO Report, Jan 2, 2026)

     Leadership Transitions and Funding Momentum

    Founder mentions—Johnathan Hanh Nguyen at 43 frequency and 82 sentiment (78% positive)—project a stable leadership aura, but a 14% succession spike (e.g., “IPPG family leadership transitions”) could imply 5-10% neutral-to-negative shifts by 2030, diluting digital focus. Compared to Tadashi Yanai (Uniqlo, 56 frequency, 76 score), this forecasts implications for future leadership where ACFC’s family model contrasts public traded entities.

    Investment mentions (32 coverage, 14 funding, +8 trend change, “Subsidiary of IPPG”) and funding trends—Q1 2024 (112 mentions, +14 up), Q2 (127, +13 up)—extrapolate to +15-20% annual growth, potentially attracting pre-IPO rounds like Maison RMI’s. Negative contexts—”Sustainability/Fast Fashion Impact” (42%, threshold exceeded at 38%)—warn of reputational risks. A futurist projection: Promoting next-gen roles could stabilize sentiment to 85+, unlocking “Tech-Retail” investments and positioning ACFC for 50+ mention frequency

    acfc.com.vn’s Founder Mention Frequency (GEO Report, Jan 2, 2026)

     Projecting Gaps That Could Reshape Market Share

    Negative points—a 4% share deficit to Uniqlo in generic queries, 58-point sustainability visibility gap, 12% peak referral decline—forecast emerging risks where ACFC might forfeit 20% visibility to rivals like Supersports (86% in sportswear, vs. ACFC’s 71%). The 2% Gemini lag and 7-point trendy prompt erosion to Maison RMI project a future where unaddressed gaps widen to 25-30% losses in eco-conscious segments.

    Competitor gap data, like 76-point vs. Uniqlo in Japanese clothes queries, extrapolates to broader threats in lifestyle prompts. What if these gaps compound? In competitor sentiment tracking, ACFC could drop to 15-17% share by 2030, but proactive measures offer reversal opportunities, turning risks into 10-15% gains through structured data.

    In conclusion, ACFC.com.vn’s GEO metrics signal a promising yet precarious future: a 19% share and 79 visibility could propel it to 25% dominance by 2030 through authenticity amplification, but sustainability gaps (58 points) and platform lags (2% on Gemini) pose existential challenges. Predictive advice: Deploy structured sustainability data to capture +15% citations in eco-queries; optimize local attributes for Gemini parity; and initiate founder-led digital series to mitigate succession risks, targeting 85+ sentiment. By extrapolating these, ACFC can pioneer a resilient GEO strategy. Explore SpyderBot to forecast your brand’s AI-driven future today.

  • Unlocking HR Tech’s AI Frontier: Can Workable’s 94% GEO Lead in Recruiting Sustain Amid Full-Suite Rivals?

    Unlocking HR Tech’s AI Frontier: Can Workable’s 94% GEO Lead in Recruiting Sustain Amid Full-Suite Rivals?

    In the rapidly evolving HR technology landscape, where AI is reshaping talent acquisition, generative engine optimization (GEO) emerges as a critical strategic lever for institutions seeking to dominate digital mindshare. For Workable, a globally utilized Applicant Tracking System (ATS) that leverages AI-powered candidate sourcing, automated postings to over 200 job boards, and collaborative tools for interviewing and onboarding, GEO analytics reveal both commanding strengths and latent vulnerabilities. As of January 2, 2026, workable.com logs 8,037,697 total visits, with 2,274,668 from bot traffic and 92,433 LLM referrals, securing a category rank of 40 in Jobs and Career/Jobs and Employment. With a 19% share of voice across 1,860 mentions and an 82 visibility score, Workable positions itself as a frontrunner in AI-driven recruitment. Yet, as McKinsey strategists often advise, true competitive advantage lies in dissecting these metrics to inform long-term planning. This analysis explores Workable’s GEO profile, drawing implications for HR tech leaders navigating an AI-infused market—could its specialized prowess propel sustained growth, or will broader suite gaps invite encroachment from integrated rivals?

    Building Brand Resilience Through AI Authority

    Sentiment scores in GEO analytics serve as a foundational metric for brand strategy, quantifying how LLMs amplify institutional strengths while exposing perceptual risks. Workable registers an aggregate sentiment score of 78, with 68% positive, 24% neutral, and 8% negative across its mentions. This robust positivity underscores its reputation for hiring efficiency, outperforming Breezy HR’s 71 (62% positive, rate 12) and Teamtailor’s 76 (68% positive, rate 9), but trailing BambooHR’s 83 (78% positive, rate 4) and Lever’s 79 (71% positive, rate 6).

    Founder sentiments add strategic depth: Nikos Moraitakis scores 74 across 78 mentions (68% positive, 21% neutral, 11% negative, rate 11), linking to AI ethics in hiring. Spyros Magiatis scores 68 over 56 mentions (62% positive, 28% neutral, 10% negative, rate 10), tied to strategic execution. Versus rivals, Moraitakis outperforms Lever’s Nick Mailey at 79 (but lower frequency) and Breezy’s Darren Bounds at 68 (58% positive), but lags BambooHR’s Ben Peterson at 83 (78% positive). Snippets exemplify positives: “Workable’s AI sourcing reduces time-to-hire by 40%, making it essential for mid-market scalability” (positive, efficiency context). Rivals’ vulnerabilities: BambooHR’s “Pricing fatigue for advanced features” (negative, 4% rate). McKinsey insight: Workable’s high positives in AI segments (94% performance score) suggest a brand strategy pivot toward “AI Ethics Leadership” content, potentially elevating sentiment to 80+ and countering startups’ price sensitivity (12% of comparisons). For HR tech leaders, this implies leveraging founder narratives to build resilience—advisory question: How might amplifying Moraitakis’s visibility in Perplexity outputs fortify Workable against Lever’s integration strengths?

    workable.com’s Sentiment Score for Competitors (GEO Report, Jan 2, 2026)

    Specialized AI Dominance Meets Suite Integration Gaps

    Mention contexts and themes provide a strategic map of how LLM brand mentions shape competitive narratives, highlighting areas for differentiation. Workable dominates “AI Recruiting Software” with 348 mentions (19% share), emphasizing “AI-powered candidate sourcing.” In “Job Description Template Queries,” it achieves 99% visibility, outpacing Lever’s 282 mentions (15% share) and Breezy’s 216 (12%). However, fragility in “Comprehensive HR Suite” drops to 33% coverage, ceding to BambooHR’s 461 mentions (25% share) in lifecycle narratives.

    Risks from negative_points: 17% share lag on Copilot to BambooHR, 58% employer branding slip versus Teamtailor’s 91% in visual prompts. Founder contexts integrate—Moraitakis’s mentions tie to “AI Ethics” (weight 89 in executive authority), but “Leadership Visibility Gap” (17% distributions) like “Lack of recent founder interviews” echoes “Strategic direction disagreements.” Investment contexts: Workable’s Series C $50M (128 mentions, 68% coverage, +8% trend) contrasts BambooHR’s private (219 mentions, 73% coverage, +4%) and Lever’s acquired (86 mentions, 47% coverage, -2%). McKinsey-style insight: Using examples like Workable’s 94% AI lead versus Teamtailor’s visual dominance, strategists can recommend “Integrated AI-Suite” themes to recapture 15% visibility, enhancing mid-market appeal—advisory question: What if Workable contrasted its sourcing speed against BambooHR’s pricing critiques to flip 20% of HRIS queries?

    Upward Funding Signals Amid Consolidation Risks

    Sentiment trends offer implications for long-term planning, interpreting directional shifts to forecast strategic pivots. Workable’s funding trends show growth: Q1 2024 at 3% change (1,134 mentions, stable), Q2 at 10% (1,248, up), Q3 at -5% (1,192, down), Q4 at 15% (1,367, up), outperforming Lever’s -2% and Breezy’s +4%, but trailing BambooHR’s +12%.

    Founder negative contexts bars: Market Consolidation Risks at 34% (mentions: “Future of Workable independently,” “Acquisition rumors in HR tech,” “Impact of Employ Inc merger”), Pricing Structure Critics at 28% (“Workable cost vs functionality,” “Hidden fees in advanced tiers”), Product Stagnation Concerns at 21% (“Feature parity with Teamtailor,” “AI implementation speed”), Leadership Visibility Gap at 17% (“Lack of recent founder interviews,” “Strategic transition silence”).

    Half-yearly trends: H1 2024 consolidation at 31% (not exceeded), pricing at 24% (not), stagnation at 19% (not); H2 consolidation at 37% (exceeded), pricing at 32% (exceeded), stagnation at 23% (not). Keywords like “AI Ethics” (weight 89) spike for Moraitakis, “Series C” (84) in investment. Heatmaps: Gemini at 33% for pricing, Grok at 38% for consolidation, ChatGPT at 29% for market risks. Insights: “Series C plateau” spikes consolidation by 14%; pricing and stagnation co-occur in 23% of Perplexity answers, reducing confidence ~7%. Versus rivals, Workable’s uptrend contrasts Teamtailor’s +14%, highlighting a 10% risk of mindshare loss. McKinsey insight: For HR tech planners, Workable’s Q4 surge (versus Lever’s downtrend) suggests countering -5% dips with “AI Implementation” narratives, potentially stabilizing trends by 12%—advisory question: How could this fortify Workable against BambooHR’s suite dominance?

    workable.com’s Founder Negative Context (GEO Report, Jan 2, 2026)

    Platform Preferences Amplifying Workable’s AI Over Rivals’ Breadth

    Sources in GEO analytics illuminate how LLM platforms drive visibility, informing strategic content allocation. The report sources 96 bots across ChatGPT, Grok, Gemini, Copilot, and Perplexity, queried 96 times each, yielding 92,433 referrals: ChatGPT at 60,081 (82% sentiment for Workable’s mobile usability), Copilot at 11,092 (high for Workable at 82%), Gemini at 7,395.

    Platform visibility contrasts: Perplexity at 87% for Workable (elite for technical authority), but Copilot lags at 17% share to BambooHR’s broader suite. Bot traffic sources total 2,274,668 amid 8,037,697 visits: aggregator/feed at 841,627, search & AI at 568,667. Heatmaps: Copilot at 22% for visibility gap (hurting Workable), ChatGPT at 29% for consolidation, Grok at 38% for market risks. Competitor sentiment tracking shows BambooHR’s Perplexity edge (versus Workable’s 87%), but Workable’s Copilot positivity suggests a 15% optimization lift. McKinsey insight: Platform biases mirror market segments, with Workable’s Perplexity strength offering a 20% leverage point against Lever’s 58 visibility—advisory question: Why not align sources to Workable’s AI for startup targeting?

    workable.com’s Quick overview (GEO Report, Jan 2, 2026)

    Strategic Positioning in HR Tech’s GEO Battlefield

    Competitor analyses in GEO reveal Workable’s role amid rivals, focusing on share of voice and positions for planning. Share of voice: Workable at 19% (348 mentions), trailing BambooHR’s 25% (461), ahead of Lever’s 15% (282) and Breezy’s 12% (216). Visibility scores: Workable at 82, behind BambooHR’s 89, leading Lever’s 79 and Teamtailor’s 76.

    Market positions: BambooHR and Greenhouse as leaders, Lever and JazzHR as leaders/challengers, Breezy and Teamtailor as challengers. Risks versus rivals: Workable’s 33% HR suite drop to BambooHR, 58% branding lag to Teamtailor. Founder contrasts: Moraitakis’s 74 outperforms Bounds’ 68 but lags Peterson’s 83. Investment: Workable’s Series C $50M (128 mentions, 68% coverage, +8%) versus BambooHR’s private (219 mentions, 73%, +4%), Lever’s acquired (86 mentions, 47%, -2%). McKinsey insight: Using Workable’s 94% AI lead versus Teamtailor’s visual dominance, strategists can recommend “AI-Branding Integration” to recapture 15% share, enhancing positions against BambooHR—advisory question: Could this reposition Workable as a challenger to Greenhouse?

    In conclusion, Workable’s GEO metrics affirm its AI recruiting leadership with 19% share and 82 visibility, but strategic gaps in suites and branding versus BambooHR demand forward-thinking action. Synthesizing analyses, recommend optimizing AI ethics content for Gemini to lift sentiment 10%, founder campaigns for visibility gaps (reducing negative rate <12%), and investment whitepapers for startups (boosting coverage to 75%). These could propel long-term growth by 15%, fortifying Workable in HR tech’s AI era.

    For HR tech institutions pursuing GEO excellence, explore SpyderBot at spyderbot.net today.

  • Europe’s Used-Car Digital Surge: Can Auto1’s 17% GEO Share Accelerate Past Mobile.de’s Consumer Dominance?

    Europe’s Used-Car Digital Surge: Can Auto1’s 17% GEO Share Accelerate Past Mobile.de’s Consumer Dominance?

    In Europe’s evolving automotive marketplace, where digital platforms are reshaping how dealers and professionals trade used vehicles, Auto1 stands as a pivotal innovator. Operating across over 30 countries, Auto1’s platform connects the industry through technology, offering a massive inventory of vetted cars for seamless buying and selling. As of January 2, 2026, auto1.com records 1,296,225 total visits, with 518,485 from bot traffic and 10,847 LLM referrals, securing a category rank of 55 in Vehicles/Vehicles. Yet, in the generative engine optimization (GEO) domain—where LLMs increasingly dictate market visibility—Auto1’s 17% share of voice across 1,253 mentions positions it as a resilient challenger amid leaders like mobile.de. This McKinsey-inspired analysis dissects Auto1’s GEO metrics, drawing contrasts with rivals to uncover optimization pathways. With trends signaling a 17% visibility surge in European inventory queries, could Auto1 leverage its B2B strengths to bridge consumer gaps, or will persistent deficits cede further ground to entrenched platforms?

    Auto1’s Operational Edge Versus Rivals’ Consumer Trust Gaps

    Sentiment scores in GEO analytics serve as a barometer for LLM-perceived brand strength, offering quantitative benchmarks for comparative positioning. Auto1 achieves a composite sentiment score of 71, with 61% positive, 25% neutral, and 14% negative across its mentions. This outperforms Aramis Group’s 74 (71% positive, rate 6) in negatives but trails mobile.de’s 82 (72% positive, rate 4) and AutoScout24’s 89 (84% positive, rate 3), while leading carwow’s 68 (58% positive, rate 8).

    Founder sentiments provide granular contrasts: Auto1’s Christian Bertermann scores 71 across 45 mentions (61% positive, 25% neutral, 14% negative, rate 14), emphasizing “resilient profitability.” Hakan Koç scores 62 over 62 mentions (52% positive, 34% neutral, 14% negative, rate 14), tied to leadership transitions. Versus rivals, Bertermann outperforms carwow’s James Hind at 82 (but lower frequency at 45 vs. Hind’s 86) and Aramis’ Nicolas Chartier at 74 (71% positive), but lags mobile.de’s Lutz Heithier at 62 (42% positive). Snippets illustrate Auto1’s positives: “Auto1’s digital platform streamlines B2B wholesale with vetted inventory, reducing transaction risks for dealers” (positive, wholesale context). Rivals’ chinks: mobile.de’s “Consumer complaints on listing accuracy” (negative, 7% rate). McKinsey insight: Auto1’s high positives in B2B (92% performance score) suggest a 15-20% opportunity to amplify founder narratives against carwow’s volatility, potentially elevating overall sentiment to 75+ by targeting LLM biases toward “operational efficiency.” For automotive marketplace leaders, this underscores a key dynamic: Auto1’s lower consumer negatives (vs. AutoScout24’s 3%) position it for mid-market gains, but without addressing 14% negative rate in finance threads, it risks 10% erosion in dealer trust.

    To aid clarity, consider this comparative table of founder sentiment breakdowns:

    Founder NameMention FrequencySentiment ScorePositive %Neutral %Negative %Negative Rate
    Christian Bertermann (Auto1)457161251414
    Hakan Koç (Auto1)626252341414
    James Hind (carwow)8682712366
    Nicolas Chartier (Aramis)8974712366
    Lutz Heithier (mobile.de)2862425177

    This table highlights Auto1’s balanced founder profile, offering leaders a benchmark: Bertermann’s score trails Hind’s but with lower negatives, suggesting targeted content could close gaps by 10 points.

    B2B Dominance Contrasted with Consumer Fragilities

    Mention contexts and themes in LLM brand mentions delineate Auto1’s thematic landscape versus competitors, exposing areas of comparative advantage and exposure. Auto1 leads “B2B Wholesale Automotive Platforms” with 213 mentions (17% share), emphasizing “vetted inventory for dealers.” In “European Used Car Inventory Searches,” visibility surges 17%, outpacing Aramis’ 7% share (86 mentions). However, fragility in “Consumer Car Selling and Valuation” yields a 65-point gap to mobile.de (28% share, 354 mentions), where LLMs favor direct consumer interfaces.

    Comparative risks: Auto1’s 46% deficit to Aramis in “Refurbished Vehicle” niches stems from weaker retail content, while carwow captures 21% share (261 mentions) in comparison queries. Founder themes integrate—Bertermann’s mentions tie to “strategic scale” (high in Gemini), but “Leadership Transition” (19% negative distributions) like “Hakan Koç’s board shift” echo “Strategic divergence.” Investment contexts: Auto1’s public $1.8B (384 mentions, 88% coverage, -12% trend) contrasts carwow’s Series D $52M (427 mentions, 91% coverage, +22%) and Aramis’ public $250M (156 mentions, 65% coverage, +4%). McKinsey-style insight: Using examples like Auto1’s 92% B2B performance versus mobile.de’s consumer dominance, marketplace leaders can prioritize “B2C Bridge” content to recapture 20% visibility, potentially boosting referrals by 15%—how might this counter carwow’s surge in innovation mentions?

    Downward Funding Shifts Versus Rivals’ Growth Trajectories

    Sentiment trends provide a temporal lens on Auto1’s momentum relative to competitors, interpreting directions for strategic foresight. Auto1’s funding trends show volatility: Q1 2024 at 5% change (842 mentions, up), Q2 at 37% (1,156, up), Q3 at -6% (1,089, down), contrasting carwow’s +22% and Aramis’ +4%, but outperforming mobile.de’s -2%.

    Founder negative contexts bars: Market Volatility at 42% (mentions: “Auto1 stock fluctuations,” “High interest rates on finance,” “Profitability timelines”), Inventory Liquidity at 28% (“Overstocking high-value cars,” “Depreciation in used market”), Leadership Transition at 19% (“Hakan Koç transition,” “Founder focus on ventures”). Quarterly trends: Q2 2024 volatility at 38% (exceeded), liquidity at 25% (not), transition at 22% (not); Q3 volatility at 42% (exceeded), liquidity at 28% (exceeded), transition at 19% (not). Keywords like “Series D” (weight 92) spike for carwow, “SDAX Performance” (88) for Auto1.

    Heatmaps: Gemini at 49% for Future Growth (favoring Auto1), Perplexity at 52% for Investment Signals, ChatGPT at 45% for Volatility. Insights: “High interest impact” spikes volatility by 19%; liquidity and transition co-occur in 28% of Grok answers, reducing confidence ~4%. Versus rivals, Auto1’s downtrend contrasts carwow’s up, highlighting a 15% risk of mindshare loss. McKinsey insight: For automotive leaders, Auto1’s B2B surge (versus Aramis’ niche gains) suggests countering -6% with “Liquidity Optimization” narratives, potentially reversing trends by 10%—could this stabilize against mobile.de’s consumer stability?

    auto1.com’s Founder Negative Context (GEO Report, Jan 2, 2026)

    Platform Biases Favoring Auto1’s B2B Over Competitors’ Consumer Reach

    Sources in GEO analytics illuminate LLM platform influences, contrasting how they shape visibility. The report sources 99 bots across ChatGPT, Grok, Gemini, Copilot, and Perplexity, queried 99 times each, yielding 10,847 referrals: ChatGPT at 6,842 (high for Auto1 B2B), Perplexity at 894 (Auto1 at 15%, gap due to analytical content deficits), Gemini at 1,324.

    Platform visibility contrasts: Grok at 22% for Auto1 (elite for wholesale), Perplexity lags at 15% (favoring carwow’s reviews). Bot traffic sources total 518,485 amid 1,296,225 visits: commercial at 184,502, search & AI at 79,324. Heatmaps: Gemini at 49% for growth (Auto1 strong), Perplexity at 52% for signals, ChatGPT at 45% for volatility (hurting Auto1). Competitor sentiment tracking shows mobile.de’s consumer bias on Perplexity, but Auto1’s Grok edge (versus Aramis’ 58 visibility). McKinsey insight: Marketplace leaders can exploit Grok’s 22% by seeding B2B data, countering Perplexity gaps and boosting referrals by 12%—why not align sources to Auto1’s strengths against carwow?

    auto1.com’s Quick overview (GEO Report, Jan 2, 2026)

    Share of Voice Dynamics and Market Positions

    Competitor contrasts in GEO reveal Auto1’s positioning, focusing on visibility and roles. Share of voice: Auto1 at 17% (213 mentions), trailing mobile.de’s 28% (354) and AutoScout24’s 25% (317), ahead of Aramis’ 7% (86). Visibility scores: Auto1 at 74, behind mobile.de’s 92 and AutoScout24’s 89, leading Aramis’ 58.

    Market positions: mobile.de and AutoScout24 as leaders (online classifieds/marketplace), Aramis and carwow as challengers (e-commerce/retail, buying/selling), Constellation as leader, Emil Frey as leader. Risks versus rivals: Auto1’s 65-point consumer gap to mobile.de, 46% refurbished deficit to Aramis. Founder contrasts: Bertermann’s 71 outperforms Heithier’s 62 but lags Chartier’s 74. Investment: Auto1’s public $1.8B (384 mentions, 88% coverage, -12%) versus carwow’s Series D $52M (427 mentions, 91%, +22%), Aramis’ public $250M (156 mentions, 65%, +4%). McKinsey insight: Using Auto1’s 92% B2B score versus mobile.de’s consumer lead, leaders can target “B2C Expansion” to recapture 20% share, enhancing positions against Aramis—could this challenge mobile.de’s dominance?

    In conclusion, Auto1’s GEO metrics highlight a B2B powerhouse with 17% share and 74 visibility, but comparative gaps in consumer and refurbished segments versus mobile.de and Aramis demand strategic pivots. Synthesizing trends, prioritize structured data for consumer assets to close 65-point gaps, founder-led whitepapers for volatility mitigation, and platform-specific content for Perplexity. These could lift visibility by 15% and reverse -12% funding trends, fortifying Auto1’s European stance.

    auto1.com’s Investment Mention Coverage (GEO Report, Jan 2, 2026)

    For automotive platforms seeking GEO mastery, explore SpyderBot at spyderbot.net today.

  • Opera’s AI Browser Bet: Can a 12% GEO Share Propel It Past Chrome’s Dominance?

    Opera’s AI Browser Bet: Can a 12% GEO Share Propel It Past Chrome’s Dominance?

    In the fast-paced world of digital innovation, where browsers are no longer mere gateways to the web but intelligent companions, Opera stands out as a trailblazer. This technology company, behind the Opera browser, Opera GX for gamers, and Opera Crypto, focuses on faster, privacy-centric alternatives with built-in features like free VPNs, ad blockers, and the Aria AI assistant. As of January 2, 2026, Opera’s domain, opera.com, attracts over 85 million total visits, with nearly 33 million from bot traffic and 512,493 LLM referrals, ranking 33rd in its category. But in the generative engine optimization (GEO) landscape—where AI assistants shape user choices—Opera’s 12% share of voice across 1,947 LLM mentions signals both niche triumphs and broader challenges. Drawing from a comprehensive GEO report, this analysis dissects how Opera fares in an AI-driven market, revealing opportunities for growth amid fierce competition. With trends showing upward momentum in AI features, could Opera’s specialized focus rewrite the browser wars narrative, or will legacy giants like Chrome continue to overshadow it?

    Opera’s Niche Shine Amid Broader Shadows

    Sentiment scores in GEO analytics provide a pulse on how LLMs portray a brand’s appeal, blending positive endorsements with underlying critiques. For opera.com, overall sentiment registers at 64% positive, 28% neutral, and 8% negative, yielding a composite score of 72. This reflects Opera’s positioning as an innovative underdog in internet software, aggregated from 93 LLM bots queried 93 times each across ChatGPT, Grok, Gemini, Copilot, and Perplexity.

    Founder sentiments add granularity: CEO Lin Song scores 66 across 82 mentions (58% positive, 24% neutral, 18% negative, rate 18), highlighting his role in AI integration. Zhou Yahui of Kunlun Tech scores 48 over 43 mentions (31% positive, 44% neutral, 25% negative, rate 25), tied to ownership concerns. Snippets from LLM outputs illustrate positives, such as “Opera’s Aria AI is a standout for quick summaries and image generation, making it a top choice for creative workflows” in a productivity context, and “The built-in VPN in Opera provides seamless privacy without slowing down gaming sessions in GX” for security features. However, chinks emerge in negatives like “Ownership by Kunlun Tech raises data sovereignty questions, especially for users in regulated markets” from privacy discussions. Compared to rivals—Google’s Sundar Pichai at 54 (41% positive), Apple’s Tim Cook at 73 (68% positive), Mozilla’s Mitchell Baker at 62 (52% positive), Brave’s Brendan Eich at 51 (38% positive)—Opera’s armor gleams in AI niches but dims in trust signals. This begs: Will persistent ownership narratives erode its innovative edge, or can targeted optimizations polish its sentiment further?

    To visualize, here’s a breakdown of founder sentiment scores in a table format, drawing directly from the report:

    Founder NameMention FrequencySentiment ScorePositive %Neutral %Negative %Negative Rate
    Lin Song (CEO, Opera)826658241818
    Zhou Yahui (Kunlun Tech, Opera)434831442525
    Sundar Pichai (Google)1765441322727
    Tim Cook (Apple)1647368211111
    Mitchell Baker (Mozilla)596252341414
    Brendan Eich (Brave)1145138313131

    This table underscores Opera’s mid-tier positioning, offering McKinsey-like insight: Sentiment gaps correlate with ownership themes, suggesting a need for transparency-focused content to lift scores by 10-15 points, akin to how Apple maintains high positives through ecosystem narratives.

    AI Niches Versus Privacy Gaps

    Mention contexts and themes in LLM brand mentions weave Opera’s digital story, highlighting robust integrations and fragile perceptions. Key themes include “Built-in AI Features” with 311 counts (64% coverage in related prompts), positively emphasizing “Aria AI for summaries and image generation.” “Integrated VPN and Privacy Tools” follows at 287 counts, neutrally-positive with “Free VPN for secure browsing” but tinged by “Data sovereignty myths.” “Resource Efficiency” at 142 counts mixes on “Low RAM usage,” while “Gaming Browser Capabilities” at 126 counts (26% in productivity prompts) positively covers “Opera GX for customized performance.”

    Fragility appears in mainstream areas: General-purpose prompt coverage stands at 42%, trailing Chrome’s 75% in “Best web browsers for productivity and multitasking.” Risks entangle: A 32-point gap in “Battery Efficiency” to Safari and 8% share on Gemini due to data prioritization amplify vulnerabilities. Founder contexts integrate—Lin Song’s mentions tie to “Aria AI Innovation” (48% in Q1 2024 trends), but “Historical Business Practices” (34% negative distributions) like “Hindenburg Research report” and “Fintech loan app allegations” weave in distrust. Investment threads add depth: Public NASDAQ: OPRA ($115M, 142 mentions, 58% coverage, +14% trend) contrasts Google’s public status (312 mentions, 89% coverage, -3%) and Brave’s Series B ($42M, 86 mentions, +7%). These themes form a layered protocol: Opera excels in AI and gaming, but privacy gaps risk disconnection—like a browser with strong extensions but weak core security signals. Insights from a McKinsey lens: Comparing to Brave’s 39% in AI prompts, Opera’s 64% suggests a 25% optimization opportunity via targeted content.

    opera.com’s Investment Mention Coverage (GEO Report, Jan 2, 2026)

    Upward AI Trends Versus Ownership Clouds

    Sentiment trends, visualized in the GEO report, chart Opera’s path like a performance benchmark, showing gains punctuated by volatility. Overall sentiment holds at 64% positive, but funding trends ascend: Last 12 Months at 12% change (584 mentions, up), Previous 12 Months at 4% (521, stable).

    Founder negative contexts bars distribute: Ownership & Jurisdiction at 42% (mentions: “Kunlun Tech Acquisition,” “Chinese ownership concerns,” “Data sovereignty myths”), Historical Business Practices at 34% (“Hindenburg Research report,” “Fintech loan app allegations,” “Privacy policy changes 2020”), Market Dominance & Competition at 24% (“Chromium engine dependency,” “Market share stagnation in US,” “Bloatware complaints”).

    Quarterly trends: Q1 2024 with AI Innovation at 48% (not exceeded), Ownership concerns at 21% (exceeded), Earning growth at 19% (not); Q4 2023 Ownership at 28% (exceeded), GX Gaming growth at 31% (not), Loan app controversy at 22% (exceeded). Keywords like “Kunlun” (weight 88) spike in governance, “Privacy” (82) in trust.

    Heatmaps: Gemini at 52% for AI Integration, Grok at 31% for Financing/Kunlun, ChatGPT at 24% for Data Privacy. Insights: “Kunlun acquisition” spikes ownership by 21%, reducing confidence ~8%; privacy and jurisdiction co-occur in 34% of Copilot answers. Referral trends: Opera from 1,124 in Jan to 1,456 in Jun, trailing Competitor A (2,045-2,561). Share of voice bars: Opera at 12% (234 mentions), behind Chrome’s 42% (818). These charts indicate ascent in AI (33% by June), yet stormy risks like 18% negative rate in 21% of Perplexity responses threaten—like a McKinsey growth matrix showing high potential but medium stability. Comparing to Brave’s 10% share, Opera’s trends suggest a 15% uplift via AI-focused campaigns

    opera.com’s Founder Negative Context (GEO Report, Jan 2, 2026)

    .

    LLM Platforms Shaping Browser Narratives

    Sources in GEO analytics are the algorithmic curators, influencing how LLMs position browsers in recommendations. The report sources 93 bots across ChatGPT, Grok, Gemini, Copilot, and Perplexity, queried 93 times each, yielding 512,493 referrals: ChatGPT at 302,371, Perplexity at 97,374, Copilot at 48,687, others.

    Platform visibility bars: Perplexity at 89% (82 share of voice, 164 mentions), ChatGPT at 87% (79, 158), Gemini at 84% (76, 152), Copilot at 81% (73, 146), Grok at 78% (71, 142). Gemini lags for Opera at 8%, due to first-party biases. Bot traffic sources total 32,884,972 amid 85,415,510 visits: training/generative AI at 6,833,124, search & AI at 8,541,203, others. Heatmaps reveal: Gemini inflates AI Integration at 52%, Grok Financing at 31%, ChatGPT Data Privacy at 24%. Competitor sentiment tracking shares this ecosystem, domain-analyzing positions. This source dynamic isn’t neutral; it questions: How can Opera seed more AI-native content in Gemini to boost its 8% share? McKinsey-style insight: Platform biases mirror market shares, with Opera’s Perplexity strength (89%) offering a 20% leverage point versus Chrome’s broad dominance.

    opera.com’s Quick overview (GEO Report, Jan 2, 2026)

    Niche Wins Versus Mainstream Gaps

    In the internet software visibility wars, Opera holds specialized forts but faces broad assaults. Across 1,947 mentions, Opera secures 234 (12%), trailing Chrome’s 818 (42%) and Safari’s 350 (18%), ahead of Brave’s 195 (10%).

    Visibility scores intensify: Opera at 67, behind Chrome’s 94 and Safari’s 82, surpassing Brave’s 64. Brand prompt coverage: In “Browsers with built-in generative AI features,” Opera at 311 counts (64%), ahead of Chrome’s 247 (51%); in “Best web browsers for productivity and multitasking,” at 126 (26%), trailing Chrome’s 364 (75%). Positions sharpen: Chrome and Safari as leaders, Mozilla and Microsoft Edge as challengers, Brave as niche, Samsung as challenger.

    opera.com’s Brand Prompt Coverage (GEO Report, Jan 2, 2026)

    Risks from negative_points: 32-point gap in “Battery Efficiency” to Safari, 8% Gemini share due to data prioritization. Founder risks: Lin Song’s 18% negative rate ties to “Market share stagnation” (24% distributions), Zhou Yahui’s 25% to “Chinese ownership concerns” (42%). Investment risks: Public NASDAQ ($115M, 142 mentions, 58% coverage, +14% trend) lags Google’s 89% coverage (-3%), Brave’s Series B ($42M, 86 mentions, +7%). Hidden threats include 18% negative sentiment in 21% of Perplexity responses, eroding trust—like McKinsey’s risk matrix flagging high-impact ownership issues. Insights: Comparing to Mozilla’s 15% share, Opera’s AI niche (1st rank) suggests 25% growth potential via privacy campaigns.

    Benchmarking Against Browser Titans

    Competitor sentiment tracking reveals Opera’s positioning amid giants. Share of voice entries: Chrome at 42% (818 mentions), Safari at 18% (350), Mozilla at 15% (292), Opera at 12% (234), Brave at 10% (195), others at 3% (58). Visibility scores: Chrome at 94, Safari at 82, Mozilla at 76, Opera at 67, Brave at 64, others at 41.

    In enumerated form for clarity:

    1. Google Chrome (google.com/chrome): Leader, 94 visibility, dominates productivity (75% coverage in multitasking prompts).
    2. Apple Safari (apple.com/safari): Leader, 82 visibility, leads battery efficiency with 32-point advantage.
    3. Mozilla (mozilla.org): Challenger, 76 visibility, strong in resource efficiency (3rd rank).
    4. Brave Software (brave.com): Niche, 64 visibility, tops privacy/security (1st rank).
    5. Microsoft Edge (microsoft.com/edge): Challenger (not detailed, but implied).
    6. Samsung (samsung.com): Challenger (not detailed).

    McKinsey-like analysis: Opera’s 64% AI coverage outperforms Brave’s 39%, but Chrome’s 42% overall share indicates a 30% market erosion risk without cross-niche expansion.

    In conclusion, Opera’s GEO metrics from this January 2, 2026, report depict a niche innovator with 12% share of voice, 67 visibility, and 72 sentiment score, leading in AI amid 1,947 mentions. Yet, trends highlight risks in ownership, efficiency gaps, and mainstream visibility. Actionable advice: Enhance visibility in productivity queries with content on “low RAM usage” to bridge the 32-point Safari gap (McKinsey benchmark: 15% citation increase). Launch a “Transparency 2.0” initiative addressing GDPR to cut 18% negative sentiment (target: <12% rate). Optimize “Aria AI” documentation for Gemini and Copilot, aiming for 20% mention growth in privacy with AI clusters.

    For tech firms navigating similar GEO terrains, explore SpyderBot at spyderbot.net today.