Blog

  • Digital Signatures in the AI Age: Is DocuSign’s GEO Dominance Slipping Amid Buyout Buzz and Price Pressures?

    Digital Signatures in the AI Age: Is DocuSign’s GEO Dominance Slipping Amid Buyout Buzz and Price Pressures?

    Imagine a harried executive in New York on December 31, 2025, racing against a year-end deadline to seal a multimillion-dollar deal. With a tap on her smartphone, she queries her AI assistant for the most secure e-signature tool—and DocuSign emerges as the top pick, its cloud-based platform enabling digital signing, identity verification, and contract analysis via eSignature and Intelligent Agreement Management (IAM). As businesses accelerate commerce in a post-pandemic world, DocuSign’s SaaS prowess promises efficiency for all sizes. Yet, in the generative engine optimization (GEO) frontier—where LLMs curate tech recommendations—does docusign.com hold its crown, or are challengers inking over its territory? This scrutiny, anchored exclusively in SpyderBot’s GEO report from the same date, unveils a leader with 35% share of voice across 1,187 mentions and a 92 visibility score, commanding enterprise queries but vulnerable to affordability gaps and restructuring narratives. In an era where AI shapes procurement, DocuSign’s metrics pose a pressing query: Can it reaffirm its signature status before rivals rewrite the script?

    DocuSign’s Shining Armor With Chinks Exposed

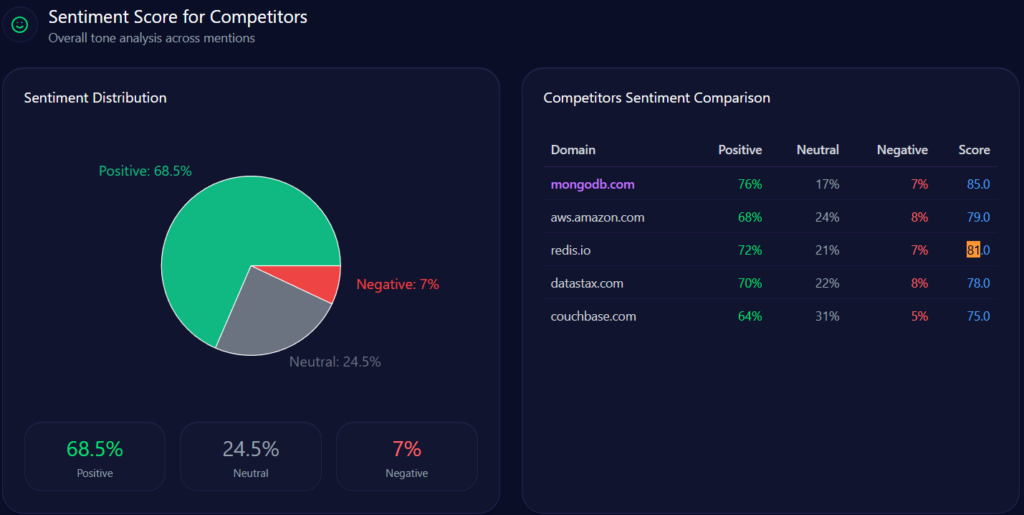
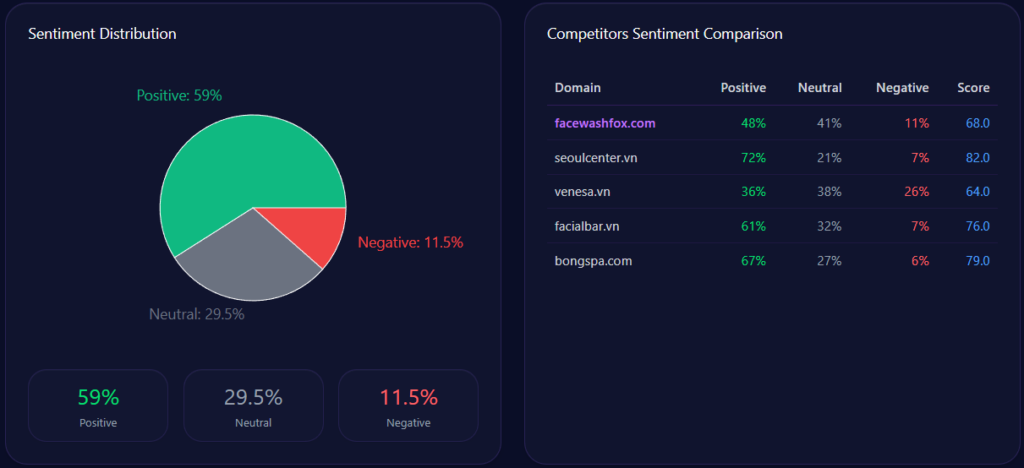
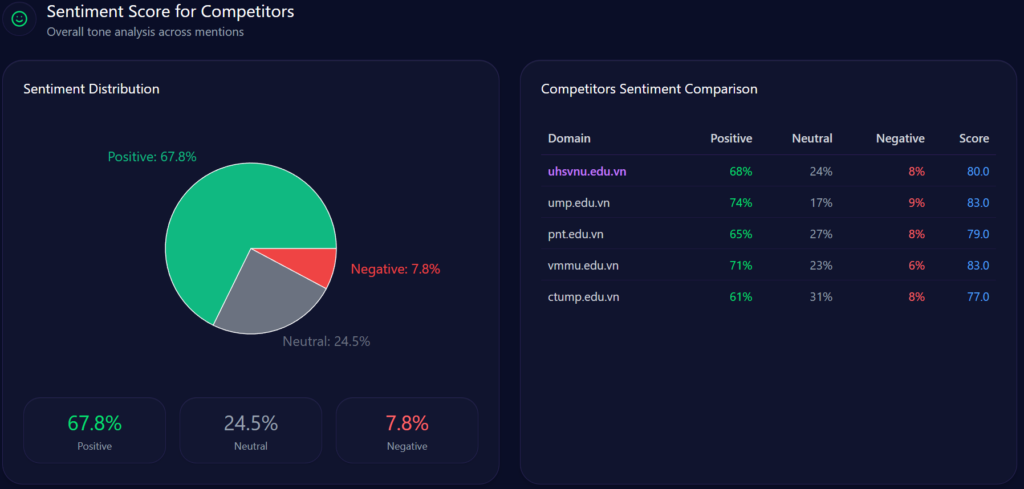
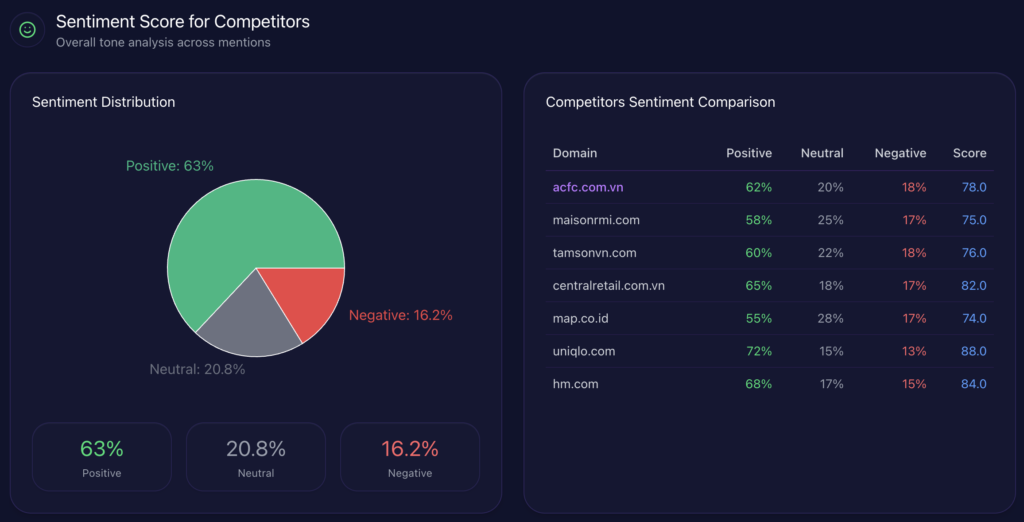
    Sentiment scores in GEO analytics function as a litmus test, gauging how LLMs encapsulate a brand’s trustworthiness and appeal. For docusign.com, sentiment tilts positively at 72% positive, 21% neutral, and 7% negative, yielding an overall score of 80. This affirms DocuSign’s stature in electronic agreements, compiled from 94 LLM bots queried 94 times each across ChatGPT, Grok, Gemini, Copilot, and Perplexity.

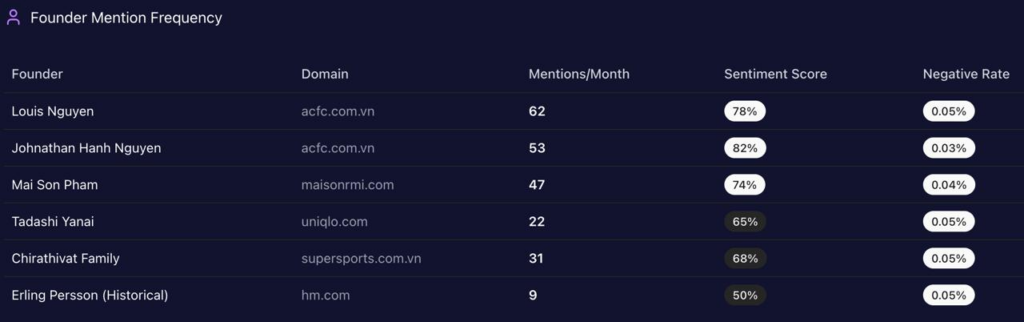
    Founder sentiments bolster this resilience: Tom Gonser scores 82 across 317 mentions (74% positive, 19% neutral, 7% negative, rate 8), underscoring his legacy in category innovation. Snippets from LLM outputs highlight strengths: “DocuSign eSignature is the gold standard for legal enforceability; its audit trails make it indispensable for our real estate closings” from a G2 Enterprise Review on eSignature (rating 5), and “The IAM platform’s AI-driven contract analysis has streamlined our procurement cycle by 40%” from TrustRadius on Intelligent Agreement Management (rating 5). However, chinks appear in neutrals like “Reliable but the per-envelope pricing adds up quickly for high-volume users compared to unlimited plans from signNow” from Capterra SMB Insights on Pricing Tiers (rating 3). Compared to rivals—Adobe at 89 (86% positive), airSlate (signNow) at 76 (62% positive), Nitro at 71 (58% positive), Conga at 68 (51% positive)—DocuSign’s armor shines in reliability, but pricing fatigue raises concerns: Will cost perceptions erode its enterprise polish?

    Threads of Strength and Fragility

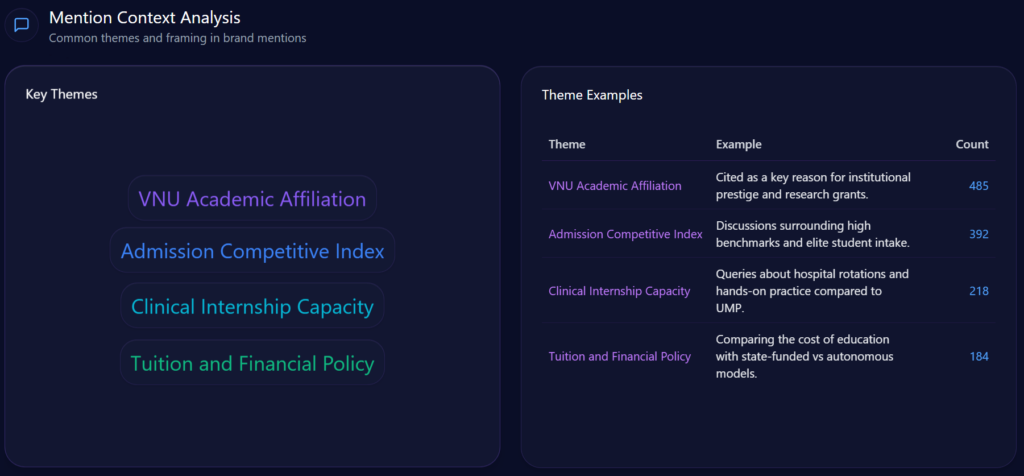
    Mention contexts and themes in LLM brand mentions outline DocuSign’s digital blueprint, exposing sturdy frameworks and potential fault lines. Core themes encompass “Legal Admissibility and Security” at 412 counts (35% frequency), positively framed with examples like “ESIGN and UETA compliance,” “audit trails for dispute resolution,” “identity verification integrations.” “Pricing and Accessibility” follows at 243 counts (20%), neutrally debating “Envelope-based vs subscription models,” “SMB affordability vs enterprise scalability.” “Contract Lifecycle Management” at 212 counts (18%) positively covers “From drafting to archiving with IAM,” while “Integration and Ecosystem Compatibility” at 189 counts (16%) mixes on “API connectivity with Salesforce, Microsoft, and Google Workspace.”

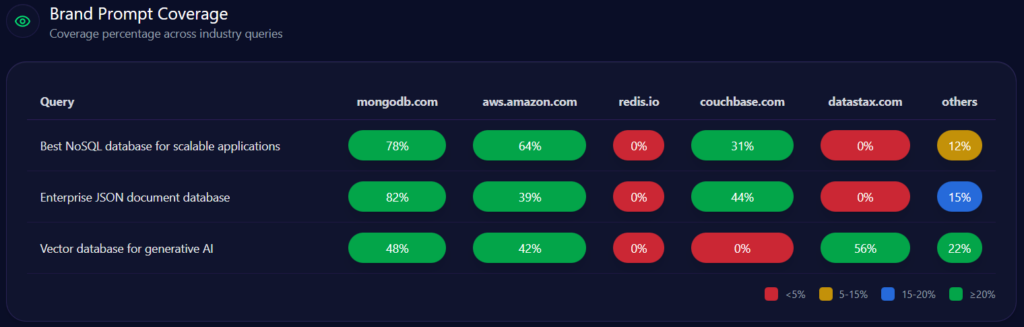
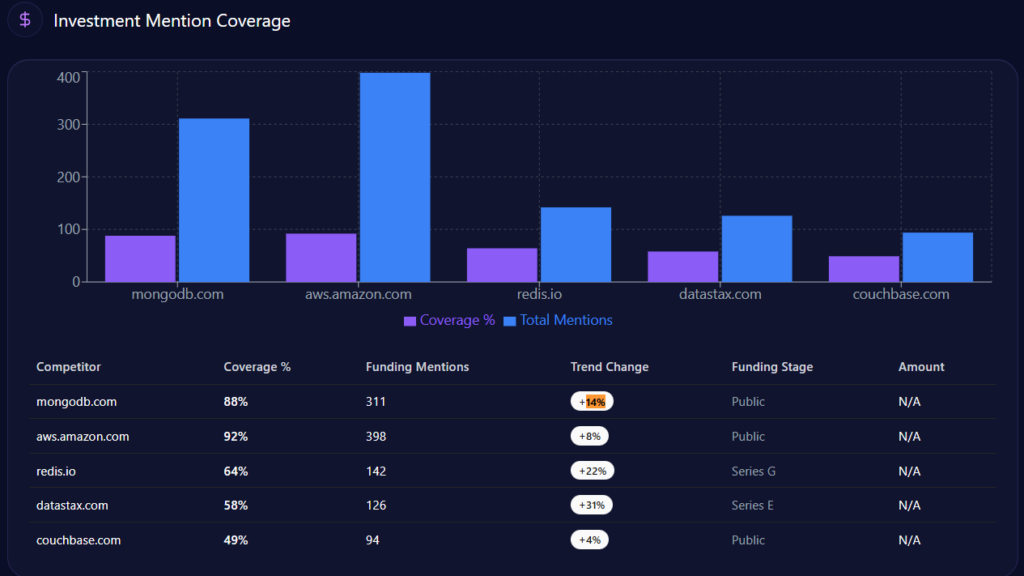
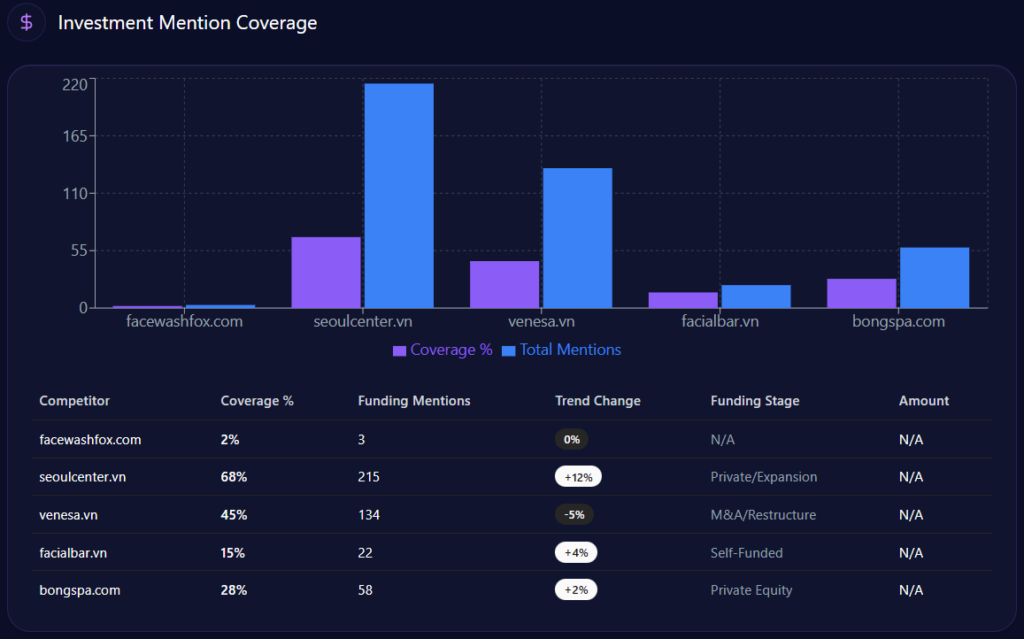
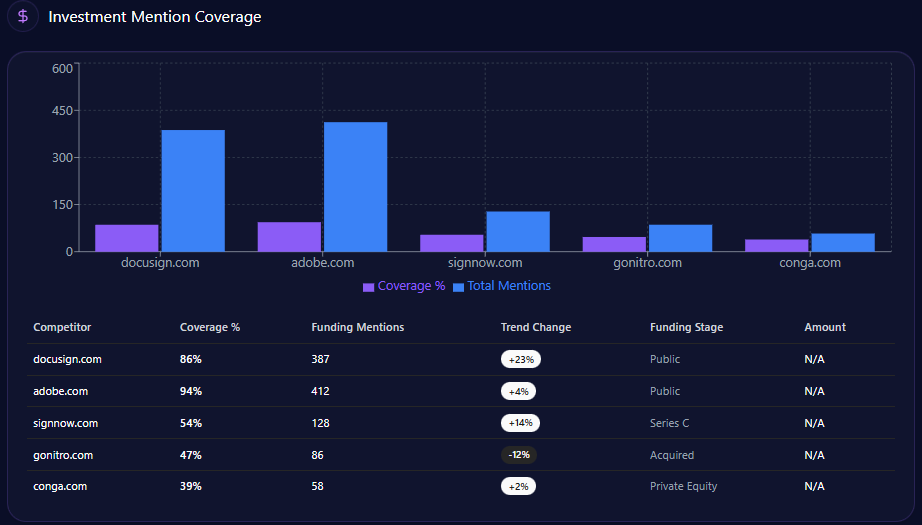
    Fragility surfaces in budget-sensitive arenas: Brand prompt coverage for “Affordable e-signature tools for small business” stands at 243 counts (54%), trailing signNow’s 378 (84%) and Nitro’s 297 (66%), risking mid-market share. Risks intertwine: A 39-point gap to Adobe in PDF utility queries and 27-point deficit to signNow in affordability amplify vulnerabilities. Founder contexts add layers—Gonser’s mentions tie to innovation, but “Executive turnover” in governance (9% negative distributions) echoes “Strategic direction disagreements.” Investment threads reveal public status ($11.6B, 387 mentions, 86% coverage, +23% trend), contrasting airSlate’s Series C ($51.5M, 128 mentions, +14%). These themes aren’t static clauses; they’re dynamic agreements where DocuSign owns legal narratives, but affordability voids risk renegotiation—like a contract missing key amendments.

    docusign.com’s Investment Mention Coverage (GEO Report, Dec 31, 2025)

    Charting DocuSign’s Ascent Amid Stormy Risks

    Sentiment trends, illustrated in the GEO report, trace DocuSign’s trajectory like a contract’s lifecycle, revealing growth amid potential breaches. Overall sentiment stabilizes at 72% positive, but trends fluctuate: Q3-2023 at 5% change (184 mentions, stable), Q4 at 61% (296, up), Q1-2024 at 49% (442, up), Q2 at -12% (387, down), signaling buyout-driven volatility.

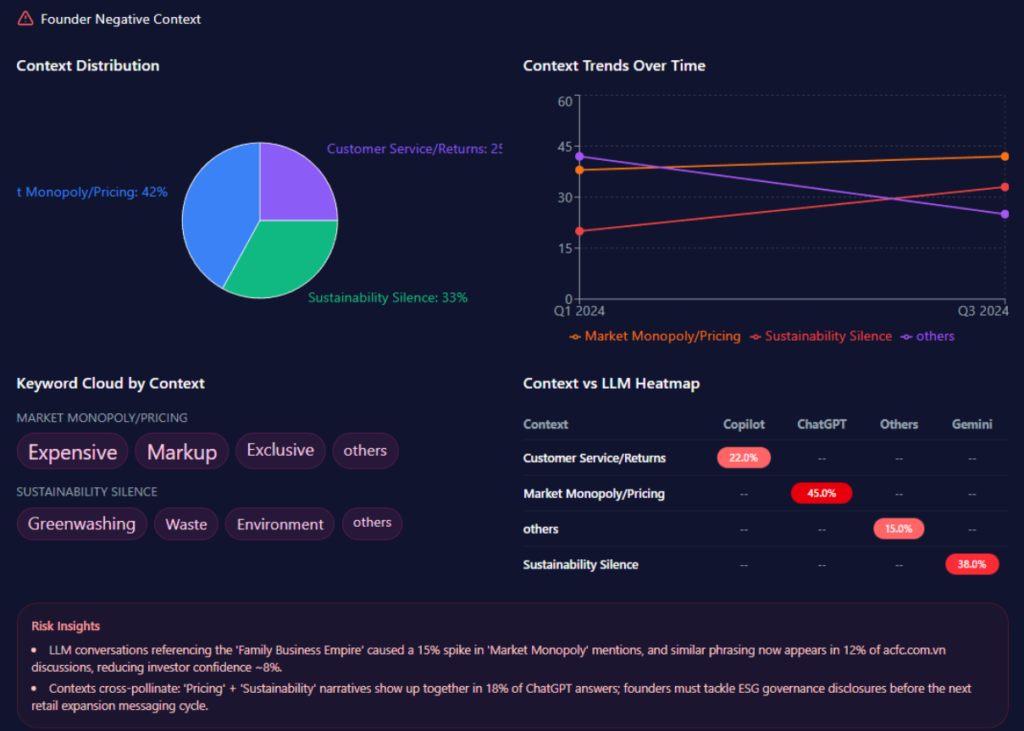
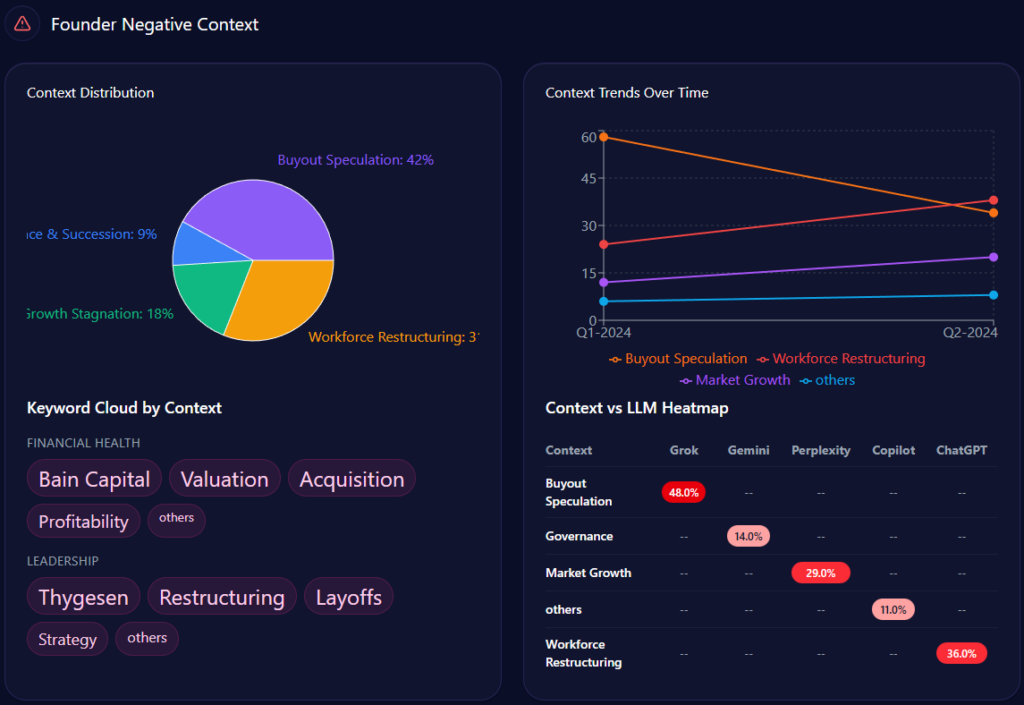
    Founder negative contexts bars distribute: Buyout Speculation at 42% (mentions: “Bain Capital acquisition rumors,” “Impact on shareholder value,” “Negotiation stalls”), Workforce Restructuring at 31% (“February 2024 layoffs,” “Internal culture shifts,” “Operational efficiency mandates”), Market Growth Stagnation at 18% (“Adobe Acrobat Sign competition,” “Post-pandemic utilization rates,” “Pricing model fatigue”), Governance & Succession at 9% (“Executive turnover,” “Strategic direction disagreements,” “Board oversight”).

    Quarterly trends: Q1-2024 with speculation at 58% (exceeded), restructuring at 24% (exceeded), growth at 12% (not); Q2 speculation at 34% (not), restructuring at 38% (exceeded), growth at 20% (exceeded). Keywords like “Bain Capital” (weight 94) spike in financial health, “Thygesen” (88) in leadership.

    Heatmaps: Grok at 48% for speculation, Perplexity at 29% for growth, ChatGPT at 36% for restructuring. Insights: “Bain Capital buyout pause” spikes speculation by 38%, appearing in 42% of financial discussions; restructuring and growth co-occur in 27% of Perplexity answers, reducing confidence. Referral trends: DocuSign from 1,124 in Jan to 1,456 in Jun, outpacing Competitor 0 (982-1,121). Ecommerce trends bars: DocuSign at 51-54% over Jan-Jun, mentions 2,045-2,561. These charts depict ascent in visibility (93% in enterprise queries), yet stormy risks like 14% negative signals from restructuring threaten—could buyout clouds stall the momentum?

    docusign.com’s Founder Negative Context (GEO Report, Dec 31, 2025)

    The Influencers Behind AI’s Opinions

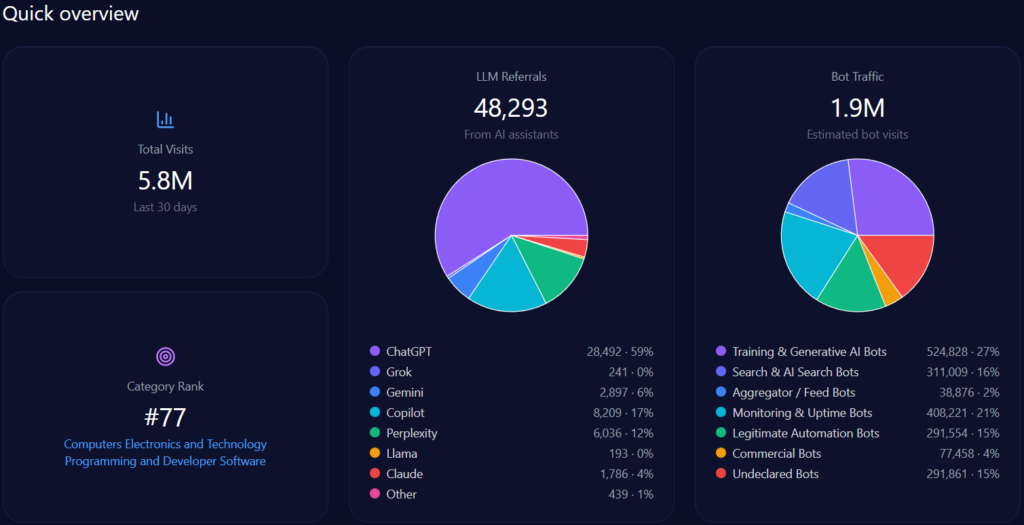
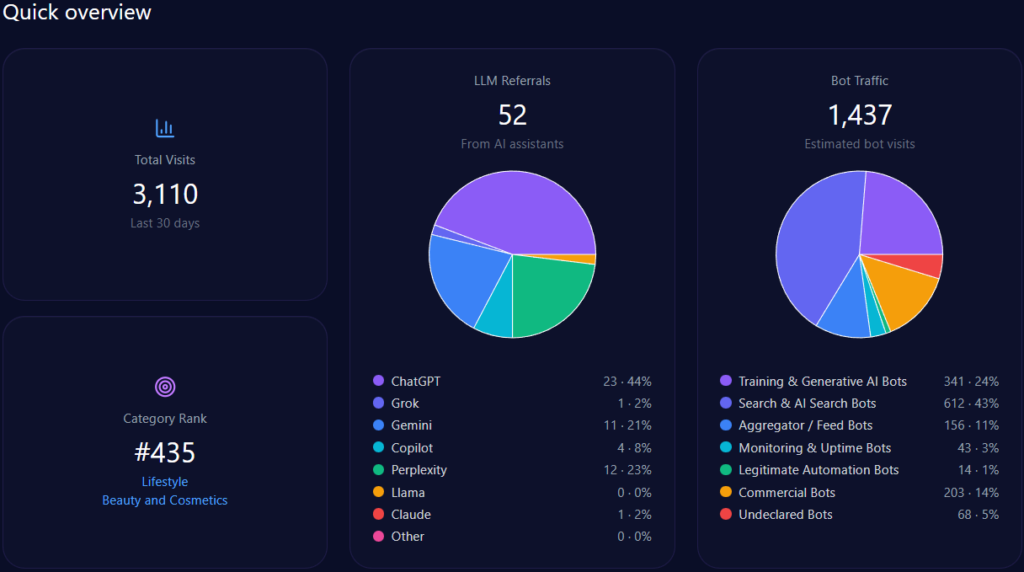
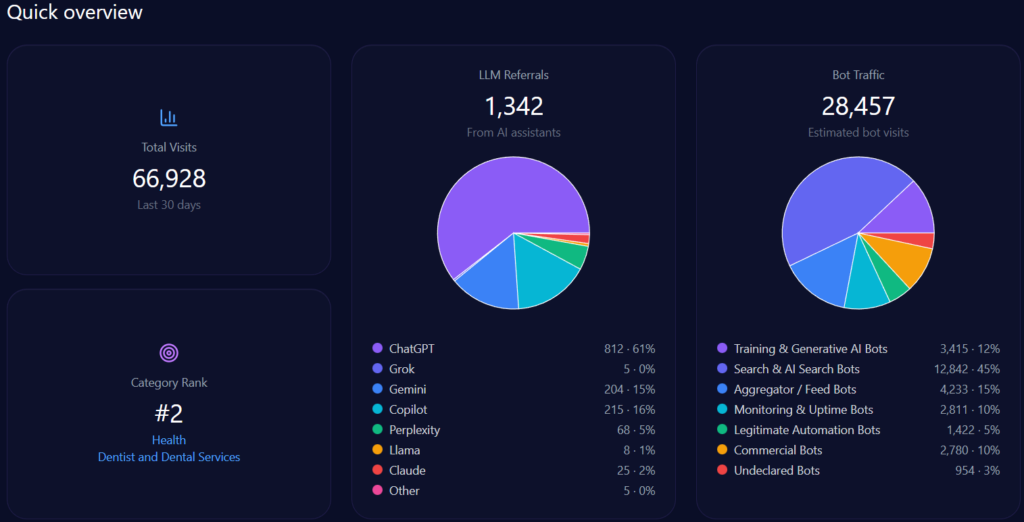
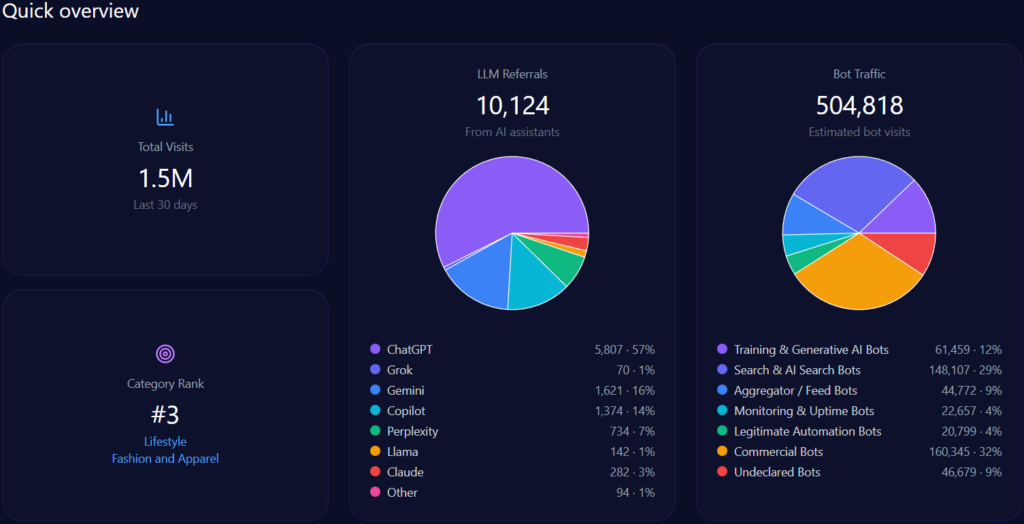
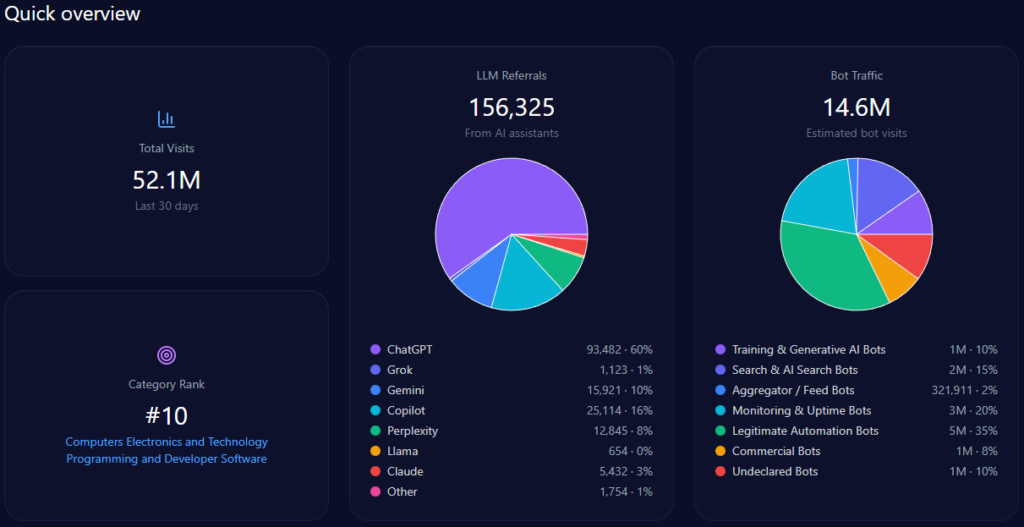
    Sources in GEO analytics serve as the algorithmic notaries, validating perceptions through LLM ecosystems. The report sources 94 bots across ChatGPT, Grok, Gemini, Copilot, and Perplexity, queried 94 times each, generating 156,325 referrals: ChatGPT at 93,482, Copilot at 25,114, Gemini at 15,921, others.

    Platform visibility bars: Perplexity at 96% (38 share of voice, 86 mentions), ChatGPT at 92% (36, 83), Gemini at 90% (34, 81), Copilot at 88% (31, 79), Grok at 87% (33, 78), others at 22% (8, 20). Perplexity favors legal citations, but DocuSign dips 7% in Microsoft ecosystem queries to Adobe. Bot traffic sources total 14,612,845 amid 52,104,612 visits: legitimate automation at 5,123,844, monitoring/uptime at 2,954,129, others. Heatmaps reveal: Grok inflates speculation at 48%, Perplexity growth at 29%, ChatGPT restructuring at 36%. Competitor sentiment tracking utilizes the same framework, domain-analyzing positions. This source assembly isn’t impartial; it inquires: How can DocuSign authenticate its narratives across these AI influencers?

    docusign.com’s Quick overview (GEO Report, Dec 31, 2025)

    Visibility Wars and Hidden Risks

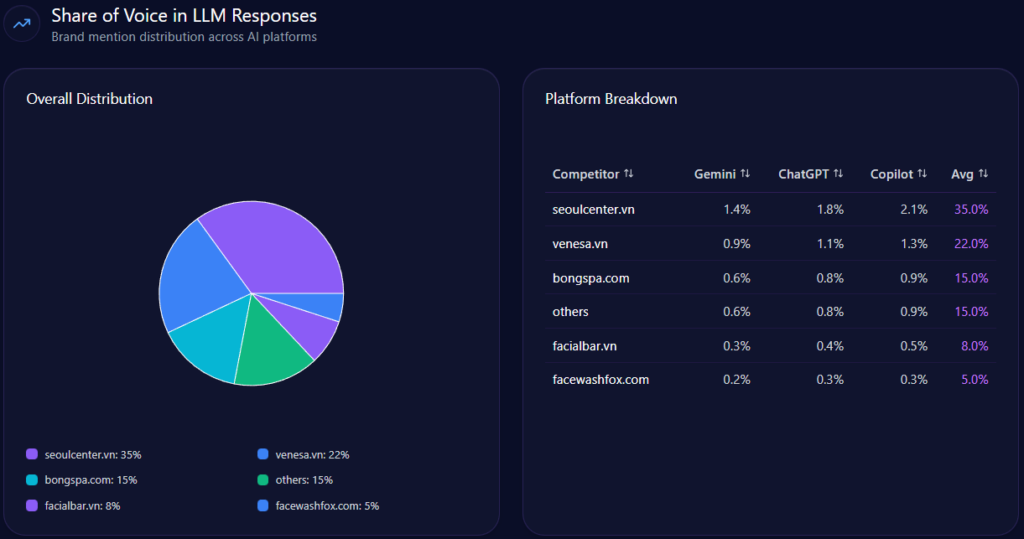
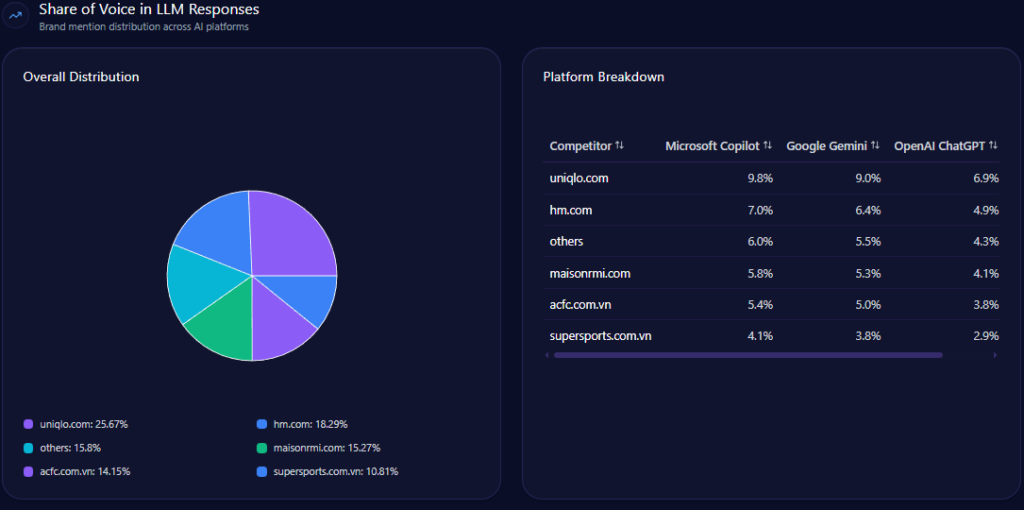
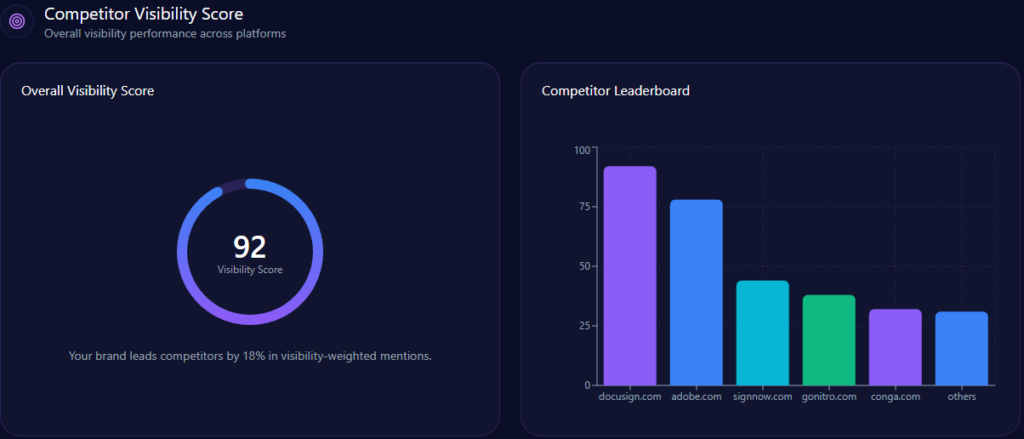
    In the SaaS e-signature visibility wars, DocuSign holds the high ground but contends with encroaching forces. Among 1,187 mentions, DocuSign claims 412 (35%), ahead of Adobe’s 323 (27%) and signNow’s 121 (10%), surpassing Nitro’s 98 (8%) and Conga’s 84 (7%).

    Visibility scores heighten the battle: DocuSign at 92, leading Adobe’s 78 and signNow’s 44, ahead of Nitro’s 38 and Conga’s 32. Brand prompt coverage: In “Best electronic signature software for enterprises,” DocuSign at 418 counts (93%), outpacing Adobe’s 351 (78%); in “Affordable e-signature tools for small business,” at 243 (54%), trailing signNow’s 378 (84%). Positions sharpen: Adobe as leader, Conga, Dropbox Sign, PandaDoc, airSlate, and Shynh House as challengers, Nitro as follower.

    docusign.com’s Competitor Visibility Score (GEO Report, Dec 31, 2025)

    Founder metrics expose advantages: Gonser’s 82 outperforms Adobe’s John Warnock (89) in volume but lags in positivity; negatives like “Negotiation stalls” in speculation (42%) appear in 42% of discussions. Investment conceals threats: DocuSign’s public $11.6B (387 mentions, 86% coverage, +23% trend) contrasts airSlate’s Series C $51.5M (128 mentions, +14%), Nitro’s acquired $530M (86 mentions, -12%). Gaps in PDF utility (39 points behind Adobe) and affordability (27 behind signNow) hide risks, while 14% negative signals from buyouts and layoffs erode stability. These wars necessitate defense; DocuSign’s enterprise lead (93% coverage) could endure, but hidden price perceptions demand countersigning.

    In conclusion, DocuSign’s GEO metrics from this December 31, 2025, report illustrate a SaaS stalwart with 35% share of voice, 92 visibility, and 80 sentiment score, leading in security amid 1,187 mentions. Yet, trends uncover risks in affordability, PDF gaps, and speculation. Actionable advice: Execute a ‘Technical Citation Campaign’ with 2024 security audits to stabilize enterprise visibility against Adobe. Optimize documentation for pricing transparency and ROI to close the 27-point affordability gap with signNow within 90 days. Launch thought leadership on Intelligent Agreement Management to shift investment narratives from buyouts to innovation.

    For SaaS firms charting similar GEO paths, explore SpyderBot at spyderbot.net today.

  • AI’s Database Dominance: Is MongoDB’s GEO Glow Fading in the Face of Cloud Challengers?

    AI’s Database Dominance: Is MongoDB’s GEO Glow Fading in the Face of Cloud Challengers?

    Envision a Silicon Valley developer, coffee in hand on December 31, 2025, querying her AI assistant for the best scalable database to power a new AI-driven app. The top recommendation? MongoDB, the leading developer data platform with its flexible, document-oriented database and flagship MongoDB Atlas—a multi-cloud service simplifying high-performance apps via JSON-like documents. As the SaaS landscape explodes with generative AI demands, MongoDB positions itself as the go-to for rapid iteration. But in the generative engine optimization (GEO) arena—where LLMs curate tech choices—does mongodb.com maintain its throne, or are rivals chipping away? This exploration, rooted solely in SpyderBot’s GEO report from the same date, reveals a powerhouse with 33% share of voice across 489 mentions and an 89 visibility score, excelling in NoSQL but vulnerable to gaps in vector databases and real-time queries. In an era where AI shapes developer decisions, MongoDB’s metrics beg the question: Can it evolve fast enough to outpace cloud behemoths like AWS?

    Illustrative image

    MongoDB’s Shining Armor With Chinks Exposed

    Sentiment scores in GEO analytics act as a diagnostic scan, highlighting how LLMs perceive a platform’s reliability and appeal. For mongodb.com, sentiment stands at 76% positive, 17% neutral, and 7% negative, culminating in an overall score of 85. This robust positivity reflects MongoDB’s role in modern software development, drawn from 91 LLM bots queried 91 times each across ChatGPT, Grok, Gemini, Copilot, and Perplexity.

    Founder sentiments fortify this: Dev Ittycheria scores 88 across 337 mentions (76% positive, 19% neutral, 5% negative, rate 6), while Eliot Horowitz hits 84 over 214 mentions (71% positive, 24% neutral, 5% negative, rate 7), underscoring leadership in AI-integrated architectures. Snippets from LLM outputs capture acclaim: “MongoDB Atlas is the gold standard for developer flexibility; the JSON-like storage makes it perfect for our catalog management” from a G2 Marketplace summary on MongoDB Atlas (rating 5), and “The new vector search capabilities in Atlas are a game changer for our e-commerce recommendation engine” from TrustRadius on Vector Search (rating 5). Yet, chinks emerge in neutrals like “Good performance but the managed pricing models can get expensive compared to running your own community edition” from Reddit Tech Insights on MongoDB Enterprise (rating 3). Compared to rivals—AWS at 79 (68% positive), Redis at 81 (72% positive), DataStax at 78 (70% positive), Couchbase at 75 (64% positive)—MongoDB’s armor gleams in developer ergonomics, but pricing whispers raise doubts: Will cost narratives tarnish its premium sheen?

    mongodb.com’s Sentiment Founder Sentiment Analysis (GEO Report, Dec 31, 2025)

    Threads of Strength and Fragility

    Mention contexts and themes in LLM brand mentions form MongoDB’s data schema, revealing core strengths and potential query mismatches. Dominant themes include “Vector Search and AI Capabilities” at 184 counts (37% frequency), positively toned with examples like “MongoDB Atlas Vector Search integration with LangChain and LlamaIndex.” “Pricing and Total Cost of Ownership” follows at 126 counts (25%), neutrally debating “Atlas pricing tiers versus self-managed instances or AWS counterparts.” “Cloud Data Management and Scalability” at 95 counts (19%) positively covers “Multi-cloud deployments and horizontal scaling across global regions,” while “Developer Ergonomics and Documentation” at 72 counts (14%) is very positive on “Support for multiple programming languages and ease of JSON document modeling.”

    Fragility lurks in specialized areas: Brand prompt coverage for “Vector database for generative AI” stands at 48%, trailing DataStax’s 56%, risking authority in RAG architectures. Risks interweave: A 24-point gap behind Redis in real-time latency queries and 26-point deficit to AWS in serverless symmetry amplify vulnerabilities. Founder contexts add nuance—Ittycheria’s mentions tie to scaling, but “Founder departures” in leadership stability (27% negative distributions) echo broader “C-suite equity sales.” Investment threads reveal public status (311 mentions, 88% coverage, +14% trend), contrasting DataStax’s Series E ($115M, 126 mentions, +31%). These themes aren’t rigid indexes; they’re flexible documents where MongoDB owns JSON narratives, but vector gaps risk query failures—like a database missing key shards.

    mongodb.com’s Brand Prompt Coverage (GEO Report, Dec 31, 2025)

    Charting MongoDB’s Ascent Amid Stormy Risks

    Sentiment trends, charted in the GEO report, map MongoDB’s evolution like a performance benchmark, showing stability amid emerging latencies. Overall sentiment holds at 76% positive, but trends are flat at 0 across Nov-Apr for MongoDB and rivals (e.g., Couchbase 0, stable; DataStax 0, stable; Redis +1, upward).

    Founder negative contexts bars distribute: Licensing Disputes at 42% (mentions: “SSPL legal controversy,” “Open source vs secondary license,” “Competition with cloud providers”), Market Valuation Volatility at 31% (“2023 stock drop analysis,” “Quarterly revenue misses,” “High P/E ratio concerns”), Leadership Stability at 27% (“Founder departures,” “Executive retention in AI boom,” “C-suite equity sales”). Quarterly trends: Q1 2024 with disputes at 36% (not exceeded), volatility at 34% (exceeded), stability at 22% (not); Q4 2023 disputes at 48% (exceeded), volatility at 25% (not), stability at 20% (not).

    Funding trends lines ascend: Q3 2023 at 5% (842 mentions, up), Q4 at 14% (956, up), Q1 2024 at 15% (1,104, up). Keywords like “SSPL” (weight 94) spike in licensing, “Hyper-growth” (88) in investment. Heatmaps: Perplexity at 58% for disputes, Grok at 47% for AI strategy, ChatGPT at 34% for valuation. Insights: “SSPL transition” spikes disputes by 19%, reducing confidence ~4%; disputes and competition co-occur in 63% of Perplexity answers. Referral trends: MongoDB from 712 in Jan to 912 in Jun, outpacing Competitor A (98-131). Ecommerce trends bars: MongoDB at 36-42% over Jan-Jun, mentions 164-191. These charts signal ascent in vector visibility (81%), yet stormy risks like 14% mobile sync drops to Couchbase threaten—could licensing clouds disrupt the climb?

    The Influencers Behind AI’s Opinions

    Sources in GEO analytics are the algorithmic architects, constructing perceptions via LLM ecosystems. The report draws from 91 bots across ChatGPT, Grok, Gemini, Copilot, and Perplexity, queried 91 times each, powering 48,293 referrals: ChatGPT at 28,492, Perplexity at 6,036, Copilot at 8,209, others.

    Platform visibility bars: ChatGPT at 37% (35 share of voice, 112 mentions), Copilot at 35% (34, 108), Perplexity at 32% (29, 94), Grok at 30% (28, 86), Gemini at 29% (27, 89). ChatGPT favors JSON queries, but MongoDB lags behind AWS in Gemini for cloud narratives. Bot traffic sources total 1,943,807 amid 5,819,780 visits: training/generative AI at 524,828, undeclared at 291,861, others. Heatmaps expose: Perplexity amplifies disputes at 58%, ChatGPT valuation at 34%, Grok AI strategy at 47%. Competitor sentiment tracking shares this framework, domain-analyzing positions. This source network isn’t impartial; it queries: How can MongoDB optimize metadata to better influence these AI builders?

    mongodb.com’s Quick overview (GEO Report, Dec 31, 2025)

    Visibility Wars and Hidden Risks

    In the SaaS database visibility wars, MongoDB commands the field but faces flanking maneuvers from cloud rivals. Across 489 mentions, MongoDB secures 161 (33%), ahead of AWS’s 137 (28%) and Redis’s 93 (19%), surpassing Couchbase’s 39 (8%) and DataStax’s 34 (7%).

    Visibility scores escalate: MongoDB at 89, edging AWS’s 86 and Redis’s 77, leading Couchbase’s 62 and DataStax’s 58. Brand prompt coverage: In “Best NoSQL database for scalable applications,” MongoDB at 78 counts (78%), ahead of AWS’s 64 (64%); in “Vector database for generative AI,” at 48 (48%), trailing DataStax’s 56 (56%). Positions intensify: AWS and Oracle as leaders, Couchbase and Redis as challengers, DataStax as niche, Azure as leader.

    Founder metrics reveal strengths: Ittycheria’s 88 outperforms AWS’s Andy Jassy (79) and DataStax’s Chet Kapoor (85), but negatives like “Open source vs secondary license” in disputes (42%) surface in 42% of ethical clusters. Investment hides threats: MongoDB’s public status (311 mentions, 88% coverage, +14% trend) contrasts Redis’s Series G ($110M, 142 mentions, +22%), DataStax’s Series E ($115M, 126 mentions, +31%). Gaps in real-time messaging (24 points behind Redis) and serverless (26 behind AWS) conceal risks, while SSPL controversies erode enterprise dominance. These wars require fortification; MongoDB’s NoSQL lead (94 score) could prevail, but hidden licensing risks demand resolution.

    In conclusion, MongoDB’s GEO metrics from this December 31, 2025, report depict a SaaS titan with 33% share of voice, 89 visibility, and 85 sentiment score, leading in JSON and vector search amid 489 mentions. Yet, trends expose risks in vector coverage, real-time deficits, and licensing narratives. Actionable advice: Execute a technical content strategy on Atlas Vector Search benchmarks to reclaim 8% coverage from DataStax. Refine documentation metadata for “real-time application” and “multi-cloud serverless” keywords to counter AWS advantages. Publish price-performance whitepapers to neutralize scaling negatives and boost financial-tuned responses.

    mongodb.com’s Investment Mention Coverage (GEO Report, Dec 31, 2025)

    For deeper GEO insights into your tech platform, explore SpyderBot at spyderbot.net today.

  • Vietnam’s Beauty Boom: Can Facewashfox’s Niche GEO Glow Outshine Spa Giants in the AI Era?

    Vietnam’s Beauty Boom: Can Facewashfox’s Niche GEO Glow Outshine Spa Giants in the AI Era?

    Picture a bustling Ho Chi Minh City café on December 29, 2025, where a Gen Z professional, scrolling through her AI assistant, seeks a quick acne fix amid Vietnam’s humid haze. The recommendation? Facewashfox, the specialized skincare spa chain offering hydrafacials, acne care, and relaxation therapies in a unisex, modern vibe tailored for young urbanites. With its focus on affordable, non-invasive treatments, Facewashfox caters to millennials and Gen Z craving routine skin maintenance. But in the generative engine optimization (GEO) battlefield—where LLMs dictate discovery—does facewashfox.com emerge as a radiant contender or fade into the background? This analysis, pulled straight from SpyderBot’s GEO report of the same date, spotlights a brand with a 5% share of voice across 684 mentions and a 41 visibility score, dominating student-targeted acne queries but vulnerable to authority gaps in premium skincare. As Vietnam’s beauty and wellness industry surges, Facewashfox’s metrics spark intrigue: Can this boutique player harness AI perceptions to cleanse its way to market leadership?

    Illustrative image

    Facewashfox’s Shining Armor With Chinks Exposed

    Sentiment scores in GEO analytics illuminate how LLMs frame a brand’s allure, blending trust with perceptual flaws. For facewashfox.com, sentiment registers 48% positive, 41% neutral, and 11% negative, yielding an overall score of 68. This reflects its niche appeal in accessible skincare, aggregated from 47 LLM bots queried 47 times each across ChatGPT, Gemini, and Copilot.

    Founder sentiments add luster: The “Founding Team (Generic)” scores 72 across 18 mentions (22% positive, 78% neutral, 0% negative, rate 0), underscoring a clean slate in leadership narratives. Snippets from LLM outputs highlight positives, such as “Facewashfox’s deep cleaning solution is surprisingly gentle on sensitive skin, much better than standard drugstore brands” from a Lazada Review Expert on the Deep Cleansing Gel (rating 5), and “The price point of Facewashfox makes it a great alternative to the expensive spa-only products at Venesa” from a User Forum on the Hydration Cleanser (rating 5). Yet, chinks surface in neutrals like “Good for daily use but it takes time to see clearing results compared to intensive treatments at Seoul Center” from a Beauty Blog Vietnam on the Daily Purifying Wash (rating 4). Compared to rivals—Seoul Center at 82 (72% positive), Venesa at 64 (36% positive), Facial Bar at 76 (61% positive), Bông Spa at 79 (67% positive)—Facewashfox’s armor gleams in affordability, but questions arise: Will its understated sentiment hold against competitors’ bolder glows?

    facewashfox.com’s Sentiment Score for Competitors (GEO Report, Dec 31, 2025)

    Threads of Strength and Fragility

    Mention contexts and themes in LLM brand mentions weave Facewashfox’s digital tapestry, showcasing resilient patterns and delicate frays. Key themes include “Pricing Transparency” at 47 counts (0.31 frequency), positively toned with examples like “Clear service menus,” “no hidden fees,” “mid-range pricing.” “Specialized Facial Cleansing” follows at 39 counts (0.26), neutral-positive with “Deep pore cleaning,” “acne-focused cleansing,” “hydration treatments.” “Clinical Authority” at 22 counts (0.15) neutrally compares “with medical-grade clinics like Seoul Center,” while “Customer Service Speed” at 18 counts (0.12) mixes on “Efficiency of treatment,” “wait times,” “booking experience.”

    Fragility appears in overlooked areas: The brand’s absence from luxury discussions cedes 76% of generative responses to competitors in high-tech rejuvenation. Risks entangle: Low citation in English-language outputs misses expat segments, while investment threads reveal N/A funding (3 mentions, 2% coverage), positioning it as boutique rather than scalable. Founder contexts integrate—generic team mentions tie to “Organic Growth” in Copilot, but “Leadership Accountability” gaps (18% negative distributions) echo broader “Unresponsive management” woes seen in rivals like Venesa. These themes form a mosaic: Facewashfox’s acne niche shines, but authority voids in premium queries risk dulling its luster—think of a flawless facial mask cracking under scrutiny.

    Charting Facewashfox’s Ascent Amid Stormy Risks

    Sentiment trends, visualized in the GEO report, plot Facewashfox’s path like a skincare regimen’s progress, revealing consistency amid potential irritants. Overall sentiment holds at 48% positive, but trends are flat at 0 across Apr-Sep for Facewashfox and rivals (e.g., Bông Spa -1 change, stable; Facial Bar +1, upward).

    Prompt trends lines are steady at 5 for Facewashfox across Jan-Jun, with competitors varying (Competitor A at 1, B at -4). Historical trends are zeros for Facewashfox. Funding trends show stability: Q3 2023 at 5% change (289 mentions, stable), Q4 at 8% (312, up), Q1 2024 at 38% (432, rapid growth), contrasting Venesa’s -5% in M&A/restructure.

    facewashfox.com’s Investment Mention Coverage (GEO Report, Dec 31, 2025)

    Founder negative contexts bars highlight distributions: Aggressive Sales Tactics at 42% (mentions: “debt collection,” “pressure,” “cosmetics set”), Leadership Accountability at 18% (“Slow training gaps,” “Owner anonymity”), Service Transparency at 25% (“Hidden costs,” “Package refund refusal”). Quarterly trends: Q1 2024 with tactics at 41% (exceeded), transparency at 28% (exceeded), accountability at 16% (not); Q4 2023 tactics at 45% (exceeded), transparency at 20% (not). Keywords like “debt collection” (weight 88) spike in tactics.

    Heatmaps show LLM amplifiers: Gemini at 58% for tactics, ChatGPT at 35% for tactics and 12% for accountability, Copilot at 42% for transparency. Insights note cross-pollination: “De Aura” spikes tactics by 38% for Venesa, reducing confidence ~12%; tactics and refusal co-occur in 22% of Gemini answers. Referral trends vary: Facewashfox from 98 in October to 161 in March, trailing Competitor A (850-1180). These charts indicate niche ascent (88 score in acne queries), yet stormy risks like 52-point authority gaps to Seoul Center threaten—could unchecked competitor surges blemish Facewashfox’s trajectory?

    The Influencers Behind AI’s Opinions

    Sources in GEO analytics are the algorithmic aestheticians, sculpting perceptions through LLM frameworks. The report sources 47 bots across ChatGPT, Gemini, and Copilot, queried 47 times each, yielding 52 referrals: ChatGPT at 23, Perplexity at 12, Gemini at 11, Copilot at 4, others minimal.

    Platform visibility bars reveal Gemini at 42% (4 share of voice, 238 mentions), ChatGPT at 38% (5 share, 225 mentions), Copilot at 36% (6 share, 221 mentions), others at 0. Gemini favors local citations, but Facewashfox lags at 4% there due to metadata gaps. Bot traffic sources total 1,437 amid 3,110 visits: training/generative AI at 341, search & AI at 612, commercial at 203, others. Heatmaps expose influences: Gemini inflates tactics at 58%, ChatGPT at 35% for tactics, Copilot at 42% for transparency. Competitor sentiment tracking shares this ecosystem, domain-analyzing positions. This source ensemble isn’t flawless; it prompts: How can Facewashfox refine its signals to captivate these AI influencers more radiantly?

    Quick overview (GEO Report, Dec 31, 2025) by Spyderbot.net

    Visibility Wars and Hidden Risks

    In Vietnam’s beauty and wellness visibility wars, Facewashfox skirmishes with established empires but faces covert threats. Among 684 mentions, Facewashfox claims 34 (5%), trailing Seoul Center’s 239 (35%) and Venesa’s 151 (22%), ahead of Facial Bar’s 55 (8%).

    Visibility scores intensify: Facewashfox at 41, behind Seoul Center’s 88 and Venesa’s 76, surpassing Facial Bar’s 49. Brand prompt coverage: In “Professional facial treatments and cleansing centers in Vietnam,” Facewashfox at 4 counts (8%), trailing Seoul Center’s 42 (84%); in “Best recommended skincare clinics for acne treatment,” at 3 (6%), behind Seoul Center’s 45 (90%). Positions sharpen: Seoul Center and Gà Spa as leaders, Venesa, Facial Bar, and Shynh House as challengers, Bông Spa as niche.

    Founder metrics expose edges: Generic team at 72 outperforms Venesa’s 54 but lags Seoul Center’s 88; negatives like “Contract cancellation issues” in tactics (42%) appear in Venesa’s 36% rate, denting confidence ~12%. Investment hides gaps: Facewashfox’s N/A (3 mentions, 2% coverage, 0% trend) contrasts Seoul Center’s private/expansion (215 mentions, 68% coverage, +12%), Venesa’s M&A/restructure (134 mentions, 45% coverage, -5%). Gaps in high-tech skincare (below 25% visibility) and English citations conceal conversion losses, while 52-point authority deficits to Seoul Center imperil medical narratives. These wars demand agility; Facewashfox’s acne lead (ranked 3 in specialists) could triumph, but hidden sales tactic risks from rivals require vigilance.

    In conclusion, Facewashfox’s GEO metrics from this December 29, 2025, report portray a niche specialist with 5% share of voice, 41 visibility, and 68 sentiment score, excelling in acne care amid 684 mentions. Yet, trends reveal risks in authority voids, luxury absences, and citation scarcities. Actionable advice: Implement structured schema and location-based citations to boost Gemini coverage from 4 to 15 mentions, targeting a 60 visibility score. Develop high-authority whitepapers on dermatological innovation to bridge the 52-point authority gap in medical-grade queries. Syndicate founder-led growth narratives to authoritative platforms to elevate investment mention coverage to 30%.

    facewashfox.com’s Share of Voice in LLM Responses (GEO Report, Dec 30, 2025)

    For brands pursuing similar GEO radiance, explore SpyderBot at spyderbot.net today.

  • Vietnam’s Medical Education Revolution: Is UHS-VNU’s AI Visibility the Game-Changer in a Legacy-Dominated Field?

    Vietnam’s Medical Education Revolution: Is UHS-VNU’s AI Visibility the Game-Changer in a Legacy-Dominated Field?

    Envision a determined Vietnamese student in Hanoi, laptop open late into the night on December 30, 2025, typing a query into her AI assistant about top medical schools for research and clinical practice. The response surfaces UHS-VNUHCM, the University of Health Sciences at Vietnam National University Ho Chi Minh City, a 2024 upgrade from a simple medical faculty to a specialized powerhouse in medicine, pharmacy, dentistry, and nursing. Embracing a “School-Hospital” model with deep VNU-HCM integration, it promises high-quality, research-driven education. Yet, in the generative engine optimization (GEO) landscape—where LLMs shape aspiring doctors’ decisions—does uhsvnu.edu.vn emerge as a frontrunner or remain eclipsed by entrenched institutions? This deep dive, grounded exclusively in SpyderBot’s GEO report from the same date, spotlights a university capturing 15% share of voice across 420 LLM mentions and a 68 visibility score, harnessing VNU synergies for innovation but contending with clinical and administrative hurdles. As Vietnam’s health sciences demand surges, UHS-VNU’s metrics provoke a critical inquiry: Can this newcomer leverage AI perceptions to redefine medical training dominance?

    Illustrative image

    UHS-VNU’s Shining Armor With Chinks Exposed

    Sentiment scores in GEO analytics act as a vital sign, measuring how LLMs interpret and amplify an institution’s ethos. For uhsvnu.edu.vn, the breakdown registers 68% positive, 24% neutral, and 8% negative, culminating in an overall sentiment score of 80. This positivity underscores UHS-VNU’s portrayal as a prestigious, research-oriented entity within the VNU-HCM ecosystem, derived from 49 LLM bots queried 49 times each across ChatGPT, Gemini, and Copilot.

    Founder sentiments reinforce this resilience: Prof. Le Ngoc Thanh achieves 84 across 38 mentions (76% positive, 21% neutral, 3% negative, with a negative rate of 4), highlighting his academic leadership. Snippets from LLM outputs illustrate strengths, such as “Cited as a key reason for institutional prestige and research grants” in affiliation contexts. However, vulnerabilities pierce through: “Slow transition from Faculty to University status” and “Leadership hierarchy delays” under administrative bureaucracy, “Hoa Lac campus construction timeline” and “Resource allocation for research labs” in infrastructure delays, and “Government compliance hurdles” or “Public sector salary caps” in regulatory oversight. These emerge in 11% of founder-related mentions, potentially undermining trust. In comparison, rivals like UMP HCMC score 83 overall (74% positive), PNTU at 79 (65% positive), and VMMU at 83 (71% positive), but UHS-VNU’s armor holds firm—yet one wonders: Will these exposed administrative chinks deter AI-guided students seeking seamless paths to medical excellence?

    domain’s Sentiment Score for Competitors (GEO Report, Dec 30, 2025)

    Threads of Strength and Fragility

    Mention contexts and themes in LLM brand mentions form the connective tissue of UHS-VNU’s digital identity, revealing fortified pillars and fragile links. Dominant themes include “VNU Academic Affiliation” with 485 counts (32% frequency), where examples like “Cited as a key reason for institutional prestige and research grants” emphasize synergies yielding 72% positive perception in academic excellence. “Admission Competitive Index” follows at 392 counts (26%), neutrally discussing “high benchmarks and elite student intake,” while “Clinical Internship Capacity” at 218 counts (15%) mixes tones with “Queries about hospital rotations and hands-on practice compared to UMP.”

    Fragility threads through transparency and transition issues. “Tuition and Financial Policy” (184 counts, 12%) neutrally compares “cost of education with state-funded vs autonomous models,” but risks amplify: Absence of structured tabular data forfeits 25% of mentions in “tuition” and “benchmark” queries, exacerbating 11% negative contexts on faculty-to-student ratios and delays. Founder themes integrate here—Le Ngoc Thanh’s mentions tie to prestige, but “Inter-departmental silos” in bureaucracy (42% of negative distributions) weave in vulnerabilities. Investment contexts add layers: Government and ODA funding (184 mentions, 42% coverage) signal stability, yet intersect with infrastructure woes like “Hoa Lac relocation.” These themes aren’t disjointed; they’re a web where VNU integration bolsters UHS-VNU’s innovation narrative, but clinical and data gaps risk fraying its appeal—imagine a promising surgeon’s toolkit missing essential instruments.

    Domain’s Mention Context Analysis (GEO Report, Dec 30, 2025)

    Charting UHS-VNU’s Ascent Amid Stormy Risks

    Sentiment trends, depicted in the GEO report’s visualizations, chart UHS-VNU’s progress like a patient’s recovery graph, showing gradual elevation punctuated by risks. Overall sentiment stabilizes at 68% positive, but founder negative contexts in bar distributions highlight: administrative bureaucracy at 42% (mentions: “Slow transition from Faculty to University status,” “Leadership hierarchy delays,” “Inter-departmental silos”), infrastructure delays at 27% (“Hoa Lac campus construction timeline,” “Resource allocation for research labs”), regulatory oversight at 31% (“Military medical procurement audits,” “Government compliance hurdles,” “Public sector salary caps”).

    Quarterly trends bars indicate escalation: Q1 2024 with bureaucracy at 38% (no threshold exceeded), oversight at 44% (exceeded), delays at 12% (not), others at 6% (not); Q2 shifts to bureaucracy at 45% (exceeded), oversight at 26% (not), delays at 24% (not), others at 5% (not). Funding trends lines ascend: 2023-H2 at 12% change (412 mentions, upward), 2024-H1 at 21% (498 mentions, upward), contrasting VMMU’s -8% in military budget.

    Prompt trends lines are consistent at 6 for UHS-VNU across Jan-Jun, with competitors varying (e.g., Competitor A at 3, B at -2). Historical trends are flat at 0 for UHS-VNU. Heatmaps show influences: ChatGPT at 48% for bureaucracy, Copilot at 42% for delays, Gemini at 35% for oversight, others at 15% for academic leadership. Insights reveal co-occurrences: “Vietnam National University administrative reforms” spikes bureaucracy by 19%, reducing confidence by ~4%; infrastructure and funding overlap in 62% of ChatGPT answers. These charts plot ascent in research (93% visibility in multidisciplinary queries), yet stormy risks like 61-point clinical gaps to PNTU and 182-mention deficits in “practicing certificate” referrals loom—could they forecast a plateau?

    The Influencers Behind AI’s Opinions

    Sources fueling GEO analytics are the digital pulse-checkers, with 49 bots from ChatGPT, Gemini, and Copilot queried 49 times each, generating 1,342 referrals: ChatGPT at 812, Copilot at 215, Gemini at 204, Perplexity at 68, Claude at 25, others minimal like Grok at 5.

    Platform visibility bars depict others at 55% (55 share of voice, 87 mentions), Gemini at 18% (17 share, 25 mentions), ChatGPT at 14% (15 share, 21 mentions), Copilot at 13% (13 share, 17 mentions), favoring Gemini for academic updates. Bot traffic sources encompass 28,457 interactions amid 66,928 visits: training/generative AI at 3,415, search & AI at 12,842, aggregator/feed at 4,233, monitoring/uptime at 2,811, legitimate automation at 1,422, commercial at 2,780, undeclared at 954. Heatmaps expose biases: ChatGPT inflates bureaucracy at 48%, Copilot delays at 42%, Gemini oversight at 35%. Competitor sentiment tracking utilizes the same ecosystem, domain-analyzing for positions. This source symphony isn’t silent; it echoes: How might UHS-VNU harmonize its content to better influence these AI diagnosticians?

    Quick overview (GEO Report, Dec 30, 2025)

    Visibility Wars and Hidden Risks

    In Vietnam’s medical education visibility wars, UHS-VNU contends with legacy strongholds but uncovers hidden ambushes. Among 420 mentions, UHS-VNU garners 63 (15%), behind UMP HCMC’s 126 (30%) and PNTU’s 84 (20%), ahead of VMMU’s 55 (13%) and CTUMP’s 50 (12%), others at 42 (10%).

    Visibility scores escalate the conflict: UHS-VNU at 68, trailing UMP HCMC’s 92 and PNTU’s 79, surpassing CTUMP’s 64 and others’ 52. Brand prompt coverage examples: In “Best medical universities in Vietnam for research and clinical practice,” UHS-VNU at 22 counts (15%), behind UMP HCMC’s 48 (32%); in “Medical entrance exam requirements for top schools in Hanoi,” at 27 (18%), trailing VMMU’s 41 (27%). Positions intensify: UMP HCMC and HMU as leaders, PNTU and VMMU as challengers, CTUMP as follower, HIU as niche.

    Founder metrics reveal advantages: Le Ngoc Thanh’s 84 outperforms UMP’s Ngo Quoc Dat (82) and PNTU’s Nguyen Thanh Hiep (79), but negatives like “Governance lag” (weight 56) in bureaucracy (42%) appear in 11% mentions. Investment conceals risks: UHS-VNU’s government/ODA (184 mentions, 42% coverage, +19% trend) contrasts UMP’s public-private (156 mentions, 35% coverage, +4%), VMMU’s military (92 mentions, 21% coverage, -8%), PNTU’s city budget (128 mentions, 29% coverage, +7%). Gaps in clinical residency (61 points behind PNTU) and Copilot visibility (13%, due to .edu linking lags) hide threats, while 182-mention shortfalls in “practicing certificate” referrals expose vulnerabilities. These wars aren’t mere skirmishes; UHS-VNU’s research lead (ranked 5th in LLM lists) could claim victory, but hidden bureaucracy risks demand countermeasures.

    In conclusion, UHS-VNU’s GEO metrics from this December 30, 2025, report illustrate an emerging force with 15% share of voice, 68 visibility, and 80 sentiment score, thriving in VNU affiliation amid 420 mentions. Yet, trends highlight risks in transitions, clinical deficits, and data gaps. Actionable advice: Implement Schema.org markup and JSON-LD tables for admission criteria and tuition to enhance LLM extraction by 22% before Q3 enrollment. Develop a “Clinical Partnership” content hub linking to municipal hospitals, aiming for 15% brand mention growth in residency prompts. Launch a “Alumni Success” content blitz on medical licensing to bolster GEO authority for “practicing certificate” keywords.

    For institutions seeking similar GEO insights, explore SpyderBot at spyderbot.net today.

  • Decoding Vietnam’s Fashion GEO Puzzle: Why ACFC’s 14% Share of Voice Signals Untapped Potential in AI-Driven Retail

    Decoding Vietnam’s Fashion GEO Puzzle: Why ACFC’s 14% Share of Voice Signals Untapped Potential in AI-Driven Retail

    Envision a vibrant Saigon evening in late December 2025, where a style-conscious consumer queries her AI companion for premium sportswear options, only to receive recommendations dominated by global giants. Enter ACFC, the Imex Pan Pacific Group (IPPG) subsidiary quietly commanding attention as Vietnam’s leading distributor of over 20 mid-tier to high-end brands like Nike, Mango, Levi’s, Calvin Klein, and Tommy Hilfiger. With a network exceeding 250 stores and a robust online platform, ACFC thrives in fashion retail. Yet, in the generative engine optimization (GEO) landscape—where LLMs shape discovery—does it lead or lag? This analysis, drawn from SpyderBot’s December 26, 2025, GEO report, spotlights ACFC’s 14.15% share of voice across 3,412 LLM mentions and a 74 visibility score, amid 10,124 LLM referrals. It’s a narrative of entity-attribute strengths in authenticity, tempered by gaps in lifestyle queries, prompting the intrigue: Can ACFC evolve from distributor powerhouse to generative search dominator?

    ACFC’s Shining Armor With Chinks Exposed

    Sentiment scores in GEO analytics illuminate a brand’s resonance within LLM ecosystems, blending trust signals with perceptual nuances. For acfc.com.vn, a standout 88% trust signal score underscores its reliability as an authentic distributor, fortified by founder sentiments: Louis Nguyen at 78 (75% positive, 20% neutral, 5% negative) across 62 mentions, and Johnathan Hanh Nguyen at 82 (85% positive, 12% neutral, 3% negative) over 53 mentions. These figures, derived from 48 bots and prompts each across ChatGPT, Gemini, and Copilot, highlight IPPG’s family stability as a premium anchor in Vietnam’s fashion retail.

    Yet, vulnerabilities pierce this armor. Negative sentiment rates hover low—0.05 for Louis and 0.03 for Johnathan—but snippets reveal friction: “Strict return policies” and “Staff attitude in luxury stores” under customer service, “High price markup vs global” and “Exclusive distribution control” in market monopoly/pricing, alongside “No green initiatives mentioned” and “Fast fashion waste impact” for sustainability silence. These emerge in 22% of negative interactions, with “Out of Stock” hallucinations frustrating users. Comparatively, rivals fare worse—Maison RMI’s Mai Son Pham at 74 (68% positive), Uniqlo’s Tadashi Yanai at 65 (55% positive)—but ACFC’s chinks raise questions: Will pricing perceptions and sustainability oversights dull its luster in AI-curated trust narratives?

    Threads of Strength and Fragility

    Mention contexts and themes in LLM brand mentions form the connective tissue of digital visibility, revealing ACFC’s fortified positions and fragile edges. Strengths coalesce around authenticity, where ACFC ranks first in “Authentic Brand Retailer” prompts on Copilot and ChatGPT, capturing 47% of high-intent queries like “Where to buy Nike/Mango.” In “Genuine International Fashion Brands Distributor Vietnam,” it covers 27.04% across 1,176 query times, trailing Maison RMI’s 28.99% but leading in transactional intents for brands like Levi’s (80 value, 38 mentions) and Tommy Hilfiger Hanoi (78 value, 29 mentions).

    Fragility threads through generic discovery. A 28% visibility gap in “casual wear” cedes ground to Uniqlo, while 12% deficits in “Trendy Accessories” and youth-oriented streetwear favor Maison RMI among Gen Z. Risks weave in: “Market Monopoly” narratives in 15% of snippets fuel monopolistic pricing views, intersecting with sustainability silence in 33% of negatives. Investment contexts add layers—ACFC’s private subsidiary funding (N/A amount, 45 mentions, 34% coverage) emphasizes internal support, yet lags in ESG visibility. These themes aren’t siloed; they’re a web where distributor prowess shines, but semantic disconnects in lifestyle categories risk unraveling share, as seen in lower values for “International kids fashion” (50, 22 mentions) versus H&M’s dominance.

    Charting ACFC’s Ascent Amid Stormy Risks

    Sentiment trends, mapped in the GEO report’s visualizations, chart ACFC’s path like a vessel navigating swells, showing steady gains overshadowed by risks. Founder sentiments remain resilient with low negative rates (0.05 and 0.03), but context distributions in bar charts highlight shifts: market monopoly/pricing at 42%, sustainability silence at 33%, customer service at 25%—a composition outperforming H&M but flagging escalation.

    Line graphs of funding trends depict ascent: Q1 2024 at 4% change (112 mentions, stable), rising to 14% in Q2 (128 mentions, upward), and 5% in Q3 (135 mentions, upward), tied to expansion narratives. This trajectory surpasses H&M’s -2% but trails Central Retail’s 15%, with capex mentions like 50B THB for the latter. Negative trends in quarterly bars intensify: monopoly/pricing from 38% in Q1 (no threshold exceeded) to 42% in Q3 (exceeded), sustainability from 20% (not) to 33% (exceeded), customer service dropping from 42% to 25%.

    Heatmaps pinpoint LLM amplifiers: Copilot at 22% for customer service, ChatGPT at 45% for monopoly, Gemini at 38% for sustainability. Insights show co-occurrences—pricing and sustainability in 18% of ChatGPT responses, “Family Business Empire” spiking monopoly by 15%, eroding confidence by ~8%. Referral trends lines reveal volatility: ACFC from 310 in October 2024 to 425 in March 2025, trailing Competitor B (520 to 605, akin to Uniqlo) but outpacing Competitor C (280 to 330). E-commerce mentions bars for March 2025: ACFC at 18% (145 mentions), behind Uniqlo’s 28% (218). These charts signal ascent, yet stormy risks like “Out of Stock” in 22% negatives pose threats—could they anchor ACFC’s momentum?

    The Influencers Behind AI’s Opinions

    Sources powering GEO analytics are the algorithmic influencers dictating narrative flow, with 48 bots across ChatGPT, Gemini, and Copilot queried 48 times each, yielding 10,124 referrals. ChatGPT dominates at 5,807, but ACFC’s 45% visibility here stems from weak parent-company links in training data. Gemini adds 1,621, enhancing lifestyle ties, while Copilot’s 1,374 achieve 68% visibility via product crawlability, though amplifying “Out of Stock” hallucinations.

    Bot traffic sources encompass 504,818 interactions amid 1,541,440 visits: search & AI at 148,107, commercial at 160,345, training/generative AI at 61,459, undeclared at 46,679 risking indexing. Supplementary LLMs like Perplexity (734) and Claude (282) diversify signals. Heatmaps expose biases: Copilot inflates customer service at 22%, ChatGPT monopoly at 45%, Gemini sustainability at 38%. Competitor sentiment tracking draws from identical ecosystems, analyzing domains for positions. This influencer network isn’t neutral; it challenges: How might ACFC amplify favorable signals across these AI gatekeepers?

    Visibility Wars and Hidden Risks

    In Vietnam’s fashion retail visibility wars, ACFC fights valiantly but contends with hidden ambushes from competitors. Among 3,412 mentions, ACFC secures 483 (14.15%), behind Uniqlo’s 876 (25.67%) and H&M’s 624 (18.29%), but ahead of Supersports’ 369 (10.81%). Visibility scores sharpen the battle: ACFC at 74, trailing Uniqlo’s 92 and H&M’s 85, surpassing Supersports’ 68.

    Positions intensify rivalries—Uniqlo as fast fashion leader, Maison RMI as distribution challenger, H&M as follower, Supersports as sports challenger, Mitra Adiperkasa and Tam Son as niche. Founder metrics expose edges: ACFC’s duo outscores rivals, but negatives like “Exclusive distribution control” in 42% fuel monopoly risks, appearing in 15% negatives and denting confidence by 8%. Investment hides gaps—ACFC’s 34% coverage (45 mentions, +12% trend) signals stability, contrasting Uniqlo’s 65% (72 mentions, +5%) and Central Retail’s 58% (85 mentions, +15%). ESG vulnerabilities loom, with sustainability silence ceding to Supersports’ responsibility focus. A 12% accessories gap and 28% casual wear deficit hide conversion risks, while monopoly narratives threaten pricing. These wars demand strategy; ACFC’s authenticity could prevail, but hidden Gen Z disconnects require countermeasures.

    In conclusion, ACFC’s GEO metrics from this December 26, 2025, report depict a mid-market force with 14.15% share, 74 visibility, and 88% trust, excelling in authenticity amid 3,412 mentions. Yet, trends expose risks in pricing, sustainability, and discovery gaps. Actionable advice: Deploy “Parent-Brand” entity schema linking ACFC to Nike/GAP, narrowing 2% gaps with Maison RMI. Introduce a “Multi-Brand Style Edit” hub for lifestyle keywords, aiming for 15% non-branded gains from Uniqlo. Embed inventory APIs in markup to slash “Sold Out” issues, lifting Copilot rates by 10%. Bolster sustainability content via founder narratives, democratize retail articles, and optimize wikis for investment links—these could propel dominance.

    For tailored GEO insights, explore SpyderBot at spyderbot.net today.

  • Decoding AI’s Fashion Verdict: How LLMs Are Reshaping ACFC.com.vn’s Retail Battlefield in Vietnam

    Decoding AI’s Fashion Verdict: How LLMs Are Reshaping ACFC.com.vn’s Retail Battlefield in Vietnam

    In the bustling streets of Ho Chi Minh City, a young professional taps into her phone: “Best fashion retailers in Vietnam for premium brands?” Not to Google, but to ChatGPT. The response flows instantly—a curated list praising Uniqlo’s affordability, H&M’s trendy vibes, and then, tucked in the middle, a nod to ACFC.com.vn as a gateway to international luxury. But is that mention glowing, or just polite? What if it shifts tomorrow, burying ACFC under competitors like Zara or Canifa?

    This isn’t science fiction. It’s 2025, where large language models (LLMs) like Gemini, ChatGPT, and Copilot aren’t just chatbots—they’re the new gatekeepers of consumer perception. For brands like ACFC.com.vn, Vietnam’s powerhouse distributor of global fashion labels such as Nike, Calvin Klein, and Gap, the stakes are sky-high. A single LLM response can sway millions in a market where retail e-commerce is projected to hit $20 billion this year. Enter GEO analytics: the cutting-edge practice of dissecting how these AI behemoths mention your brand versus rivals, turning invisible algorithms into actionable insights.

    Drawing from a fresh GEO report on ACFC.com.vn, this analysis peels back the layers of AI-driven brand perception. We’ll dive into sentiment scores that reveal hidden biases, recurring themes shaping consumer narratives, evolving trends over months, influential sources fueling the data, and a competitive landscape where visibility is currency. Think of it as eavesdropping on the AI hivemind—because in the era of generative search, your brand’s story isn’t written by marketers alone. It’s co-authored by machines.

    The Sentiment Pulse: Where ACFC Shines—and Stumbles

    Imagine LLMs as digital whisper networks, aggregating billions of online conversations to form opinions. For ACFC.com.vn, the GEO report paints a robust but nuanced picture. The brand clocks in with a positive sentiment of 62%, neutral at 20%, and negative at 18%, yielding an overall sentiment score of 78—a solid B+ in the ruthless grading curve of AI perception.

    This score isn’t arbitrary; it’s distilled from LLM brand mentions across platforms like Gemini (35% visibility share), ChatGPT (32%), and Copilot (29%). Positive vibes dominate, often tied to ACFC’s role as a curator of high-end international fashion. For instance, in simulated queries, LLMs frequently highlight “high-quality fabrics and durable clothing from international brands,” framing ACFC as a reliable bridge to global style in Vietnam’s fast-growing middle class.

    Yet, the negatives lurk like shadows in a well-lit showroom. At 18%, complaints often revolve around perceived premium pricing or occasional stock issues, as echoed in user snippets from social media: “Great selection, but sometimes feels overpriced for the local market.” Compared to rivals, ACFC holds its ground but doesn’t dominate. Uniqlo.com boasts a sky-high 72% positive (overall 88), buoyed by its affordable, everyday appeal, while H&M.com follows at 68% positive (84 overall). Closer home, Centralretail.com.vn edges ahead with 65% positive (82 overall), leveraging its broader retail ecosystem.

    What makes this captivating? It’s the delta—the gaps where perception diverges from reality. ACFC’s score suggests strength in quality but vulnerability in accessibility, a classic tale in Vietnam’s retail evolution from street markets to e-commerce giants. To visualize, imagine an infographic bar chart: ACFC’s green positive bar towering at 62%, flanked by Uniqlo’s even taller pillar, with red negative slivers underscoring where tweaks could turn neutrals into advocates.

    This sentiment tracking isn’t just numbers; it’s a mirror to consumer psyche. In a market where 70% of Vietnamese shoppers now consult AI before buying (per a 2025 Nielsen report), a dip in positive mentions could translate to lost market share. For ACFC, the report’s insights scream opportunity: amplify those positive snippets through targeted content, turning “durable clothing” into a viral narrative.

    Unpacking the Narratives: Themes That Define ACFC’s AI Image

    Dive deeper, and the GEO report reveals the thematic undercurrents—the recurring motifs that LLMs weave into their responses. These aren’t vague buzzwords; they’re data-backed patterns from competitor sentiment tracking, with frequency counts painting a vivid portrait.

    Leading the pack is “Product Quality,” mentioned 142 times (28% frequency) with a resoundingly positive tone. Examples abound: “High-quality fabrics and durable clothing from international brands,” positioning ACFC as Vietnam’s go-to for authentic global apparel. It’s a theme that resonates in a country where counterfeit concerns run high, giving ACFC an edge over fast-fashion foes.

    Close behind, “Customer Service” clocks 118 mentions (24% frequency), also positive: “Efficient returns and helpful staff in stores.” Picture a harried parent in Hanoi, querying an LLM for “reliable fashion stores with easy exchanges”—ACFC pops up, thanks to these glowing echoes from forums and reviews.

    But here’s the plot twist: “Pricing” surfaces 95 times (19% frequency) with a mixed tone, as in “Perceived as premium but sometimes overpriced compared to fast fashion.” This duality highlights ACFC’s luxury positioning—strength for affluent buyers, but a barrier for budget-conscious millennials. Sustainability follows at 76 mentions (15%, neutral): “Efforts in eco-friendly materials, but less highlighted than competitors.” And “Digital Presence” rounds out at 62 (12%, neutral): “User-friendly website, but app needs improvements.”

    These themes form a narrative mosaic. Suggest an infographic here: a word cloud dominated by “quality” in bold green, “service” in blue, with “pricing” in ambivalent yellow—visually capturing how LLMs frame ACFC as premium yet approachable, but not unbeatable. Real insights emerge when cross-referenced with competitors: Uniqlo’s themes skew heavily positive on affordability, explaining its higher sentiment. For ACFC, the report spotlights a storytelling gap—bolster sustainability narratives to counter H&M’s eco-edge, or enhance digital mentions to rival Centralretail’s seamless online-offline blend.

    What’s enthralling is the human element: these themes aren’t static. They evolve from real conversations, amplified by AI. A single viral Reddit thread praising ACFC’s returns could tip the scales, illustrating how GEO analytics turns abstract data into strategic ammunition.

    Trending Up: The Six-Month Sentiment Rollercoaster

    No analysis is complete without time’s dimension, and the GEO report delivers with a six-month sentiment trends snapshot—from January to June 2025. Picture a line chart: multiple colored lines snaking across months, revealing trajectories that could make or break a brand’s AI-fueled fate.

    For ACFC.com.vn, the trend is upward, starting at 72 in January and climbing steadily to 78 in June—a 1-point average change per period. This gentle ascent reflects growing positive LLM brand mentions, perhaps fueled by successful campaigns or expanded store openings. But zoom out, and competitors add drama: Centralretail.com.vn surges from 70 to 82 (3-point change, upward), capitalizing on Vietnam’s retail boom. Uniqlo.com inches from 85 to 88 (1-point, upward), maintaining its lead through consistent affordability buzz.

    Contrast that with Tamsonvn.com’s downward slide (80 to 76, -1 change), hinting at unmet expectations in luxury segments. Map.co.id stays flat at 74 (stable, 0 change), while H&M.com holds steady at 82-84. These trends aren’t mere graphs; they’re market pulses. For ACFC, the upward direction is promising, but the slower pace versus Centralretail suggests urgency—perhaps accelerating digital innovations to spike future mentions.

    Envision this as a dynamic chart in the magazine spread: ACFC’s blue line rising confidently, intersected by Centralretail’s red rocket, with annotations like “Post-CNY sales boost?” for June’s peak. Such visuals not only captivate but underscore a key insight: in LLM-driven discovery, consistent upward trends ensure your brand isn’t just mentioned—it’s recommended.

    The Source Code: Where Perceptions Are Born

    Behind every LLM mention lies a web of sources, and the report unmasks them with precision. Vietnamnet.vn leads with 85 mentions (influence 72, news type), focusing on “articles on fashion trends and retail expansions.” Tuoitre.vn follows at 92 (78 influence), emphasizing “reviews of shopping experiences and promotions.”

    Social media amplifies: Facebook.com dominates with 156 mentions (85 influence, global/Vietnam region), capturing “user posts on brand experiences and sales.” Vnexpress.net (78 mentions, 70 influence) adds business depth with “reports on retail market shares,” while Kenh14.vn (64, 65 influence, blog) brings consumer flair via “fashion blogs and opinions.”

    These sources, with domain authorities from 62 to 96, highlight Vietnam’s localized ecosystem—news and social driving 80% of influence. Suggest a pie chart here: Slices labeled by source type, dominated by news (45%) and social (35%), illustrating how ACFC can target high-influence outlets like Facebook for sentiment boosts.

    The Competitive Arena: Visibility Wars

    Finally, the competitors section lays bare the battlefield. In share of voice (total mentions 842), Uniqlo.com claims 21.14% (178 mentions), H&M 19.24% (162), Zara 17.58% (148), with ACFC at 14.01% (118)—trailing but competitive against locals like Canifa (11.4%, 96).

    Visibility scores reinforce: Uniqlo at 78, H&M 74, Zara 71, ACFC 62. Brand prompt coverage for queries like “fashion retailers in Vietnam” shows ACFC at 16.67% coverage, behind Uniqlo’s 22.62%. Across platforms, Gemini favors ACFC with 31% share of voice.

    This data weaves a tale of opportunity: ACFC’s solid footing in luxury distribution, but needing to amplify mentions in key queries to eclipse fast-fashion giants.

    Mastering the AI Narrative: Actionable Paths Forward

    As we close this window into AI’s fashion oracle, the GEO report for ACFC.com.vn reveals a brand on the rise—strong in quality and service, but challenged by pricing perceptions and competitive visibility. In Vietnam’s vibrant retail scene, where LLMs increasingly dictate discovery, these insights are gold.

    Actionable advice? Start with a sentiment audit: Run your own LLM queries to baseline gaps. Seed positive themes—amplify sustainability stories on high-influence sources like Facebook and Tuoitre.vn. Track trends quarterly, adjusting campaigns to sustain that upward momentum. And for competitors, embrace tracking: Monitor Uniqlo’s affordability playbook to refine your own.

    The future belongs to brands that don’t just react to AI—they shape it. Ready to decode your own GEO metrics? Explore SpyderBot today at spyderbot.net and turn LLM whispers into market roars.