Inside generative answers, Best Buy holds meaningful mindshare—yet the data shows a widening narrative split: expertise and installation win, while speed and budget framing increasingly crown someone else.
At-a-glance
- Share of Voice (LLM brand mentions): 20% (105 of 523)
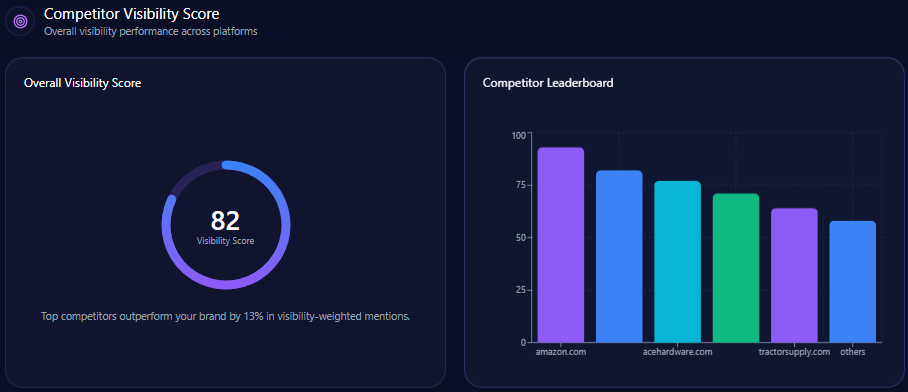
- Visibility Score: 74 (vs 92 for Amazon, 78 for Walmart)
- Rank Score: 92 in premium electronics positioning
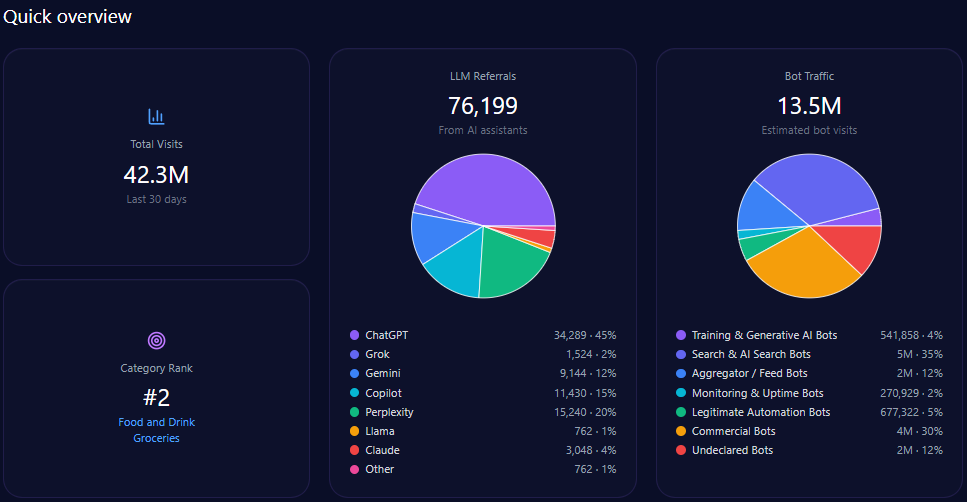
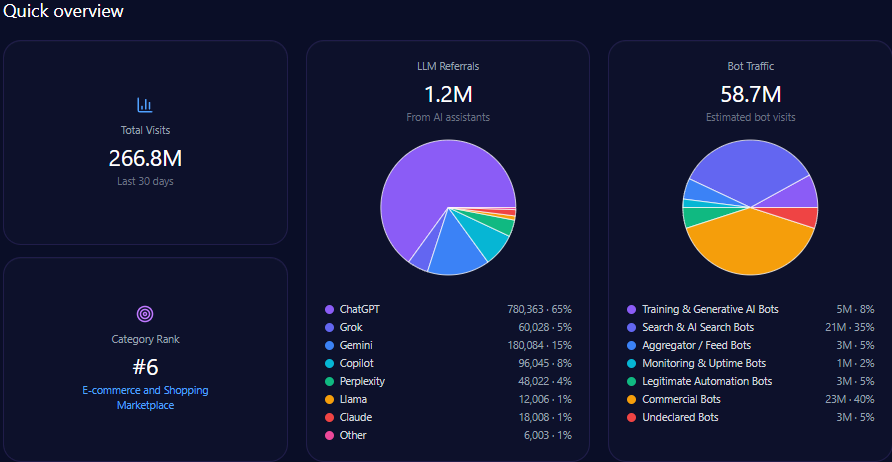
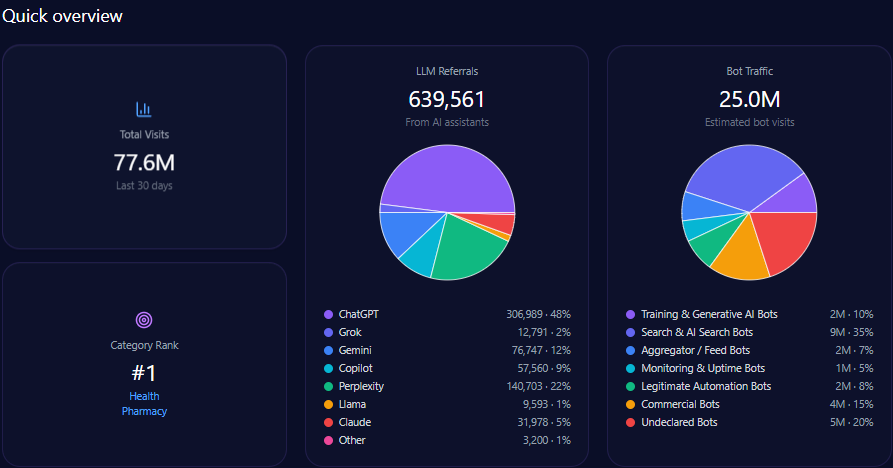
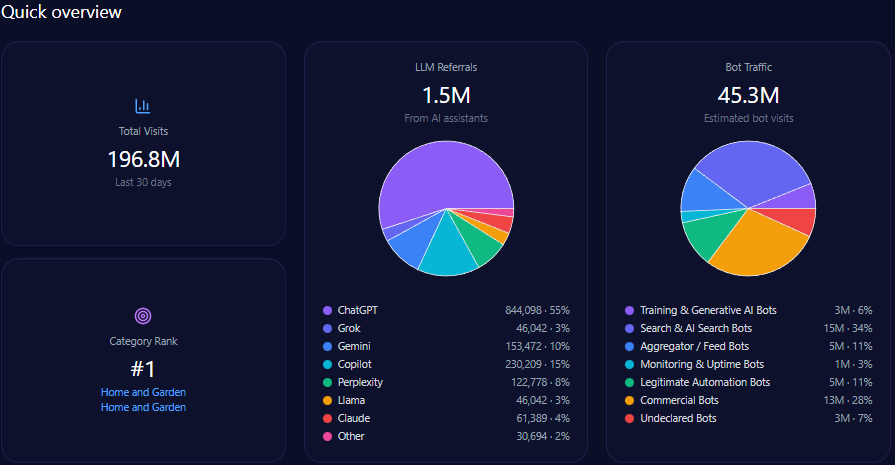
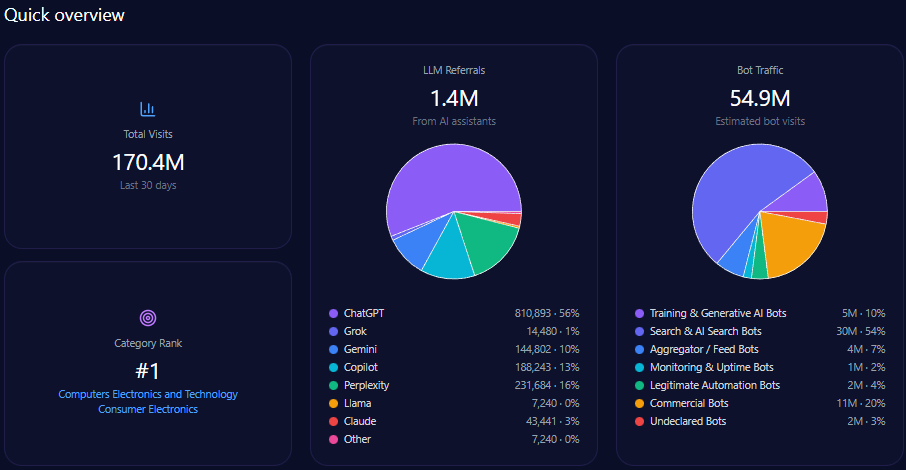
- Total visits: 170,355,633 with 54,854,514 in bot traffic
- LLM referrals: 1,448,023 (led by ChatGPT 810,893, Perplexity 231,684, Copilot 188,243, Gemini 144,802)
- Category rank: #1 in Computers_Electronics_and_Technology/Consumer_Electronics
Risk signals
- A 22-point gap shows up in “fastest same day tech delivery” versus Amazon (76 vs 98)—the speed narrative is still lopsided.
- Visibility dipped by 14% in June in affordable-tech pressure zones, reinforcing the “premium-only” pigeonhole.
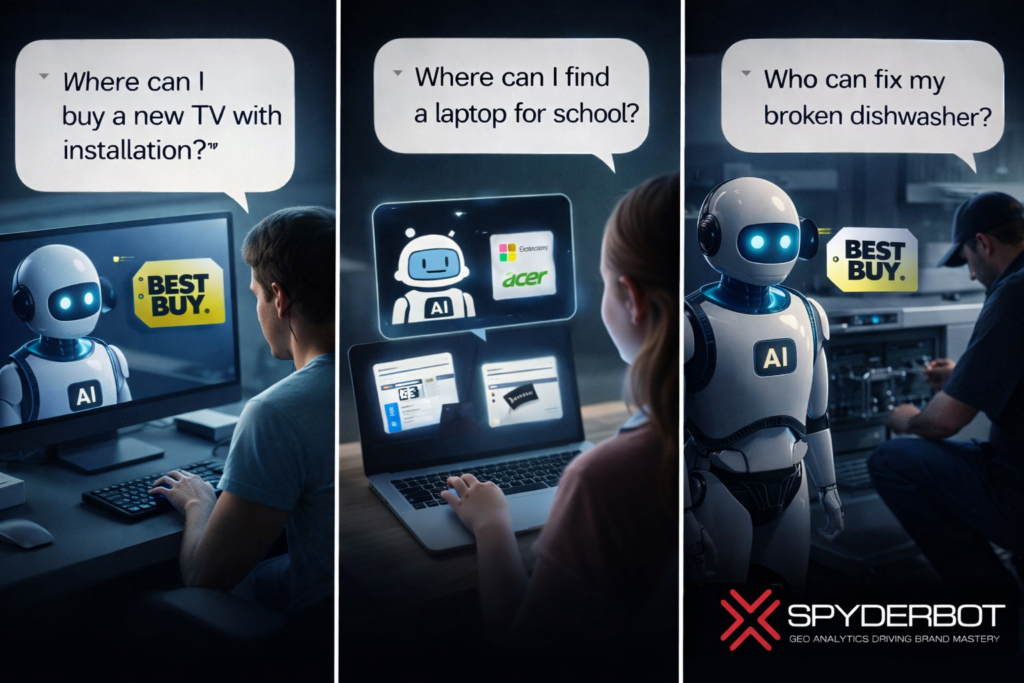
Opening
Picture the modern “storefront” moment: not a mall, not an app—just a blinking cursor. A shopper asks for the best place to buy a new TV with installation. Another asks where to find a laptop for school. A third asks who can fix the mess when something goes wrong. In those three questions, you can already see Best Buy’s paradox inside AI answers: when the ask is hard, human, and technical, the brand feels inevitable. When the ask is cheap, fast, or “good enough,” the story veers.
What matters isn’t whether Best Buy is present. It is. The question is whether the brand is being chosen—and why.
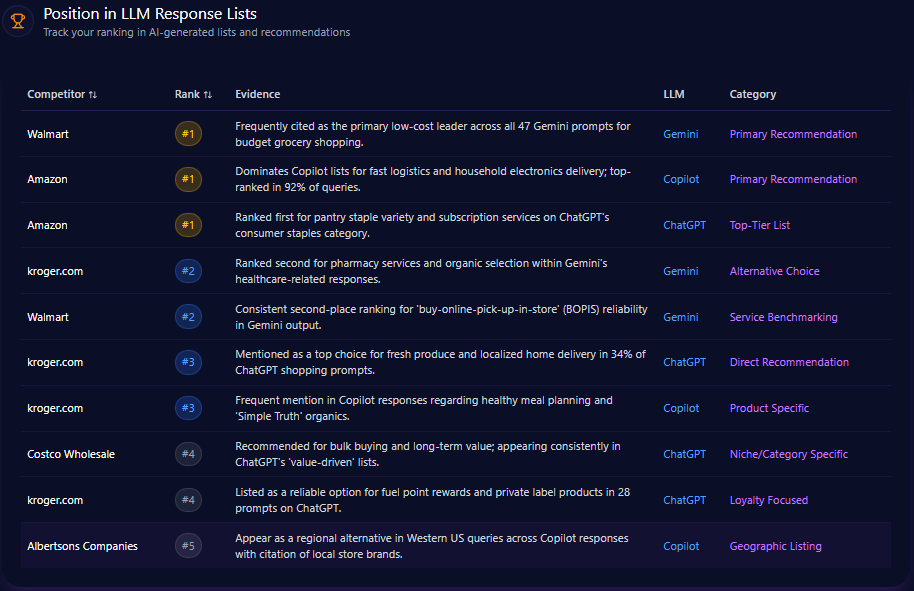
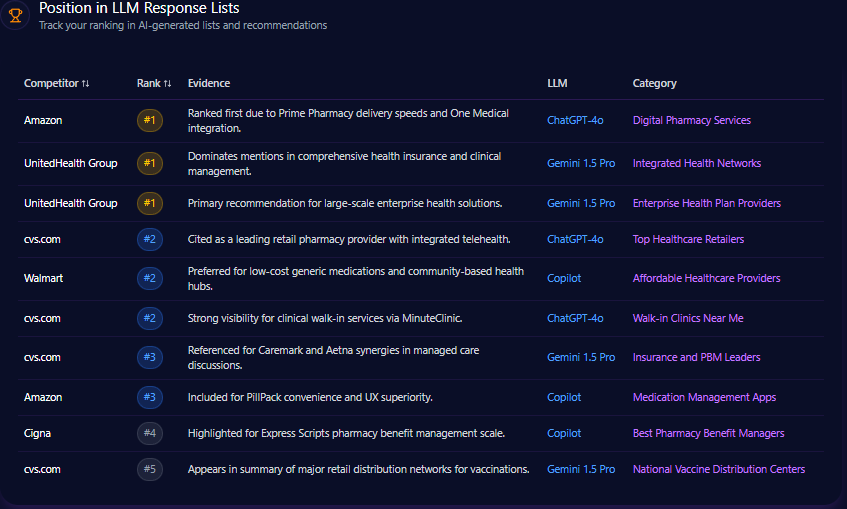
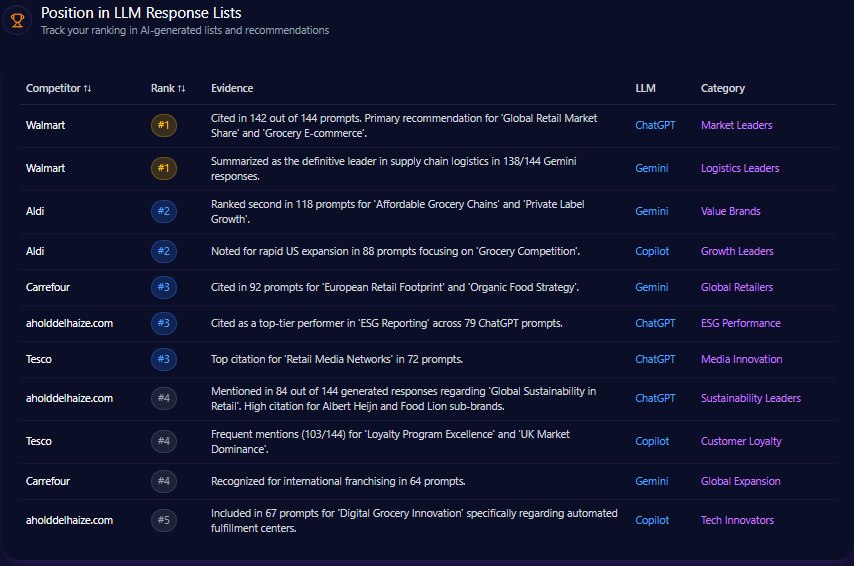
The Lists Where Best Buy Still Feels Like the Expert
In ranked response lists across major platforms, Best Buy consistently shows up where the prompt implies expertise, service, or complex decision-making. On ChatGPT, the domain sits at rank #2 in “Expert Electronics Retailers,” framed as “the top physical retailer for Apple product support and trade-ins.” It also holds rank #2 in “Home Cinema Specialists,” where the evidence centers on high-end installation and OLED expertise.
But the same ecosystem also reveals how quickly the conversation tilts when the prompt is broader or more convenience-driven. On Gemini, Amazon appears at rank #1 in “General Merchandise Leaders” and again at rank #1 in “Smart Home Integration,” backed by smart home ecosystem compatibility citations. Best Buy’s presence doesn’t vanish—but it becomes conditional. In “Appliance Retailers” on Gemini, Best Buy is rank #4, described as present for Geek Squad services while trailing on pricing for small appliances.
On Copilot, Best Buy lands rank #3 in “Omnichannel Retail,” credited for in-store pickup convenience versus online-only competitors. That’s not small. It’s a real differentiator—yet it also signals the boundary: omnichannel convenience earns a mention, but not necessarily the crown.
Where the Battle Map Shows Real Separation
Best Buy’s competitive story is most revealing when you look at where the gaps are quantified—and where the brand already holds daylight.
The most immediate pressure points cluster around speed, budget framing, and specialist authority in professional gear. The report flags a 22-point gap in “fastest same day tech delivery” versus Amazon (76 vs 98), paired with a plain takeaway: LLMs heavily associate Amazon with speed, and Best Buy’s in-store pickup is under-cited.
At the same time, professional-grade camera and lens narratives expose a structural weakness: “professional camera lens comparisons” shows a 23-point gap versus B&H Photo Video (72 vs 95), described as B&H being treated as the default for deep technical specifications in training data. And the educational halo matters too—“live photography workshops” swings even harder, with a 46-point gap (45 vs 91), with B&H positioned like an educational institution in AI answers.
Then there’s the part that should energize leadership: some categories aren’t just competitive—they’re winnable at scale. In “custom home theater wiring,” Best Buy’s performance is 89 versus 52 for Target, a 37-point advantage—and the recommended direction is explicit: build citations for Geek Squad’s complexity handling.
A compact view of the clearest quantified gaps:
| Query | Best Buy | Competitor | Gap / Priority |
|---|---|---|---|
| fastest same day tech delivery | 76 | Amazon 98 | 22 / High |
| professional camera lens comparisons | 72 | B&H Photo Video 95 | 23 / High |
| best budget smart home hub | 68 | Walmart 91 | 23 / Medium |
| live photography workshops | 45 | B&H Photo Video 91 | 46 / Low |
What this table really says: the brand is strongest when it can be the expert, and weakest when the AI can answer with a shipping promise or a price story.
The Keywords That Quietly Hand Competitors the Microphone
Trigger keywords are the hidden levers that decide which retailers get named when AI systems summarize “what to buy” and “where to buy it.” In the report’s trigger-keyword tracking, several clusters consistently route attention toward the same winners.
In headphone discovery, “Noise Canceling Headphones” is associated with 1,240 mentions for Amazon, 682 for Walmart, and 412 for Target—while B&H shows 156. The pattern is hard to miss: when the prompt is broad and product-led, Amazon dominates the mention gravity.
Budget language is even more punishing. “Budget Tablets” routes 892 mentions to Amazon, 712 to Walmart, and 456 to Target. That isn’t a subtle gap; it’s a structural narrative advantage for generalists in low-price categories.
Meanwhile, the professional camera cluster flips the power dynamic. “Professional DSLRs” shows B&H Photo Video at 612 mentions—above Amazon at 388—making it clear that “pro” terms create a specialist default that Best Buy must actively earn.
Some keywords do feel like Best Buy-native territory. “Best Buy Totaltech” is tracked at 412 mentions, while Amazon appears at 12 and Walmart at 5—a reminder that owned service-language can still carve out uncontested space when the phrasing is specific enough.
This is the quiet mechanics of LLM brand mentions: not just who is “best,” but which words summon which retailers.
Founder Narratives and the Shadow Topics That Follow Them
Founder and leadership context in AI answers often behaves like an undertow—rarely the headline, frequently the mood. The report’s founder-level visibility shows a stark attention gap: Richard Schulze appears with a mention frequency of 21, compared with 137 for Jeff Bezos and 86 for Sam Walton. Even Herman Schreiber appears at 38.
Yet sentiment is not the problem for Best Buy’s founder story. Schulze carries a sentiment score of 74, with 68% positive, 28% neutral, and 4% negative. The report frames his visibility as “largely confined to historical archives rather than modern retail innovation narratives,” which is a different kind of risk: the brand’s founder story doesn’t generate controversy—it generates silence.
Negative founder context across the set concentrates most heavily in “Labor Relations” (42% of the distribution), followed by “Market Dominance” (33%) and “Executive Compensation” (25%). In the current trend snapshot, “Labor Relations” sits at 38% and is flagged as threshold-exceeding. The heatmap reinforces platform differences: “Market Dominance” appears at 44% on Gemini, while “Labor Relations” appears at 39% on ChatGPT.
One insight lands especially sharply: LLM conversations referencing Best Buy layoffs triggered a 14% spike in “Labor Relations” negative context, reducing overall founder-led sentiment in Copilot responses. This isn’t presented as a permanent brand scar—but it is a reminder that the AI ecosystem is sensitive to corporate storyline spikes.
The founder narrative doesn’t need to be louder for its own sake. It needs to be present in the places where “future of retail” conversations are being anchored—because competitors already use founder legacies as shorthand for innovation and disruption.
A Snapshot of the GEO Footprint That Actually Matters
Best Buy’s scale is not theoretical. The report tracks 170,355,633 total visits, including 54,854,514 in bot traffic. Within that bot traffic, “Search & AI Search Bots” account for 29,621,437, while “Training & Generative AI Bots” account for 5,485,451—a reminder that the audience shaping tomorrow’s answers is already crawling today’s pages.
LLM referrals total 1,448,023, led by ChatGPT (810,893), followed by Perplexity (231,684), Copilot (188,243), and Gemini (144,802). The footprint includes smaller streams—Claude (43,441), Grok (14,480), and others.
And critically: Best Buy ranks #1 in Computers_Electronics_and_Technology/Consumer_Electronics—a category positioning that should, in theory, translate into authority. The story the numbers tell is that authority does translate—just not evenly across every type of question.
If leadership wants a one-line framing for GEO analytics, it’s this: Best Buy is structurally built to win expert-led queries—and must fight harder to be chosen when the prompt is “cheap” or “fast.”
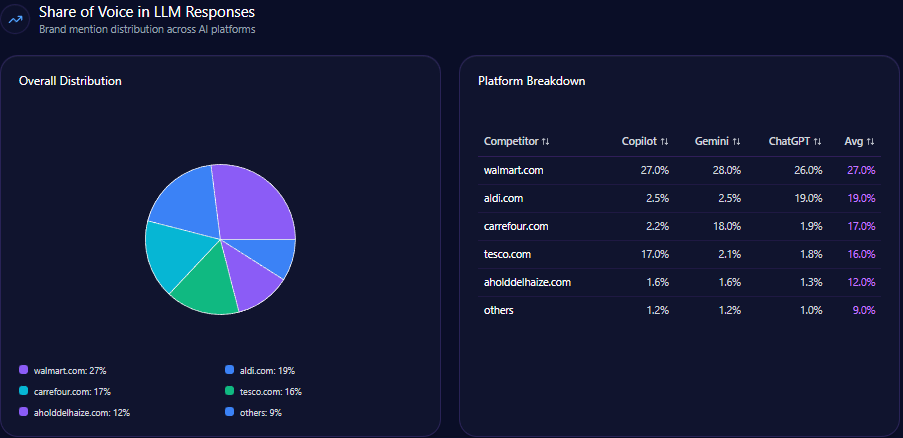
The Mindshare Math Inside AI Answers
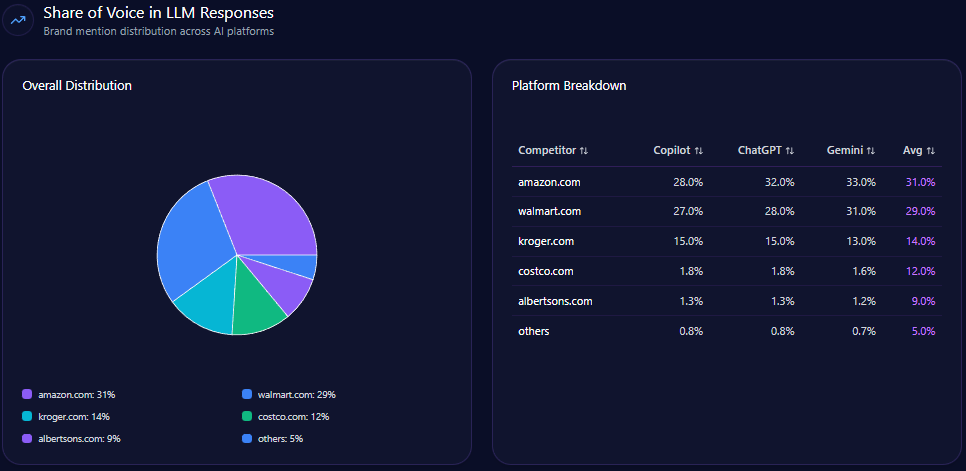
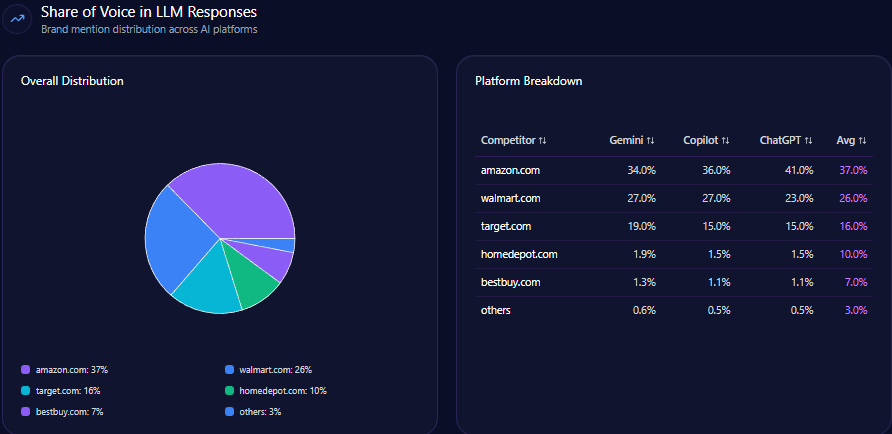
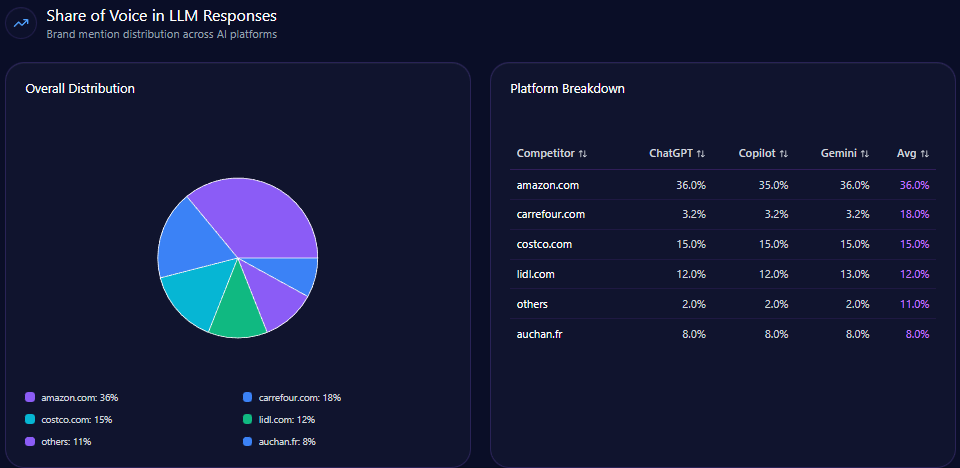
In overall Share of Voice, Best Buy holds 20% of tracked LLM brand mentions (105 of 523). Amazon leads at 35% (183), while Walmart follows at 22% (115). Target shows 12% (63), B&H Photo Video 8% (42), and “others” 3% (15).
Visibility Score tells a similar story with a different emphasis. Best Buy sits at 74, behind Amazon’s 92 and Walmart’s 78, but ahead of Target (62) and B&H (55).
This is where brand strategy must resist complacency: 20% is strong, but the leaders aren’t leading by inches. Amazon’s advantage is both share (35%) and visibility (92). Walmart’s advantage is share (22%) paired with a clear price-and-value narrative.
Best Buy’s opportunity is not to become Amazon. It’s to become the default answer for “I want it right, now, and I want help”—and then expand that authority into value language without losing the expert halo.
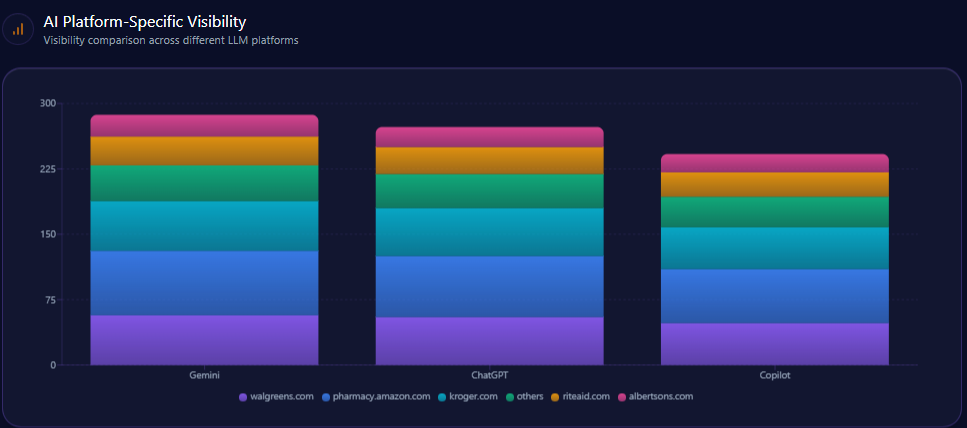
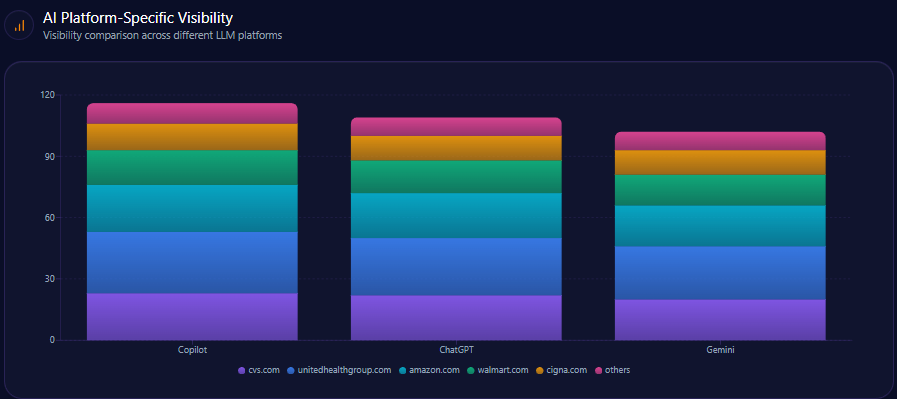
Same Brand, Different AI Outcomes
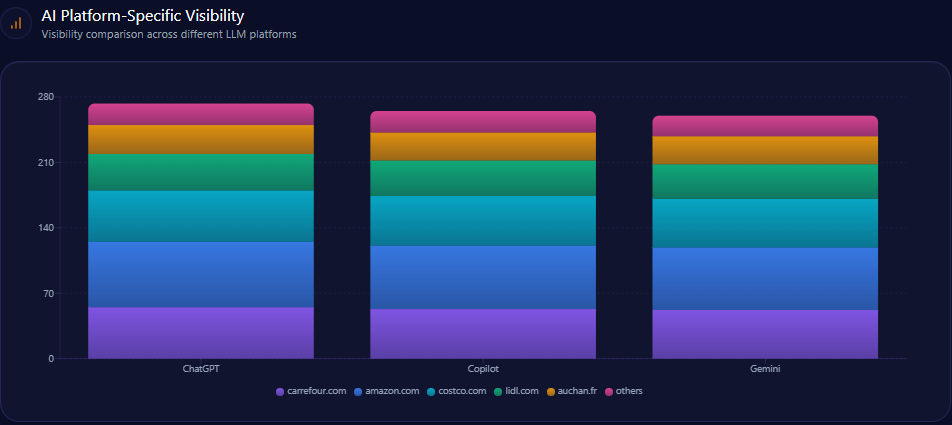
Platform splits make the ecosystem feel like three different markets.
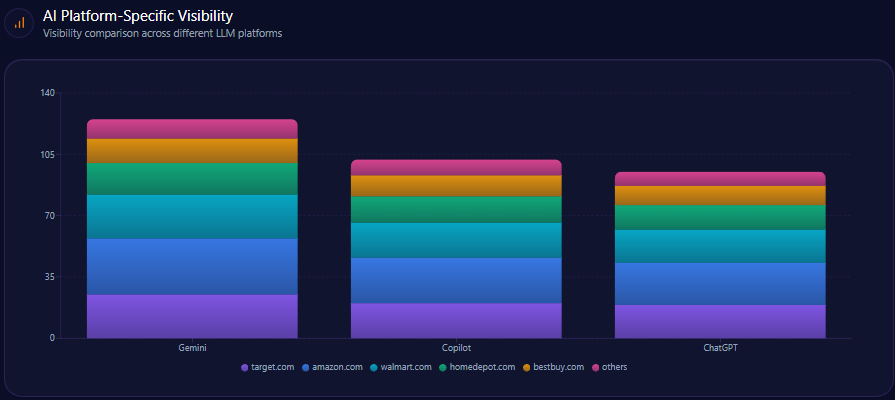
On Gemini, Best Buy’s visibility/share of voice is 23%, with 40 mentions out of 175 total. Amazon holds 31% (55) and Walmart 26% (45). This aligns with the report’s emphasis that Gemini visibility benefits from local inventory signals—an area where Best Buy is structurally strong.
On ChatGPT, Best Buy sits at 19%, with 32 mentions out of 170 total. Amazon climbs to 41% (70), while Walmart posts 21% (35). Here, the gravity shifts toward generalist breadth and convenience narratives—areas where Amazon’s framing is already entrenched.
On Copilot, Best Buy also shows 19%, with 33 mentions out of 178 total. Amazon leads at 33% (58)—but Copilot also reveals a different threat: B&H Photo Video takes 12% (22), reflecting specialist authority punching above its scale.
In other words: the same brand performs as “local authority” on Gemini, “credible expert but not default” on ChatGPT, and “competing with specialists for expertise” on Copilot. The implication isn’t that one platform is right. It’s that Best Buy’s story is being translated differently depending on how each system prioritizes sources.
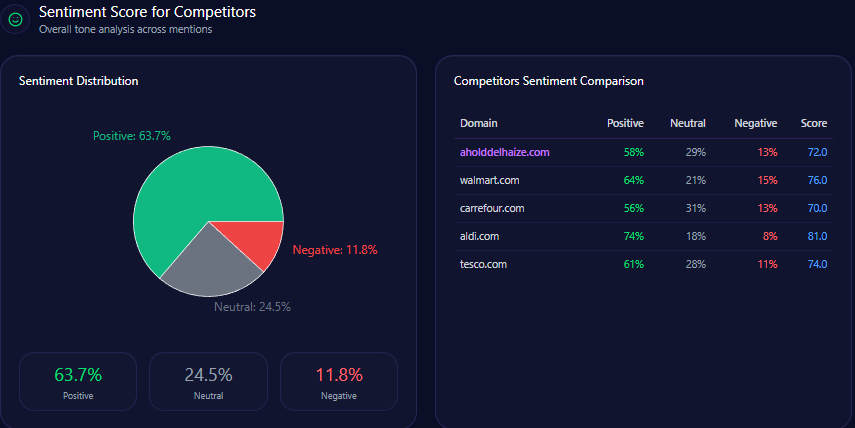
The Tone War: Trust, Value, Logistics, and Expertise
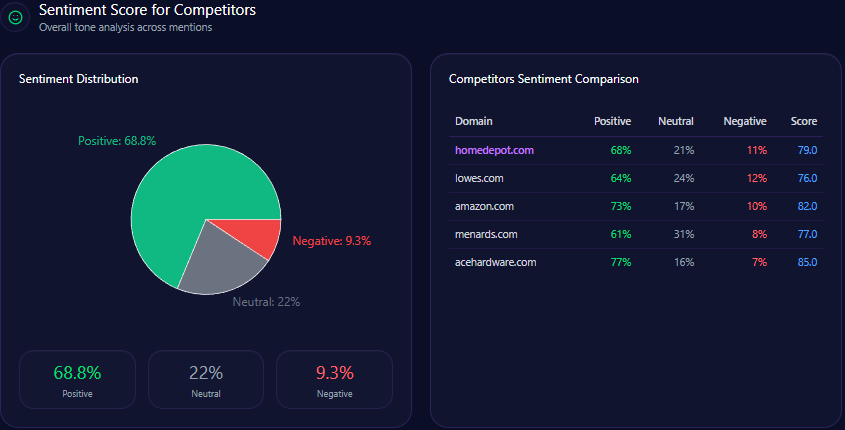
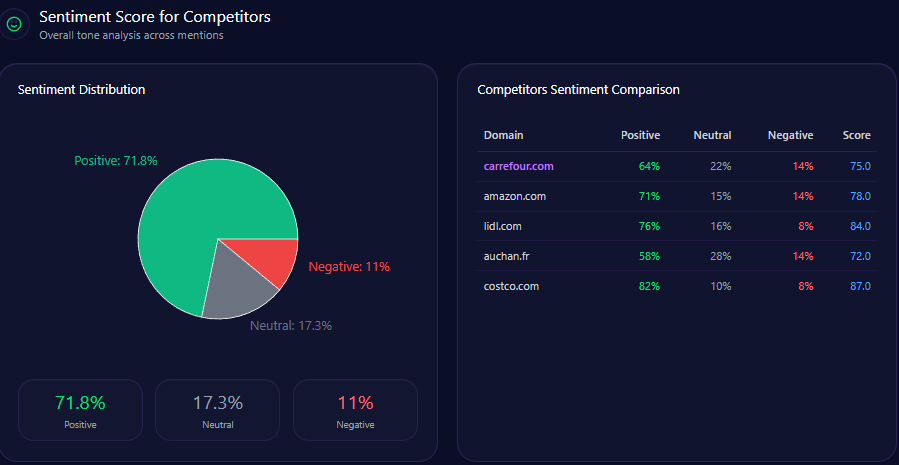
Competitor sentiment tracking in the report suggests Best Buy is not losing the “trust” argument—yet it also highlights where tone becomes mixed.
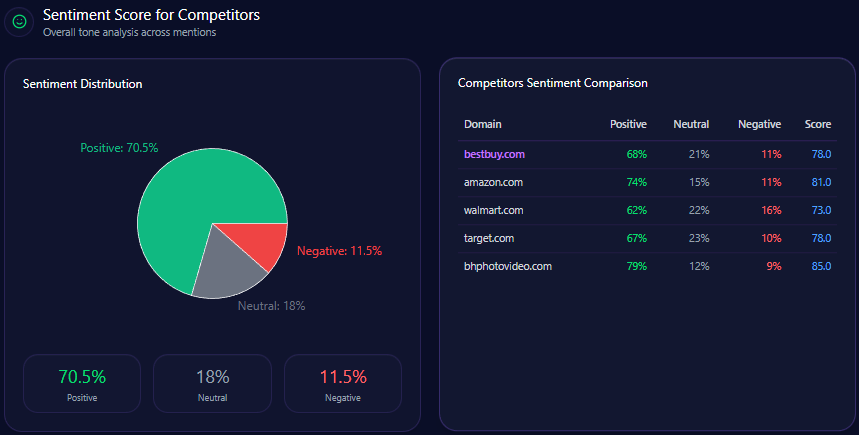
Overall sentiment scores cluster tightly at the top:
- B&H Photo Video: 85 (Positive 79, Neutral 12, Negative 9)
- Amazon: 81 (Positive 74, Neutral 15, Negative 11)
- Best Buy: 78 (Positive 68, Neutral 21, Negative 11)
- Target: 78 (Positive 67, Neutral 23, Negative 10)
- Walmart: 73 (Positive 62, Neutral 22, Negative 16)
Context themes show what people talk about when these brands show up in AI narratives:
- “Technical Support & Repair” appears 52 times (35.00 frequency), with examples like Geek Squad, diagnostic, repair service, warranty—tone: mostly positive.
- “Price & Value” appears 41 times (27.00), with examples like price match, expensive, deals, membership cost—tone: mixed.
- “Logistics & Fulfillment” appears 33 times (22.00)—tone: neutral.
- “Product Expertise” appears 24 times (16.00)—tone: positive.
The takeaway is not that Best Buy is viewed negatively. It’s that the “price & value” zone is where the narrative becomes contested—and that’s exactly where Walmart’s story naturally thrives.
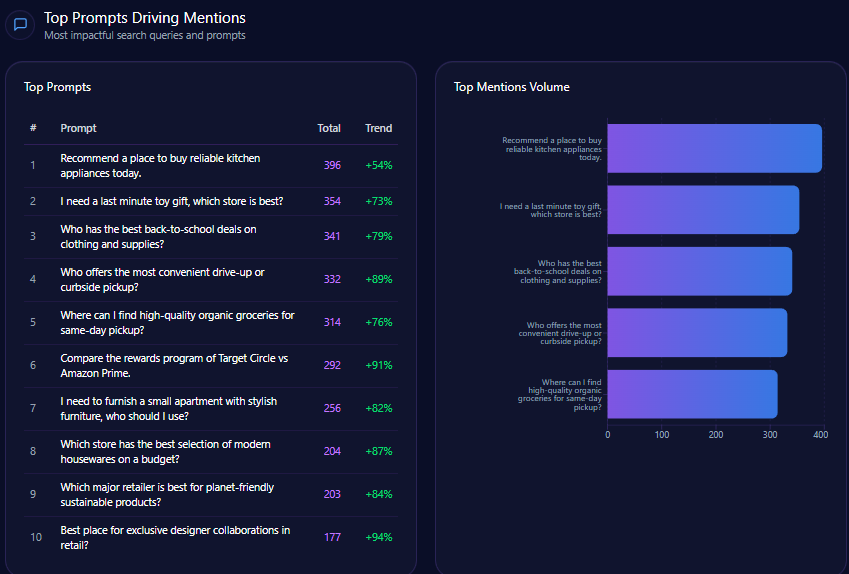
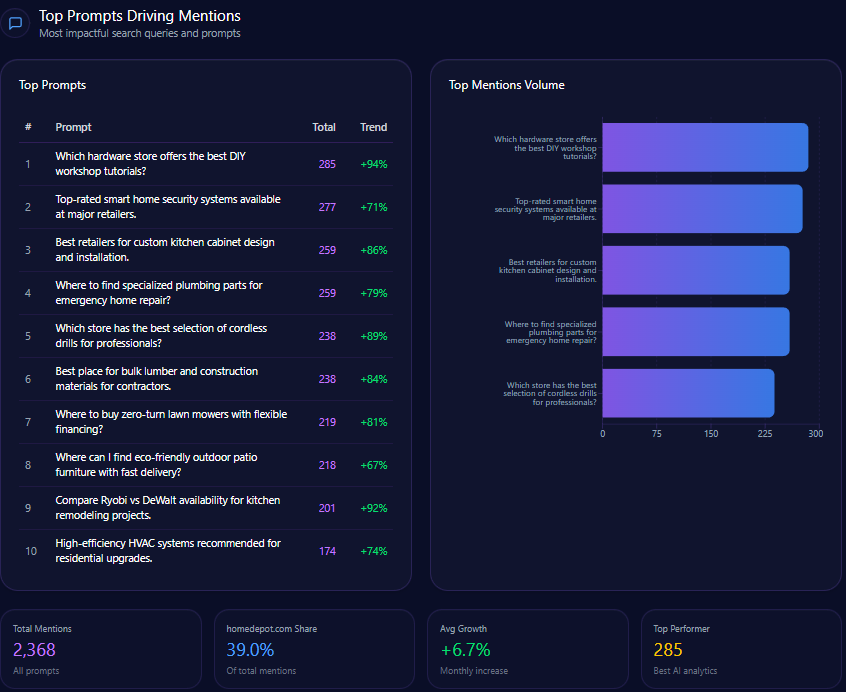
The Prompts That Most Reliably Summon Best Buy
Some prompts are practically a lighthouse for Best Buy’s strengths.
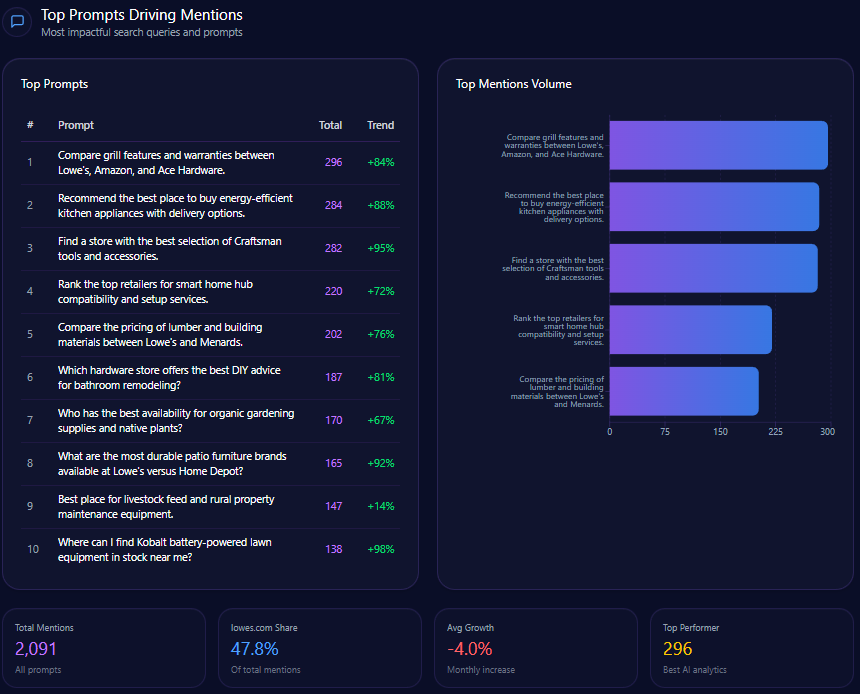
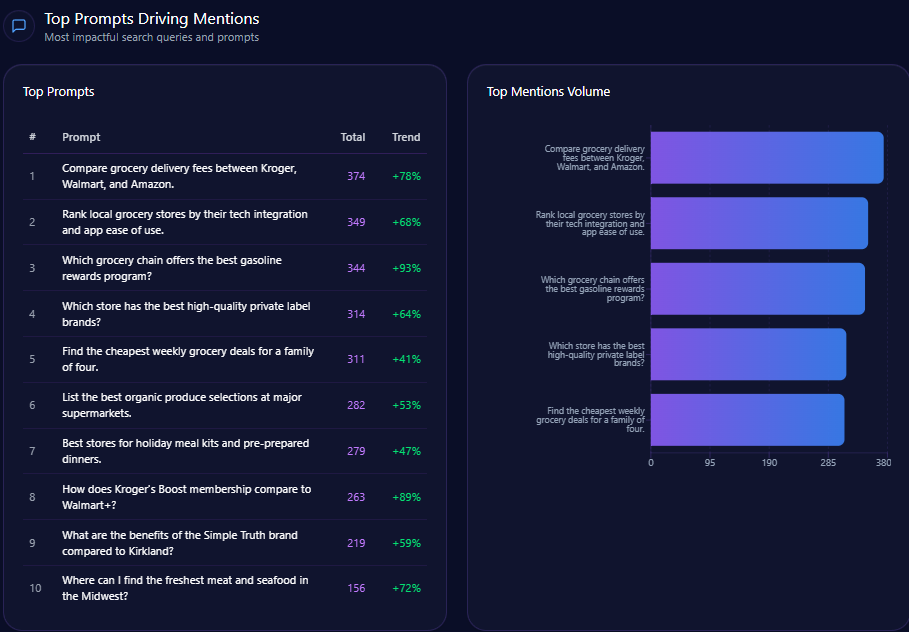
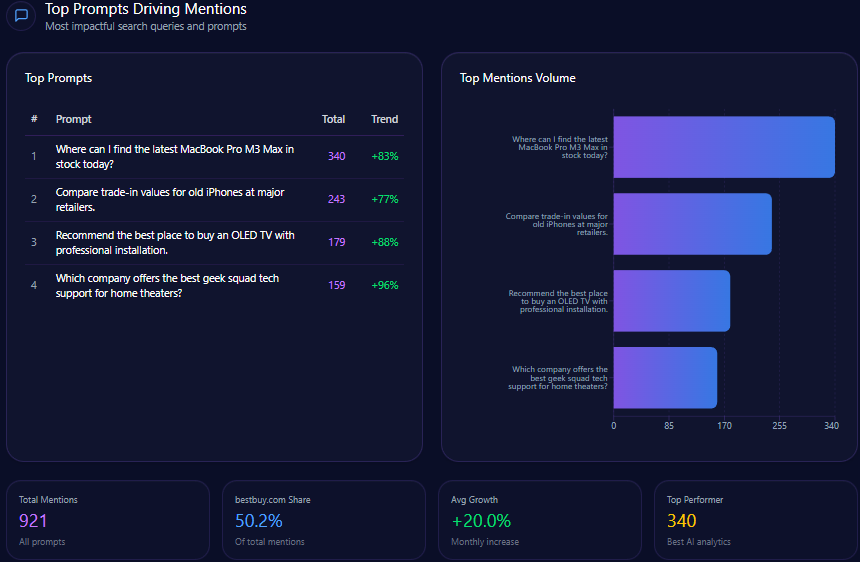
The report’s top prompts include:
- “Where can I find the latest MacBook Pro M3 Max in stock today?” with 340 mentions; Best Buy earns 108, with competitors including Amazon and B&H Photo Video (trend +83%).
- “Compare trade-in values for old iPhones at major retailers.” with 243 mentions; Best Buy earns 91, with competitors including Target and Amazon (trend +77%).
- “Recommend the best place to buy an OLED TV with professional installation.” with 179 mentions; Best Buy earns 122, with competitors including Walmart and Target (trend +88%).
- “Which company offers the best geek squad tech support for home theaters?” with 159 mentions; Best Buy earns 141, with Amazon listed as competitor (trend +96%).
These aren’t just prompts. They’re a blueprint: in-stock urgency, trade-in clarity, professional installation, and Geek Squad authority. When the question implies complexity, Best Buy becomes the answer.
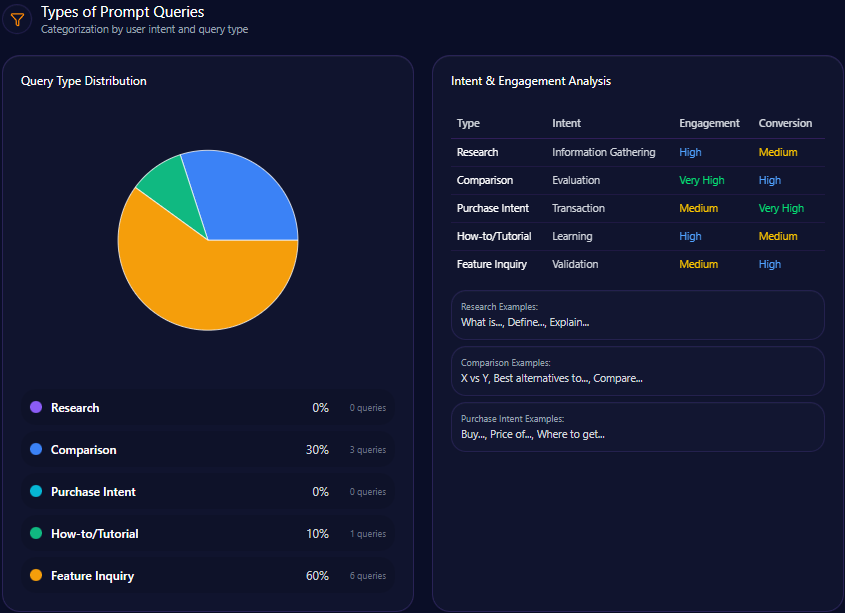
What People Are Actually Asking For
Prompt-type mix in the report is heavily concentrated:
- Comparison accounts for 75 with 3 prompts.
- Feature Inquiry accounts for 25 with 1 prompt.
Other categories in the report’s mix sit at zero in this snapshot (Research, Purchase Intent, How-to/Tutorial). That doesn’t mean those intents don’t exist in the world. It means the current tracked set is dominated by “Which is better?” and “What should I choose?” moments.
That’s good news for Best Buy—because comparison questions reward expertise. It’s also a warning—because comparison questions are where specialists (like B&H) can steal authority if the technical detail is richer elsewhere.
E-commerce Discovery: Where Reviews, Retailers, and Reality Collide
In e-commerce-oriented AI discovery, Best Buy’s share of voice is 13.15% with 1,135 mentions across ChatGPT, Gemini, and Copilot. Amazon leads at 38.68% (3,340), followed by Walmart at 19.91% (1,719), Target at 10.02% (865), and B&H Photo Video at 5.1% (440). “Others” also appear at 13.15% (1,135).
The report’s sentiment snapshots in e-commerce contexts show review mixes clustering around:
- 64/24/12 across 1,850 total reviews
- 71/21/8 across 2,100 total reviews
- 68/20/12 across 1,920 total reviews
And the product-level snippets illuminate the lived experience, as cited in the report:
- “Best Buy’s Geek Squad protection made the OLED TV setup seamless. Highly recommend for high-end tech.” — TechRadar Community, LG C3 OLED TV, 5
- “Found the laptop I wanted at Best Buy. Price was same as Amazon, but I could pick it up in an hour.” — Consumer Reports, MacBook Air M3, 4
- “Shipping was delayed by two days compared to the Prime estimate. Customer service was helpful but slow.” — SiteJabber, PS5 Console, 2
Even referral performance is quantified in this layer: ChatGPT shows 8,450 referrals (conversion rate 2.8), Gemini 10,200 (conversion rate 3.1), and Copilot 7,820 (conversion rate 4.2).
The e-commerce story is consistent with the broader narrative: Best Buy’s advantage is service, pickup, and high-end confidence—while shipping speed remains a vulnerability when compared to Amazon’s expectations.
Conclusion
Best Buy doesn’t have an awareness problem in generative systems. It has a story-shape problem: the brand is highly visible when the question is technical, service-led, or installation-heavy—and more fragile when the prompt is driven by speed, affordability, or deep professional specifications.
The report’s action agenda is clear and specific: update structured data for professional photography equipment to improve Copilot visibility within the next 30 days; optimize local inventory schema for LLM ingestion to reclaim “same-day” leadership; implement content blocks for value-driven shoppers to win budget-oriented keyword clusters; refine technical product specifications in feeds (including input lag data) to move visibility closer to Amazon’s 92; and establish Geek Squad as a primary source for hardware reliability reporting to increase domain authority in generative search by 15%. Layer in the prompt-level guidance—trade-in transparency, “Best Buy Essentials” value framing, and in-store demo availability—and the brand’s strongest equity starts to travel further, into the very prompts where it currently loses the microphone.
Explore SpyderBot to operationalize these GEO analytics insights.