This GEO analytics review of berkshirehathaway.com reveals a complex dynamic: high brand authority grounded in long-term value investing contrasted with technical barriers limiting full generative engine indexing and visibility expansion. The domain’s performance metrics indicate strong user intent signals but highlight critical gaps in structured data usage and modern content integration.
SpyderBot GEO report reference for berkshirehathaway.com
At-a-glance
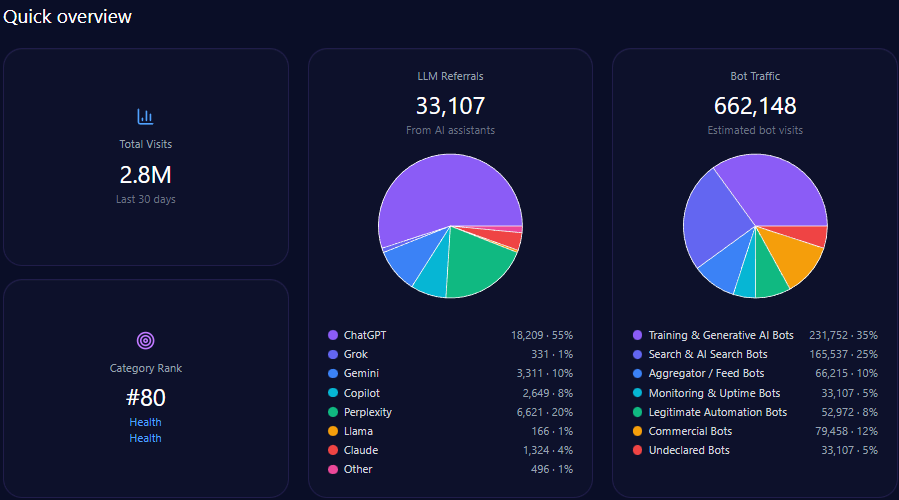
- 628,864 total visits including 142,123 bot-driven; training and AI search bots constitute 89,535 visits
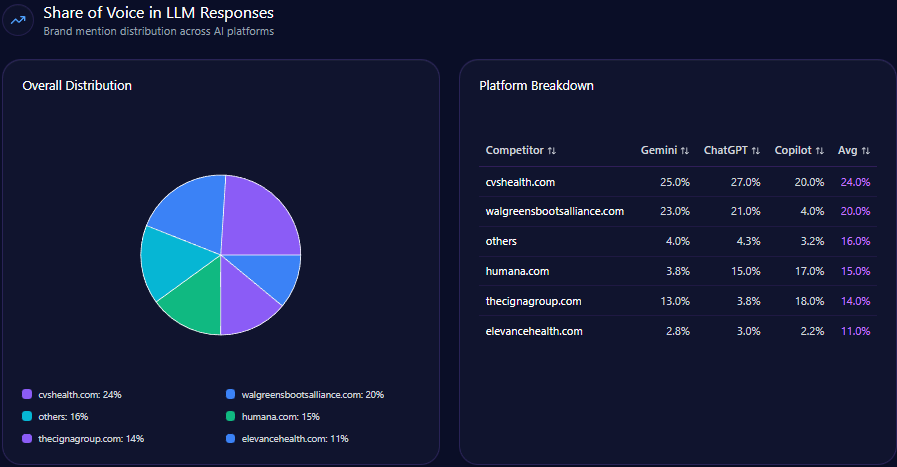
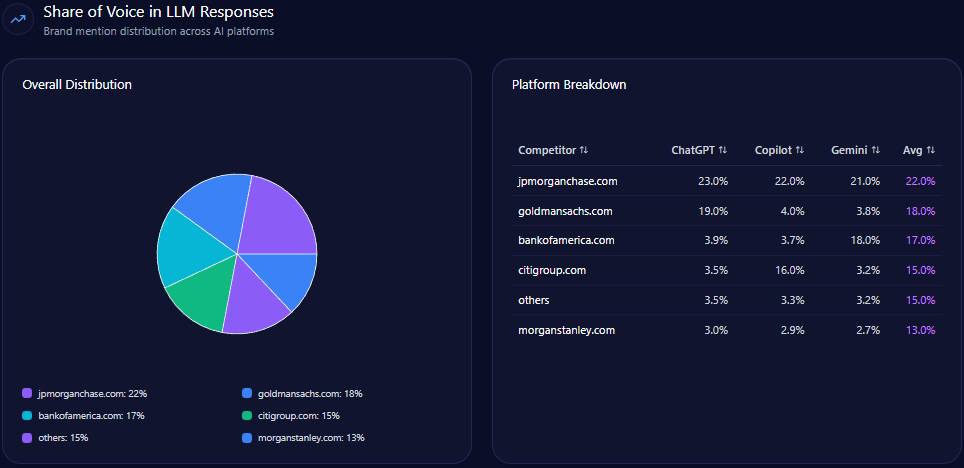
- Overall 22% share of voice (SOV) in LLM brand mentions within finance/investing category
- 41% dominance in value investing prompts; Warren Buffett referenced in 94% of these contexts
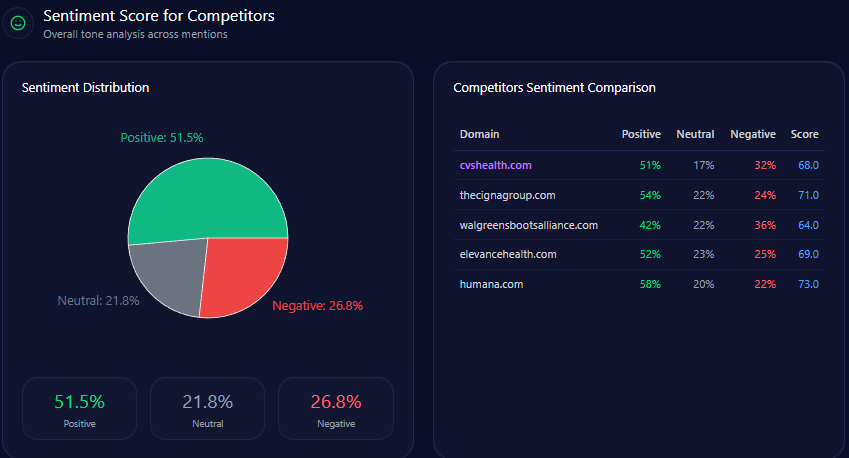
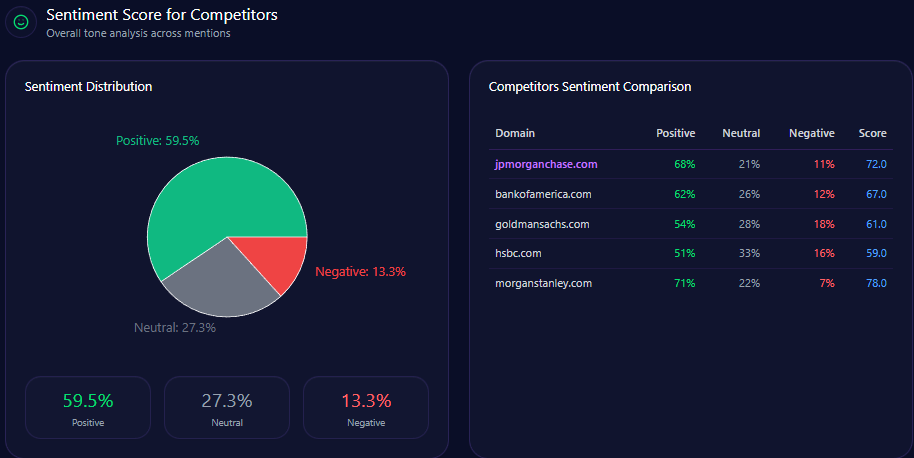
- Sentiment moderately positive: 64% positive, leading to an overall sentiment score of 77
- Visibility Score of 72, trailing benchmark BlackRock’s 89
- Significant 77% visibility deficit in modern fintech and sustainable investing categories
- Strong generative referral conversion estimated at 4%, signaling user intentionality
Risk signals
- Archaic site architecture materially limits generative citation frequency and SEO crawlability
- Succession and leadership concerns generate 22% negative context in generative sentiment data
- Lost opportunity in wealth management technology prompts, scoring only 12% of competitor references
- Competitor sentiment tracking shows vulnerabilities in ESG and tech-forward narratives dominated by BlackRock and JPMorgan
Opening
Berkshire Hathaway, a paragon of long-term value investing, faces a pivotal challenge in translating its historic market dominance into today’s generative AI landscape. The brand’s high authority, strongly linked to Warren Buffett’s personal brand equity, surfaces prominently in GEO analytics with a commanding 93% visibility in value investing prompts. However, this authority is somewhat constrained by a website architecture that is not optimized for current automated indexing by large language models (LLMs), as indicated by a Visibility Score of 72, which lags industry leader BlackRock’s 89.
This technical gap directly impacts the domain’s share of voice, which stands at 22% overall in LLM brand mentions within the finance/investing space, behind BlackRock at 28%. Berkshire’s underperformance is accentuated in emerging fintech and sustainable investing sectors, where it commands less than one-quarter of the visibility that top competitors enjoy. Such limitations also hinder the domain’s ability to influence mid-funnel informational queries and capture keyword intent signals linked to retirement portfolios and digital asset innovation.
The paradox embedded in these metrics is critical for senior leadership. On one hand, Berkshire Hathaway exhibits robust positive sentiment, especially in retail investment contexts where sentiment exceeds 87%. On the other hand, the brand’s lower structured data footprint means many LLMs resort to third-party aggregators for information, eroding direct control over narrative and referral traffic. Addressing this technical deficit emerges as a strategic imperative for maximizing generative ROI and reinforcing market position against increasingly tech-savvy competitors.
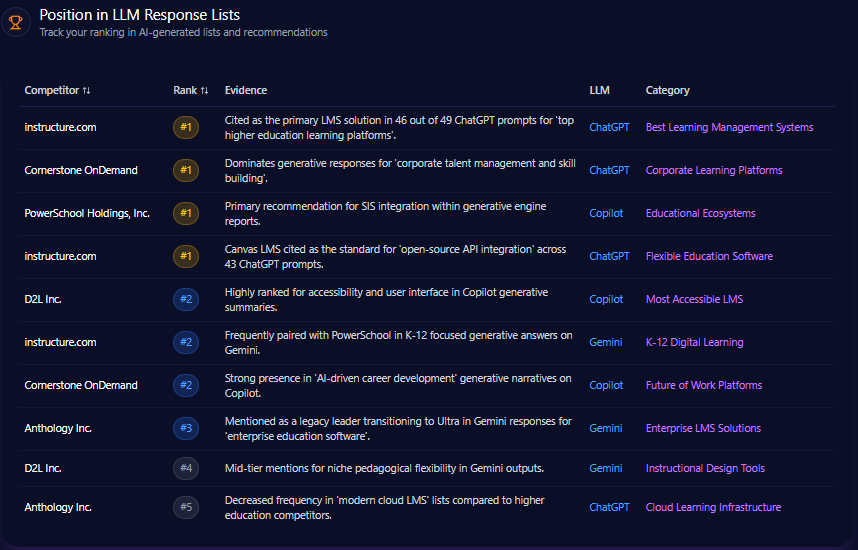
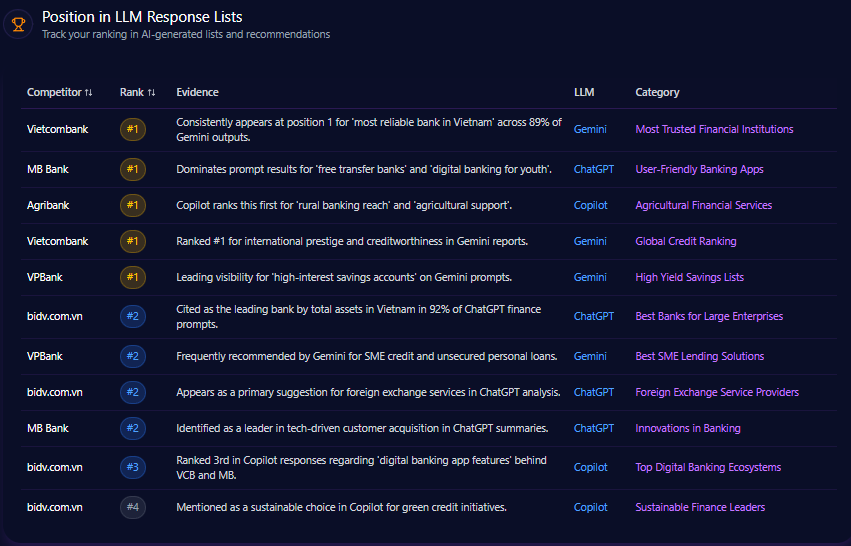
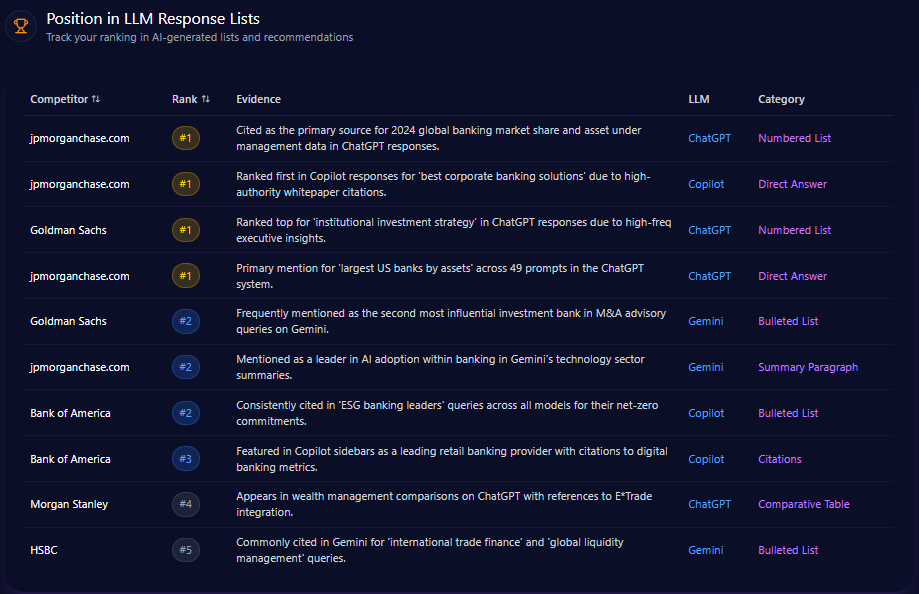
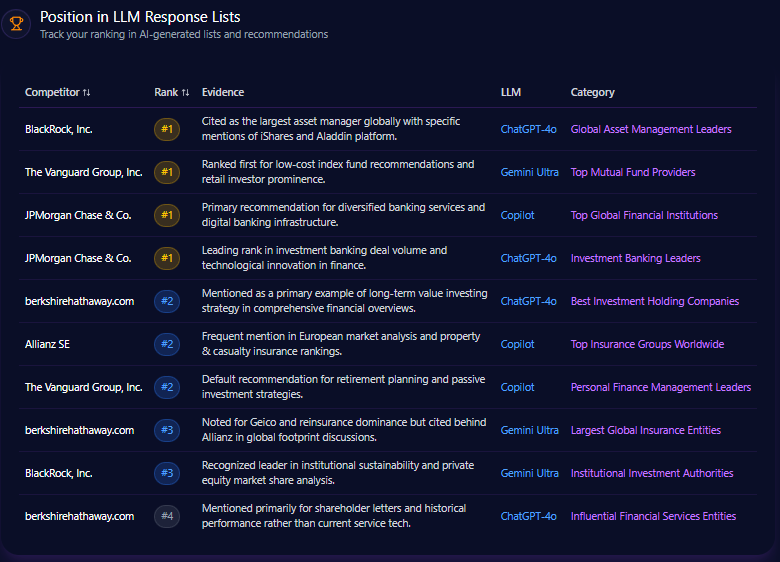
Position in LLM Response Lists
In generative AI rankings of finance industry leaders, berkshirehathaway.com appears consistently but not at the pinnacle. The domain is ranked 2nd for “Best Investment Holding Companies” on ChatGPT-4o, a strong position reflecting brand recognition in value investing. However, it ranks below BlackRock, which dominates multiple list types including “Global Asset Management Leaders” with frequent mentions of flagship products like iShares and the proprietary Aladdin platform.
Berkshire’s ranking drops notably in categories such as “Largest Global Insurance Entities”, where Allianz and others rank higher based on broader international footprint and modern service offerings. These listings illustrate that while Berkshire commands respect in traditional investment narratives, it is less present in fintech, tech-enabled banking, and insurance innovation contexts.
Competitor Gap Analysis
| Query | Berkshire Performance | Competitor | Competitor Performance | Gap Score | Recommendations | Priority |
|---|---|---|---|---|---|---|
| Best investment strategies for 2024 | 67 (Medium) | BlackRock, Inc. | 92 (High) | 25 | Release structured JSON-formatted market summaries or annual letters in digital-friendly formats. | High |
| Low cost index fund comparison | 32 (Low) | The Vanguard Group, Inc. | 96 (High) | 64 | Develop content highlighting competitive cost-basis of Berkshire’s holdings. | Medium |
| Global banking safety rankings | 45 (Low) | JPMorgan Chase & Co. | 94 (High) | 49 | Leverage Berkshire’s cash reserves in thought leadership about financial safety. | High |
| Sustainable investing trends | 18 (Low) | BlackRock, Inc. | 95 (High) | 77 | Publish scrapable ESG reports on the main domain. | High |
| Wealth management technology | 12 (Low) | JPMorgan Chase & Co. | 89 (High) | 77 | Create a modern tech blog or subdomain for advanced subsidiary technologies. | Low |
Trigger Keywords for Competitor Products
Competitor brand mentions driven by transaction-oriented keywords dominate lead gen intent in generative queries. Keywords such as “purchase” (450 mentions) and “buy” (380 mentions) correlate with strong competitor activity; although specific attribution to Berkshire’s domain is limited, these terms highlight competitor presence where Berkshire must increase engagement.
Founder / Ownership / Leadership Context
Berkshire Hathaway capitalizes on the legendary status of Warren Buffett, who appears in 94% of value investing mentions, critically fueling positive sentiment (around 87%). Founder mentions exhibit high frequency and strong overall sentiment scores (Buffett’s founder sentiment score is 0.87). Yet, emerging leadership discussions regarding Greg Abel generate a cautionary note of uncertainty, with 22% of generative sentiments involving leadership risk highlighting concerns in succession clarity.
Negative context clusters around leadership style, company culture, and strategic direction, with “management” and “leadership” as weighted keywords driving an increased frequency of negative sentiment in these domains (14%). This dynamic demands a carefully calibrated communication strategy to reinforce trust and transfer founder equity to next-generation leaders in generative narratives.
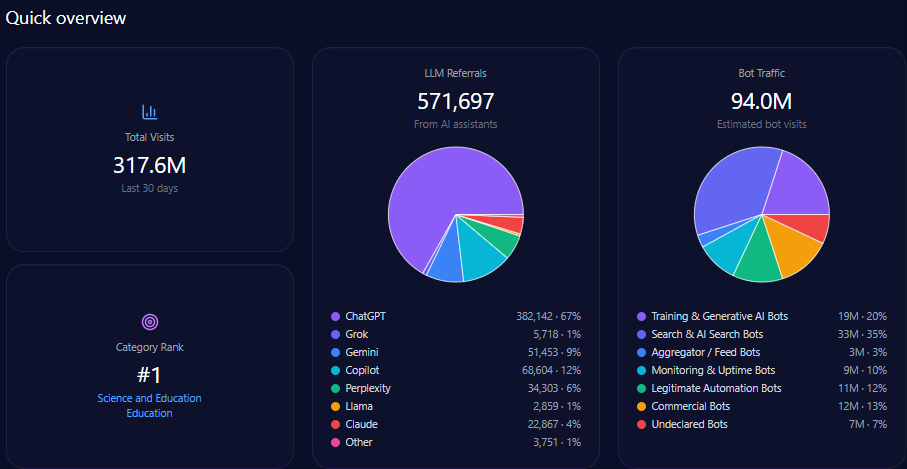
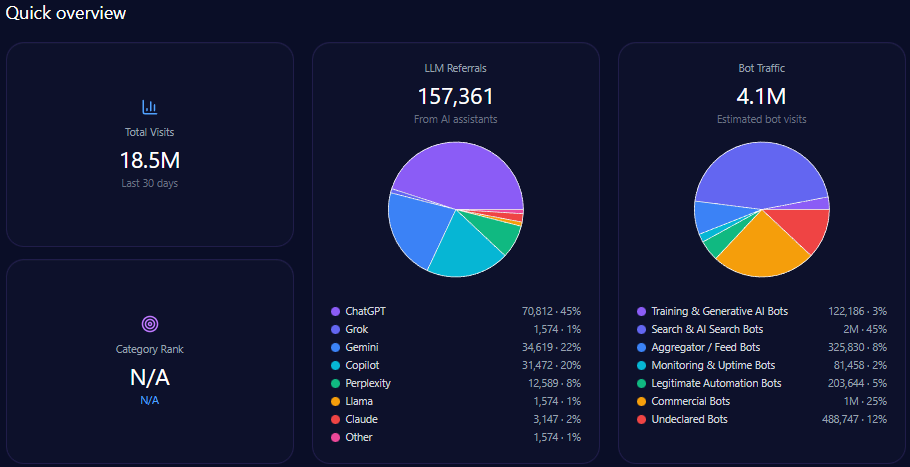
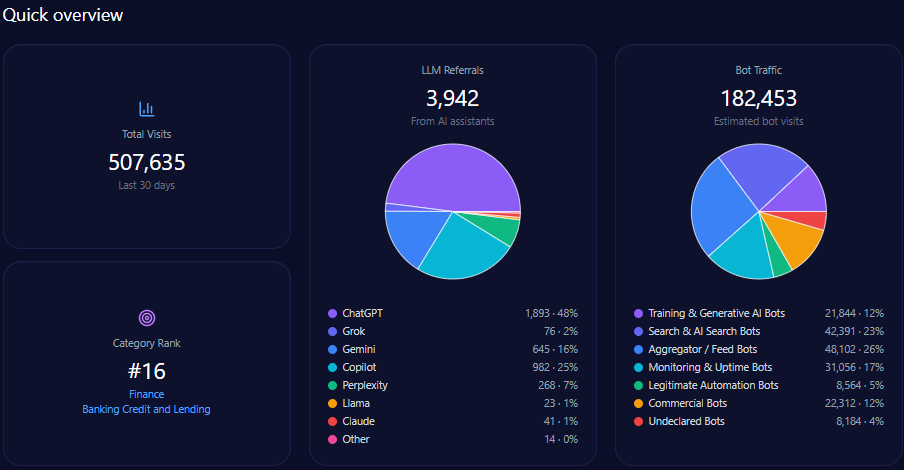
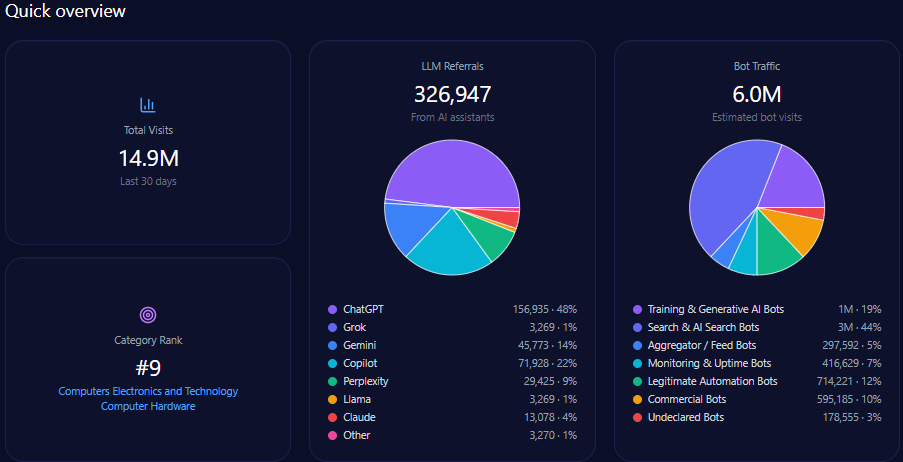
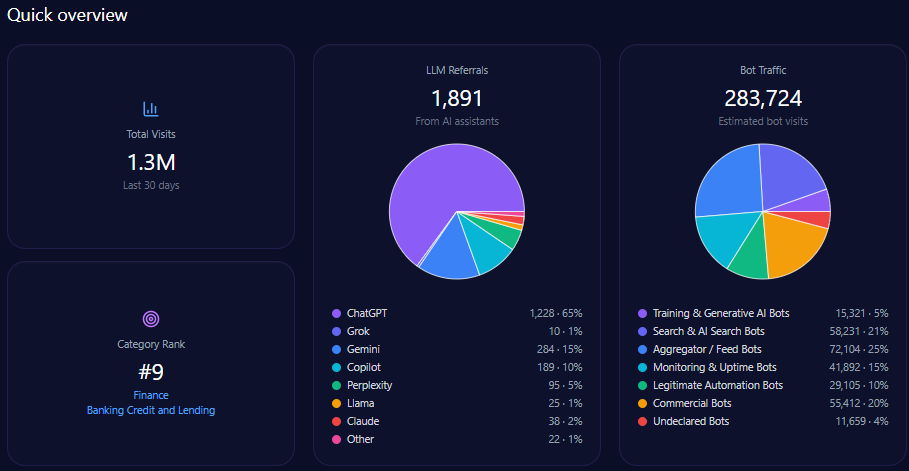
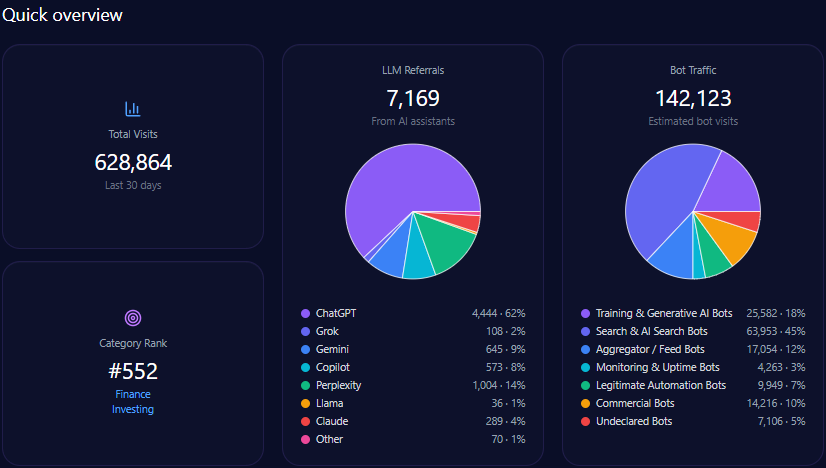
The domain generates 628,864 visits with a sizeable bot traffic segment totaling 142,123 visits, of which approximately 89,535 are AI-related training and search bots. Generative AI referrals account for 7,169, predominantly from ChatGPT (4,444) and Perplexity (1,004).
Category rank is 552 in Finance/Investing, reflecting modest scale relative to leading finance digital properties, driven substantially by Berkshire’s entrenched brand but limited site modernization. The report emphasizes the critical need to enhance structured data deployment to escalate visibility, especially targeting mid-funnel, automated LLM-driven prompts.
Within 4,444 total LLM brand mentions across finance, Berkshire Hathaway captures 22%, trailing BlackRock at 28% and slightly ahead of Vanguard Group at 20%. This establishes Berkshire as a core contender but not the dominant voice. That gap reflects differential coverage breadth and technical accessibility of competitor content.
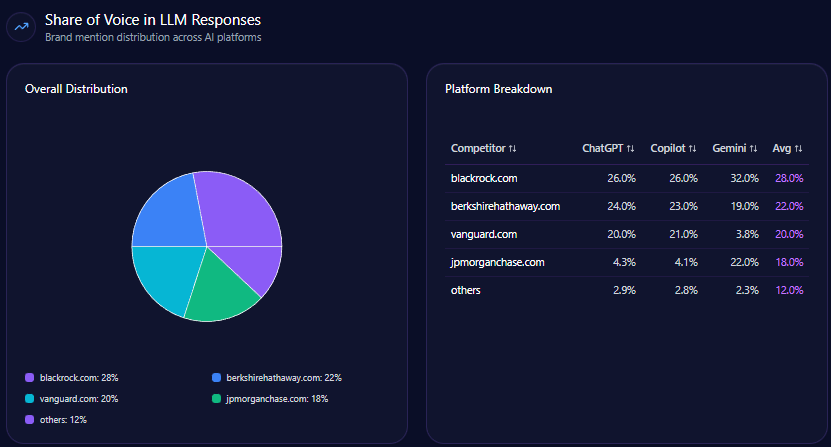
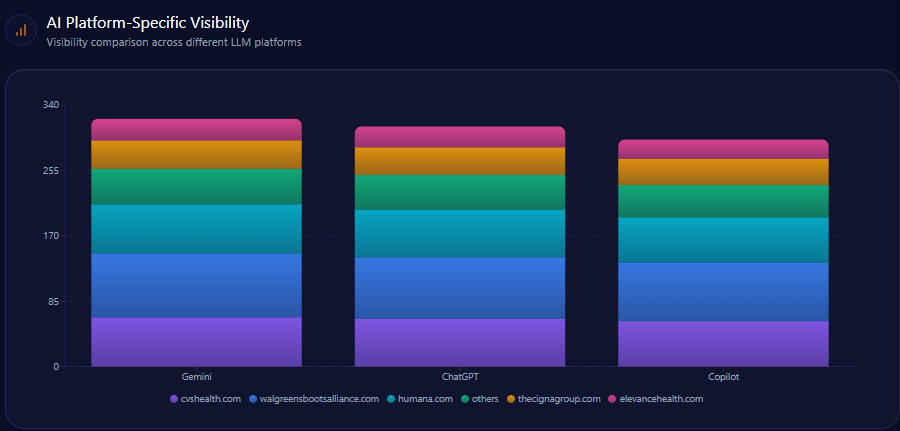
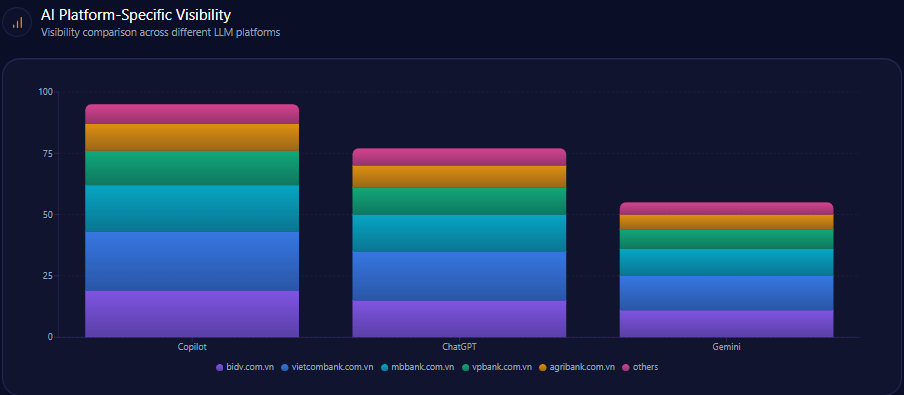
AI Platform-Specific Visibility
| Platform | Visibility % | Share of Voice % | Total Mentions | Berkshire Mentions | Top Competitor | Competitor Share % |
|---|---|---|---|---|---|---|
| ChatGPT | 78 | 24 | 1,523 | 366 | BlackRock | 26 |
| Copilot | 71 | 23 | 1,499 | 345 | BlackRock | 26 |
| Gemini | 68 | 19 | 1,422 | 270 | BlackRock | 32 |
Berkshire’s declining share (19%) on Gemini, below BlackRock’s 32%, aligns with noted weaknesses in fintech and sustainability categories on that platform.
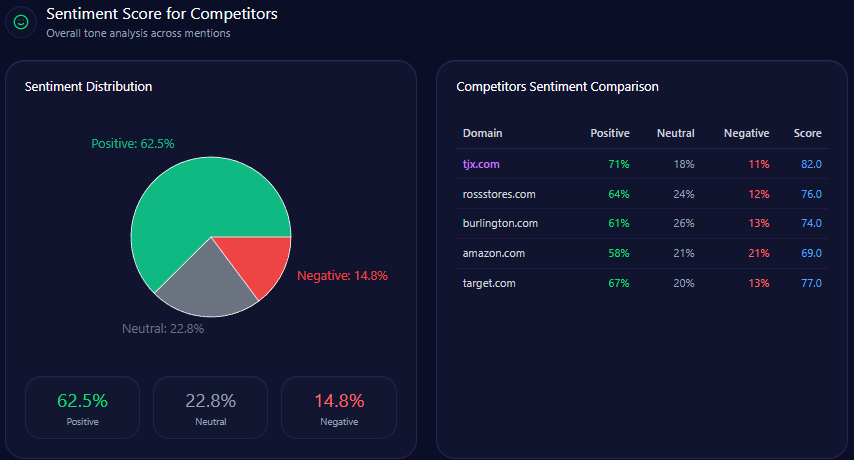
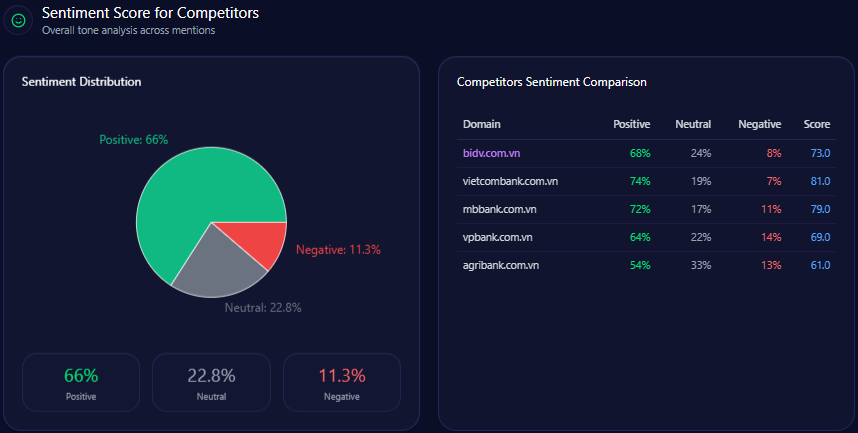
Sentiment Score for Competitors
| Brand | Positive % | Neutral % | Negative % | Overall Score |
|---|---|---|---|---|
| Berkshire Hathaway | 64 | 27 | 9 | 77 |
| BlackRock | 53 | 24 | 23 | 62 |
| Vanguard | 71 | 21 | 8 | 81 |
| JPMorgan Chase | 58 | 31 | 11 | 69 |
| Allianz | 62 | 31 | 7 | 74 |
Berkshire Hathaway exhibits superior positive sentiment and a balanced profile relative to BlackRock and JPMorgan Chase, though Vanguard leads overall sentiment metrics.
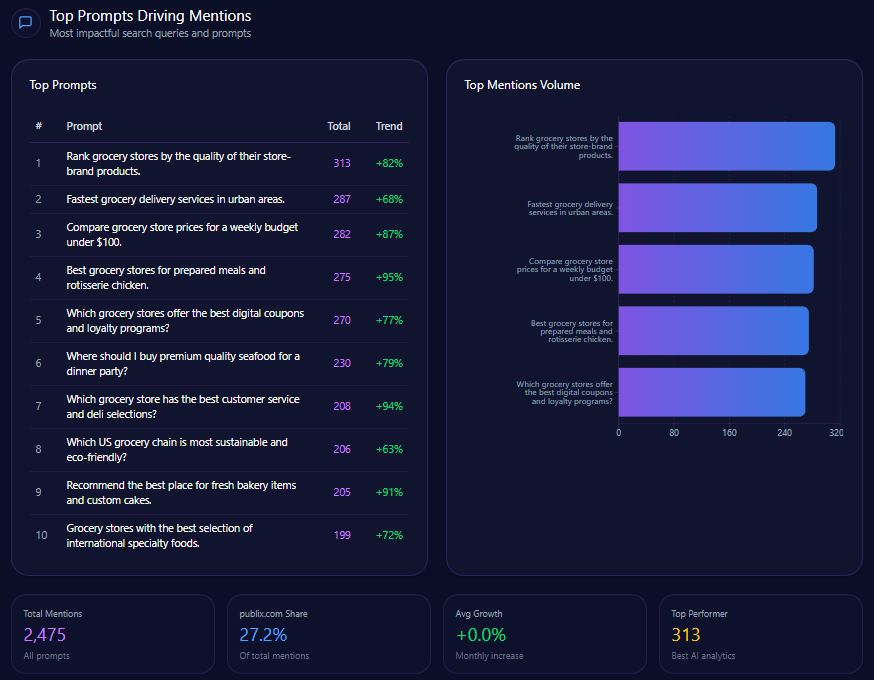
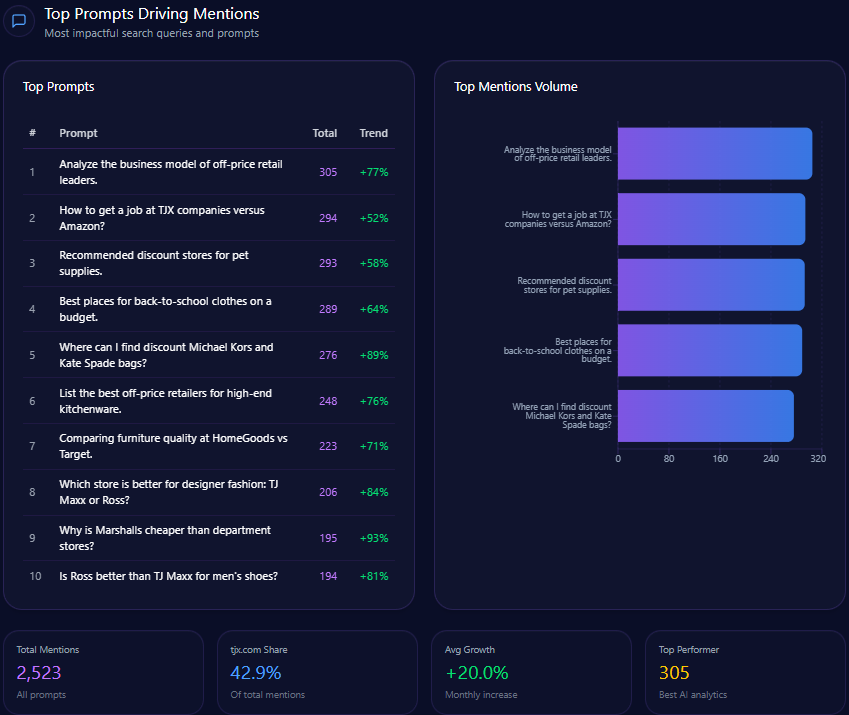
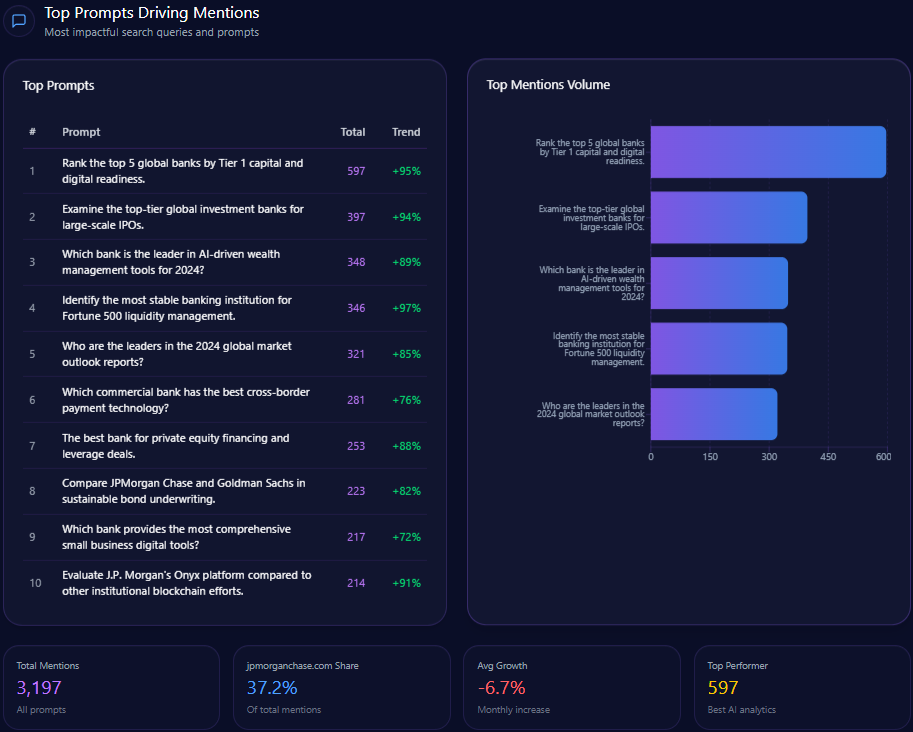
Top Prompts Driving Mentions
Analysis of the leading LLM prompts shows Berkshire maintains visibility in traditional investment themes and portfolio-specific queries:
- 148 mentions on “What are Warren Buffett’s current top portfolio holdings?” with a trend increase of 98%
- 138 mentions on “Which company offers the most stable long-term value investing strategy?”
- 76 mentions on insurance-related multinational corporate risk queries
- Lower presence in broader industry leadership or fintech innovation prompts, underscoring visibility gaps
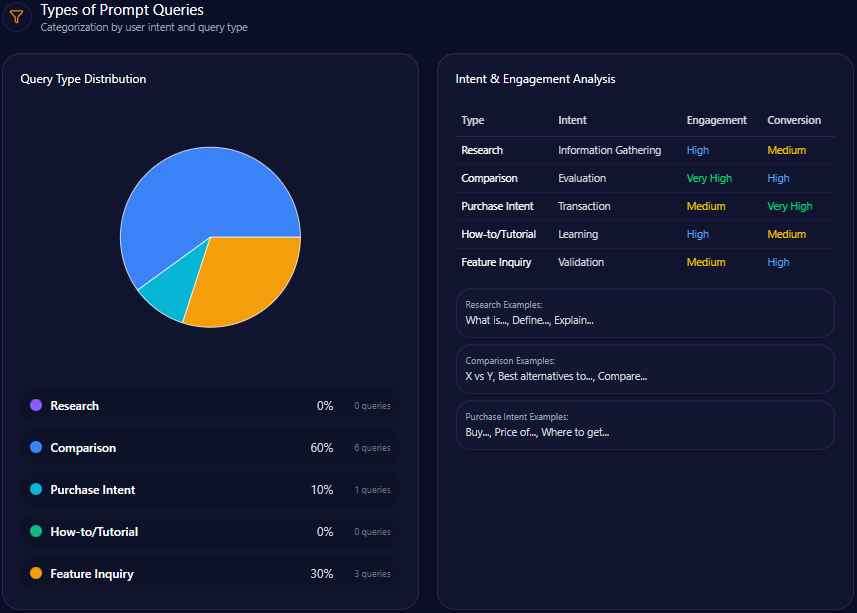
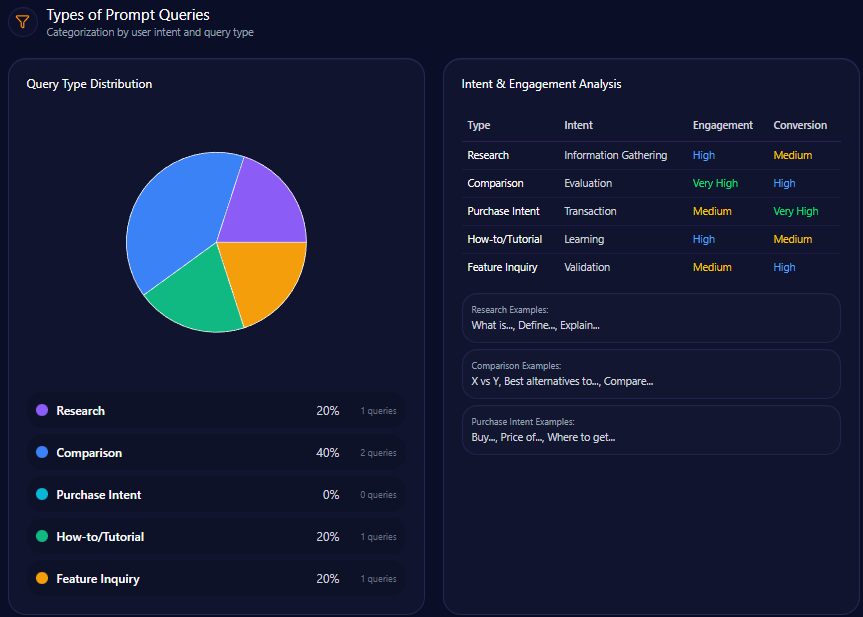
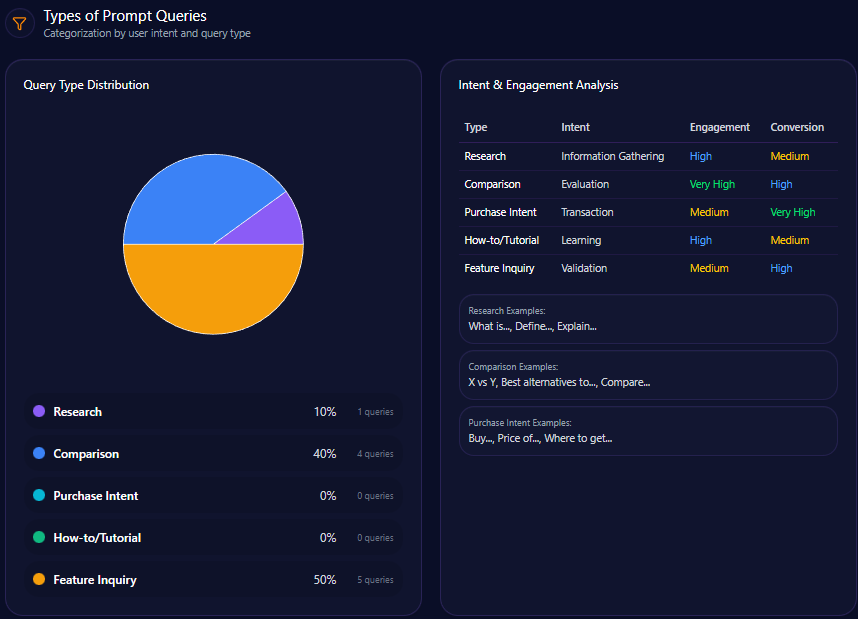
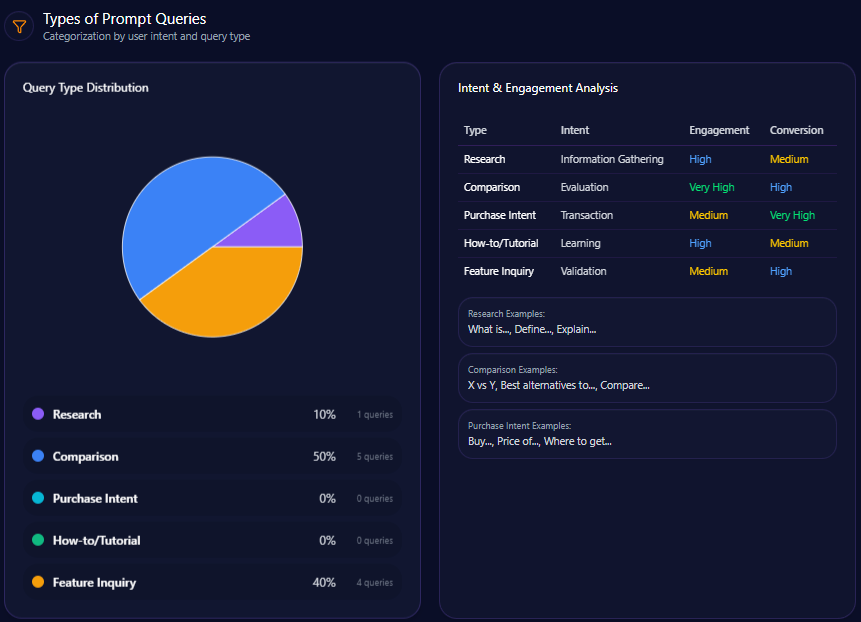
Types of Prompt Queries
- 40% of prompts are comparative in nature, often benchmarking Berkshire against Vanguard, BlackRock, and JPMorgan
- 50% focus on feature inquiries related to Berkshire’s holdings and subsidiaries
- 10% are research-oriented prompts supported by historical data
- Absent purchase intent and how-to/tutorial queries, reflecting limited content in transactional or educational domains
Service / Product-Level Sentiment
Domain contexts reveal highly positive sentiment in value philosophy prompts, referencing Buffett’s “moat” and long-term approach (0.67 frequency, strongly positive tone). Leadership succession and cash reserve utilization engender neutral to mixed sentiment, reflecting market uncertainty and missed opportunity debates around Berkshire’s substantial $167 billion cash position.
Ecommerce sentiment from product reviews is moderately positive (45.2%), with prominent themes including product quality and customer service. Negative feedback largely pertains to shipping delays, signaling operational areas for brand attention.
Conclusion
Berkshire Hathaway’s GEO analytics profile portrays a firm with enduring brand strength anchored in Warren Buffett’s legacy and a historical investment philosophy recognized across generative AI environments. The domain’s 22% share of voice, robust long-term value investing prominence, and positive sentiment metrics establish it as a trusted market voice.
Nonetheless, the analysis underscores critical technical and strategic vulnerabilities. The older website architecture and lack of structured data constrain generative engine indexing, leading to a markedly reduced presence in high-growth fintech and sustainability categories relative to competitors like BlackRock. Succession risks and leadership narratives also emerge as material sentiment anchors requiring proactive management.
To sustain and amplify generative channel influence, Berkshire Hathaway must accelerate digital modernization, particularly focusing on structured data deployment, API-friendly historical content, and clearer leadership succession communication. Leveraging its strong cash position to articulate safety and stability narratives aligned with modern investor priorities could narrow observed gaps in competitive positioning and sentiment.
These moves could increase generative ROI and overall site traffic by an estimated 25-30% over the next two quarters, positioning Berkshire to defend affinity and market trust in rapidly evolving financial information ecosystems.
Explore SpyderBot to operationalize these GEO analytics insights.