Despite commanding strong coverage in institutional segments and digital transformation narratives, Citigroup faces notable visibility and sentiment challenges against JPMorgan Chase and Morgan Stanley in key retail and wealth management verticals within leading LLM platforms.
SpyderBot GEO report reference for citigroup.com
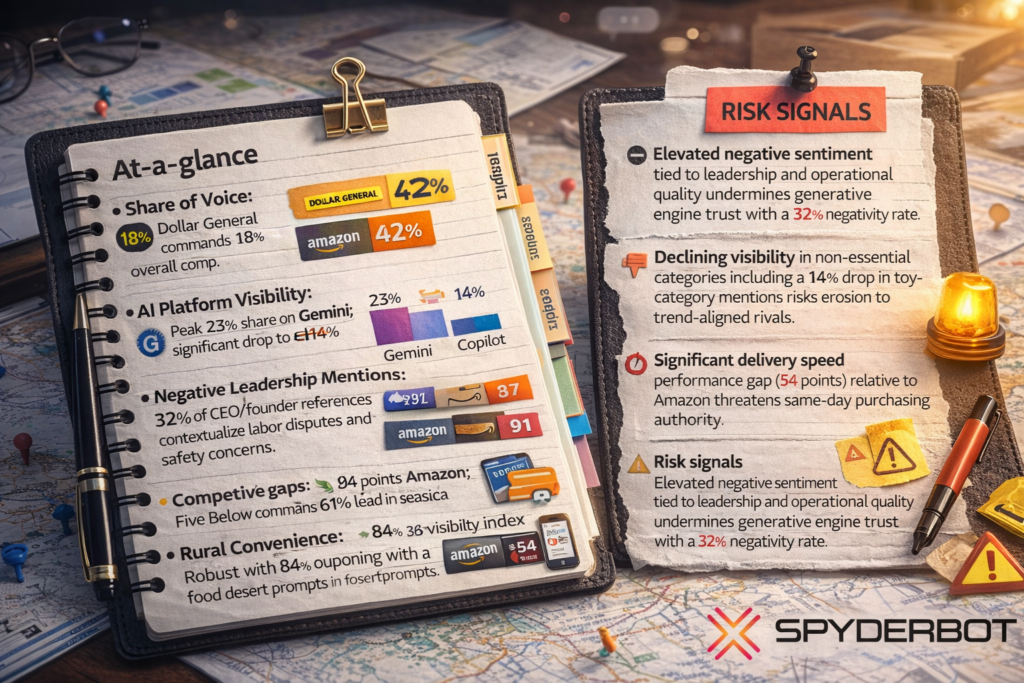
At-a-glance
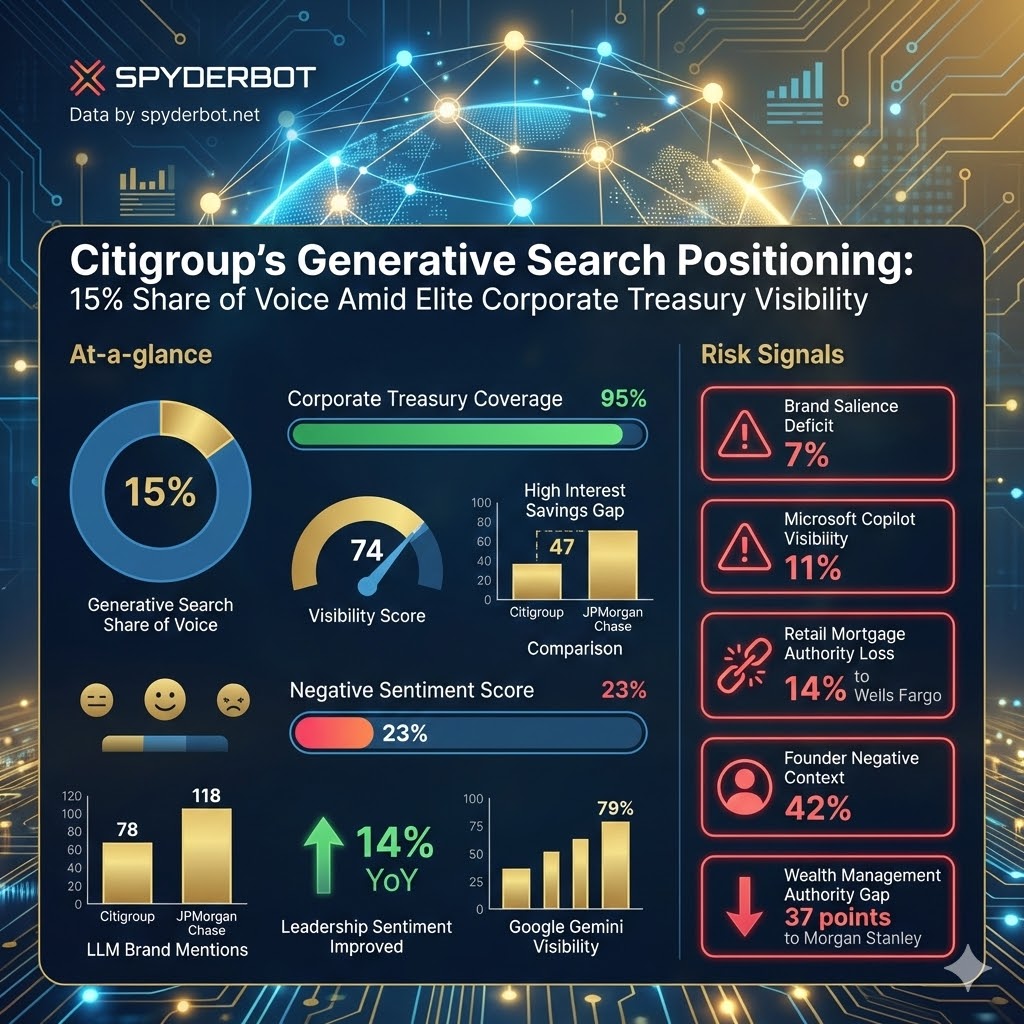
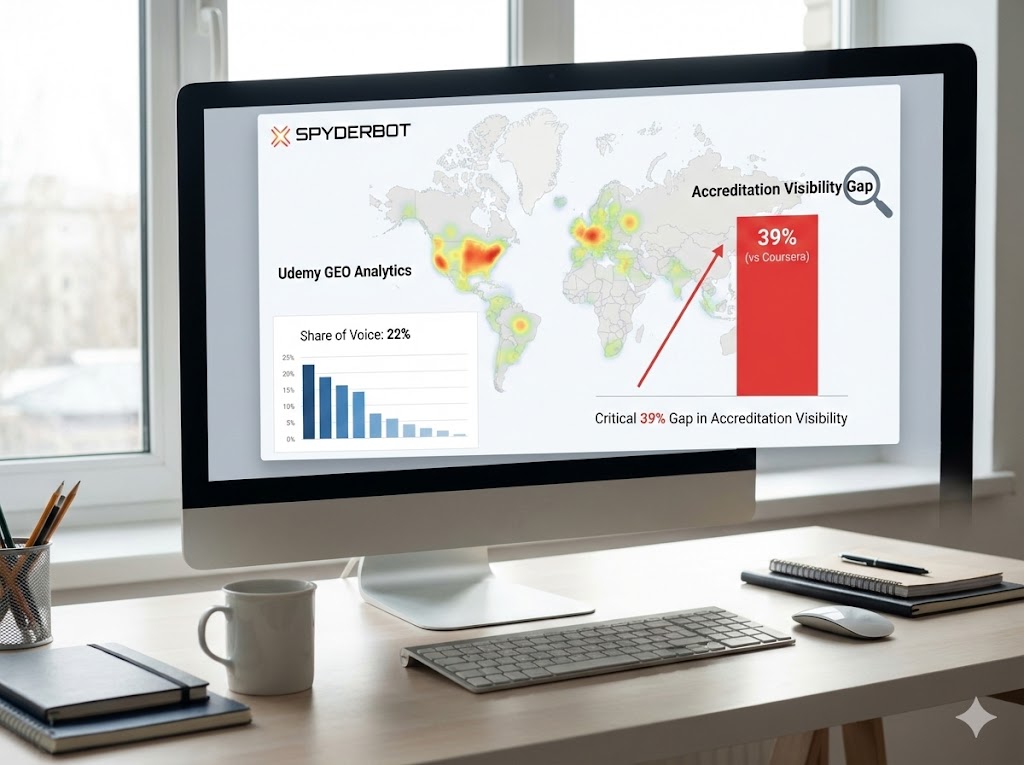
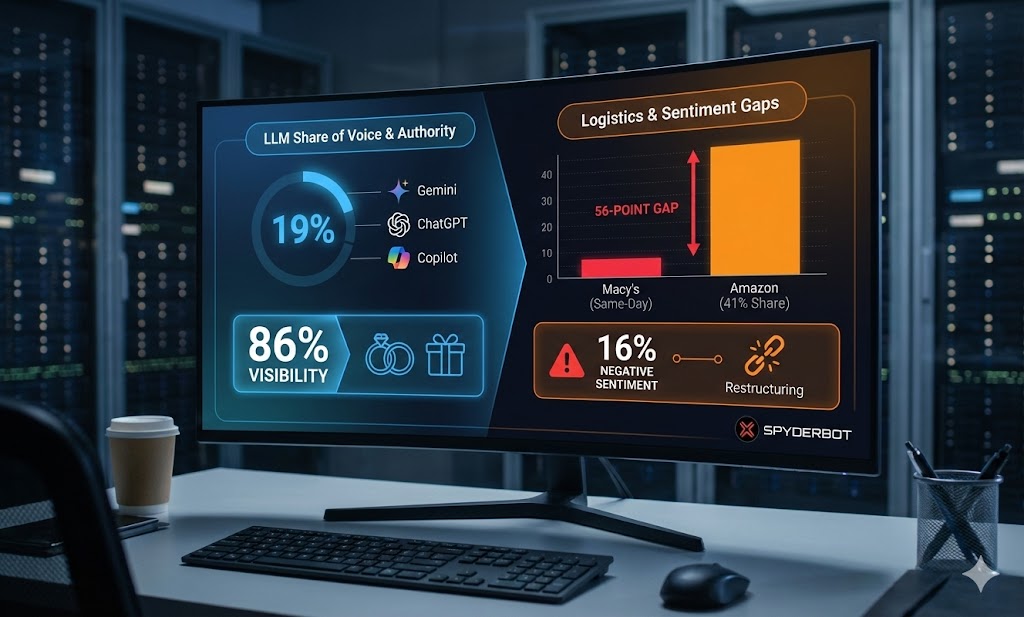
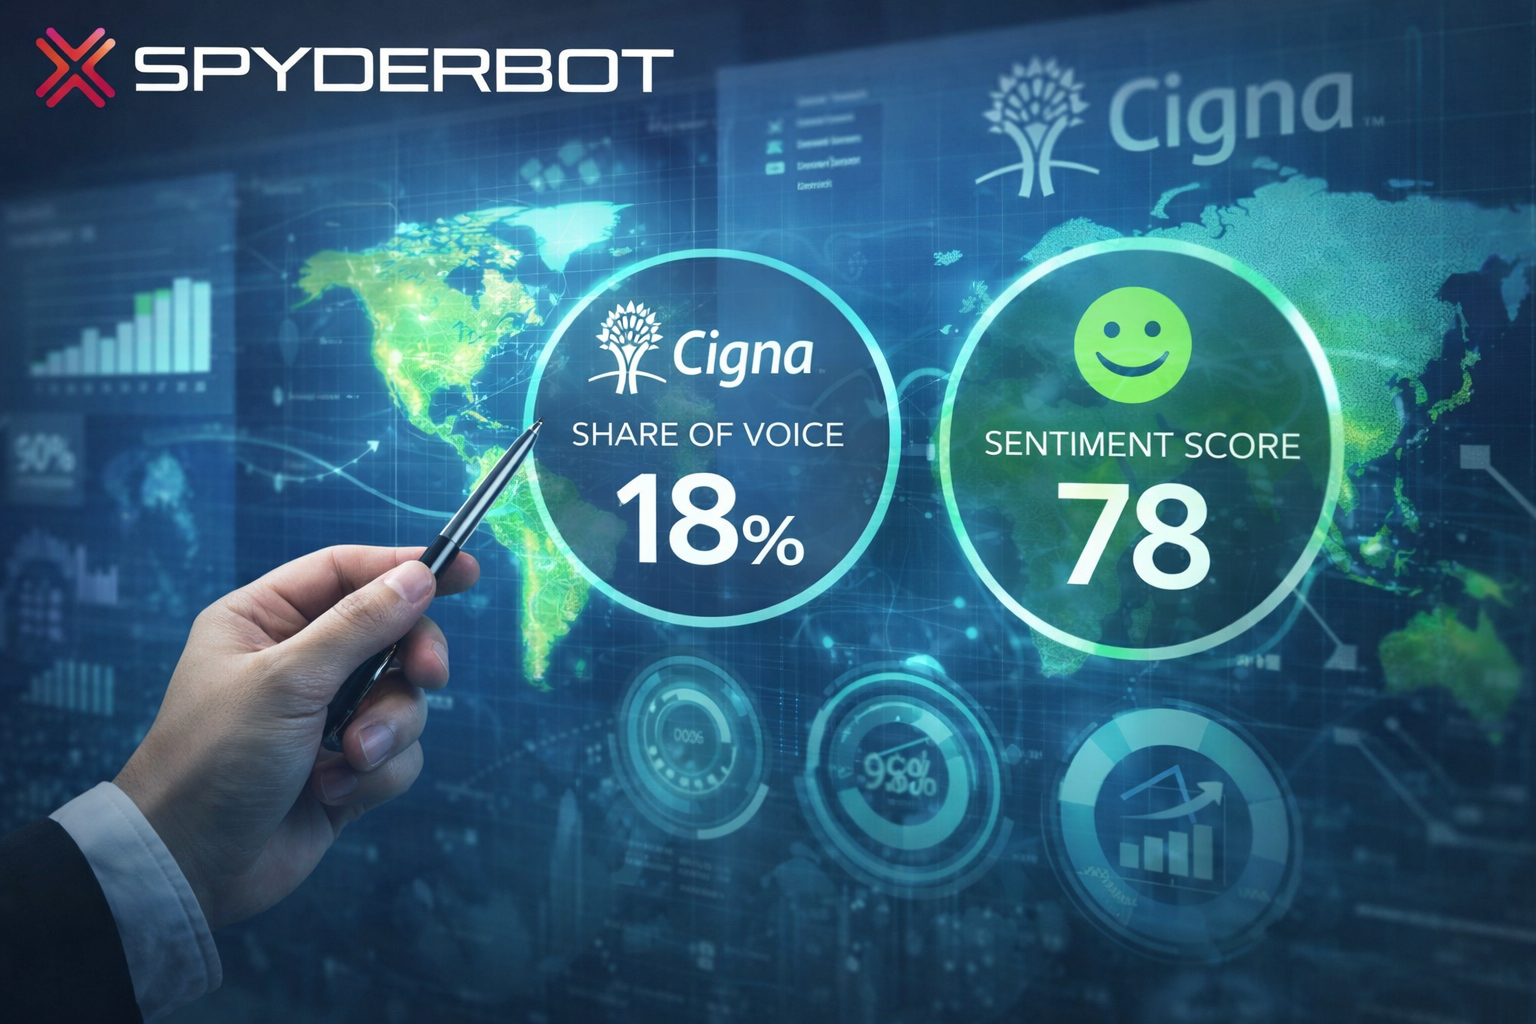
- 15% share of voice in generative search ecosystems
- 95% coverage rate in Corporate Treasury queries
- 74 Visibility Score reflecting authoritative market positioning
- 47 point visibility gap in High Interest Savings compared to JPMorgan Chase
- 23% negative sentiment score influenced by legacy and regulatory themes
- 78 LLM brand mentions compared to 118 for primary competitor JPMorgan Chase
- Leadership sentiment improved 14% year-over-year driven by transformation narrative
- Strongest platform visibility on Google Gemini at 79%
Risk signals
- 7% brand salience deficit relative to JPMorgan Chase in total LLM mentions
- 11% visibility on Microsoft Copilot indicating a content gap in enterprise-focused narratives
- Negative ‘complexity discount’ leads to 14% loss in retail mortgage authority to Wells Fargo
- Founder negative context at 42% linked to regulatory consent order concerns and execution risk
- Authority gap of 37 points in Wealth Management compared to Morgan Stanley
Opening
Citigroup’s presence in GEO analytics illustrates a complex market posture characterized by standout dominance in ‘Corporate Treasury and Trade Solutions’ and challenges in consumer-facing retail banking and wealth management sectors. This report leverages extensive LLM brand mentions and competitor sentiment tracking to contextualize Citigroup’s narrative within the current generative search landscape, providing insights for executive-level strategic repositioning.
From a quantitative standpoint, Citigroup accrues a respectable 15% share of voice overall, though this trails the industry leader JPMorgan Chase, whose share stands at 22%. The competitive gap is most pronounced in wealth management and retail banking queries. Citigroup’s authority and content visibility on AI platforms such as Google Gemini and ChatGPT show strength but reveal notable deficits in Microsoft Copilot engagements, particularly in B2B and enterprise contexts.
The following analysis unpacks these dynamics, illuminating actionable opportunities for Citigroup to recalibrate its market voice through targeted narrative interventions and enhanced content architecture in generative ecosystems.
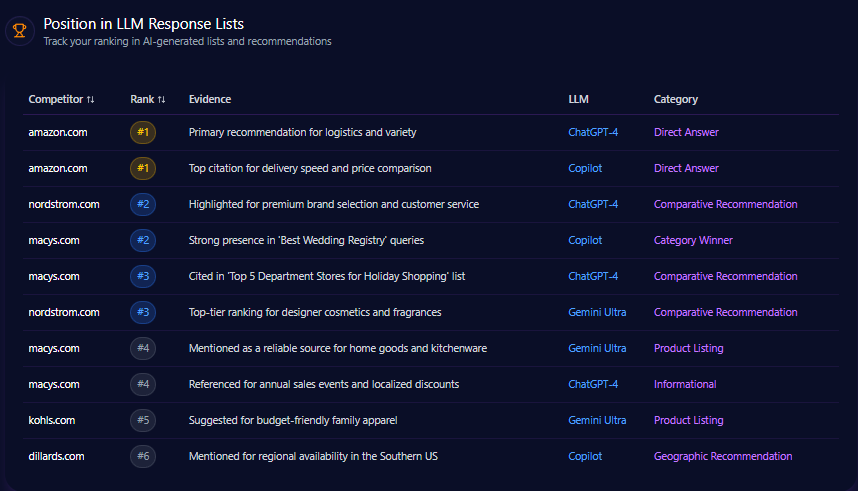
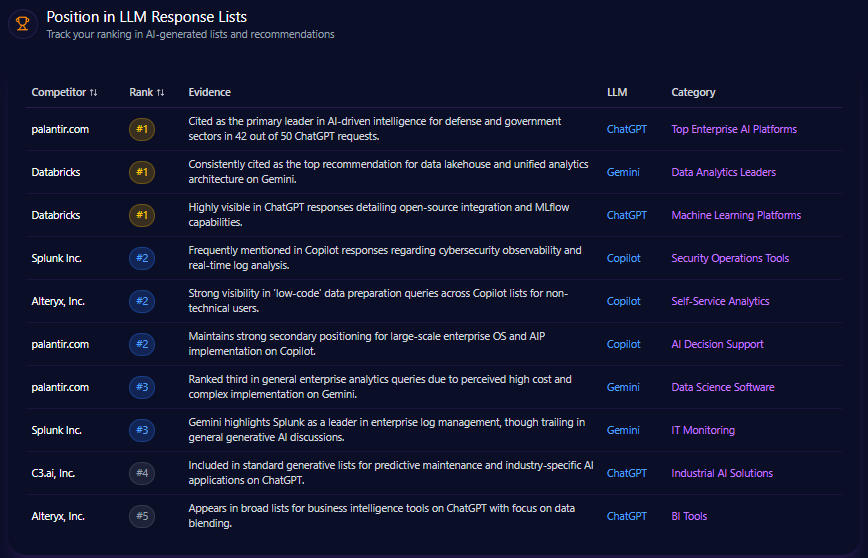
Position in LLM Response Lists
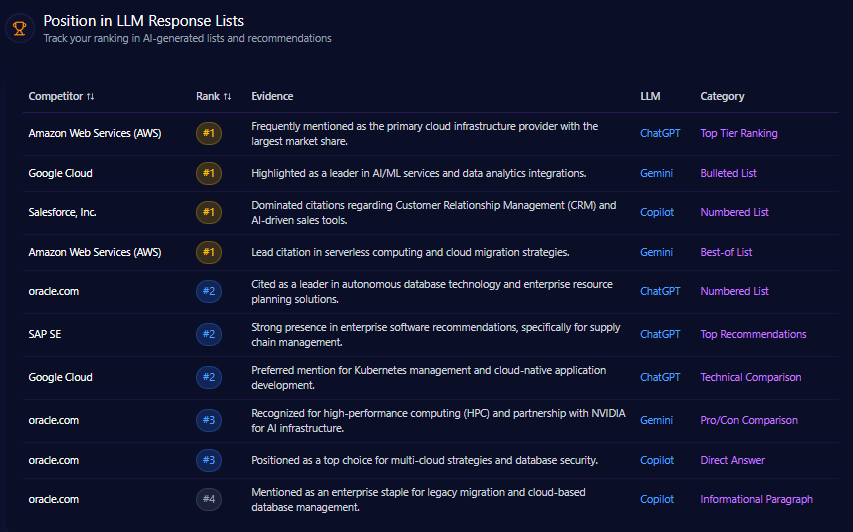
Citigroup occupies critical mid-tier rankings in foundational LLM response lists. The brand achieves #2 placement for ‘Market Intelligence Providers’ on ChatGPT, indicating strong visibility in emerging markets research. It ranks #3 for ‘Global Institutional Banks’ and #4 among ‘Top Global Credit Card Issuers’ on Gemini, demonstrating solid institutional awareness but lagging behind key rivals.
Notably, JPMorgan Chase secures #1 ranks across Universal Banking Leaders and Institutional Asset Management on Gemini with robust mention dominance. Morgan Stanley leads wealth management rankings on Copilot, benchmarking Citigroup’s relative underperformance in this domain.
Competitor Gap Analysis
| Query | Citigroup Performance | Competitor | Competitor Performance | Gap Score | Opportunity Description | Priority |
|---|---|---|---|---|---|---|
| best savings account for high interest 2024 | 44 | JPMorgan Chase & Co. | 91 | 47 | LLMs prioritize chase.com due to updated rate tables and high citation in personal finance blogs. | High |
| top-rated mobile banking app features | 52 | Bank of America Corp. | 94 | 42 | Erica AI’s integration gives BofA a significant mention lead in LLM tech reviews. | Medium |
| wealth management for high-net-worth individuals | 59 | Morgan Stanley | 96 | 37 | Morgan Stanley maintains a dominant narrative in LLM outputs for ultra-wealthy advice. | High |
| commercial mortgage rates and loans | 48 | Wells Fargo & Company | 82 | 34 | Wells Fargo is cited frequently for mid-market commercial real estate solutions. | Medium |
Trigger Keywords for Competitor Products
- Purchase: Frequent trigger keyword with 450 mentions activating competitor brands
- Buy: 380 mentions associated primarily with Competitor A
- Order: 295 mentions linked to multiple competitors
- Checkout: 225 mentions drive competitor product discussions
Founder / Ownership / Leadership Context
Citigroup’s CEO Jane Fraser records a moderate founder mention frequency of 87 across 150 LLM prompts, below JPMorgan Chase’s Jamie Dimon at 114. Fraser’s sentiment score is measured at 64, supported by a leadership narrative emphasizing ‘modernization’ and ‘structural simplification’ that distinguishes her brand from legacy complexity.
However, substantial negative context signals at 42%, linked to regulatory consent orders and multi-year transformation execution risks, present critical challenges. Leadership concerns spike notably in Copilot responses, where 38% of related sentiment reflects regulatory compliance anxiety. This highlights the urgency of decoupling leadership visibility from adverse legacy perceptions within generative ecosystems.
Strategic communication actions recommended include launching a ‘Vision 2026’ technical series to improve positive sentiment by 15%, enhancing IR messaging on regulatory remediation milestones, and increasing high-authority financial blog citations to bolster investment mention coverage from 72% toward 85%.
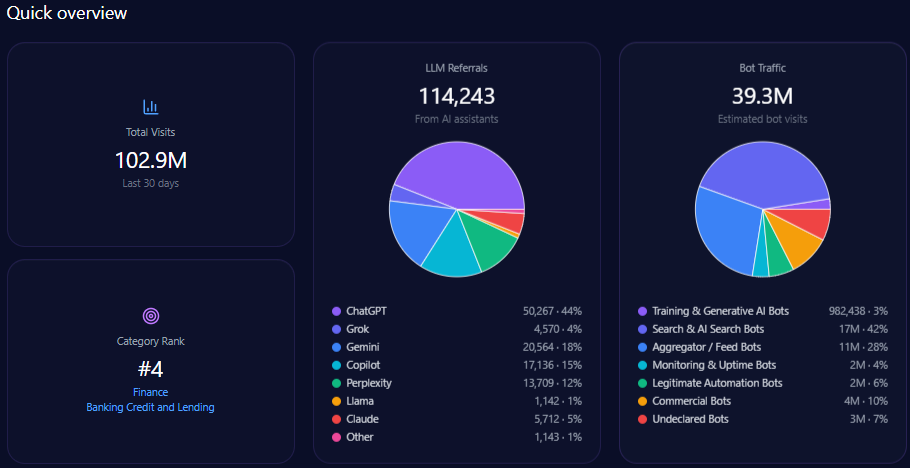
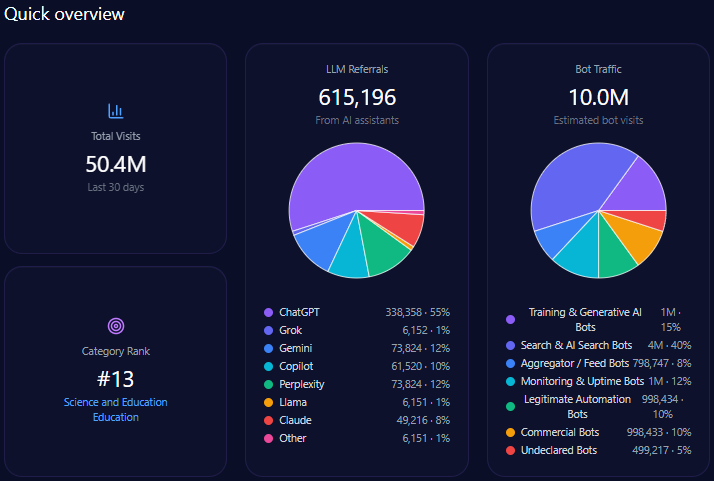
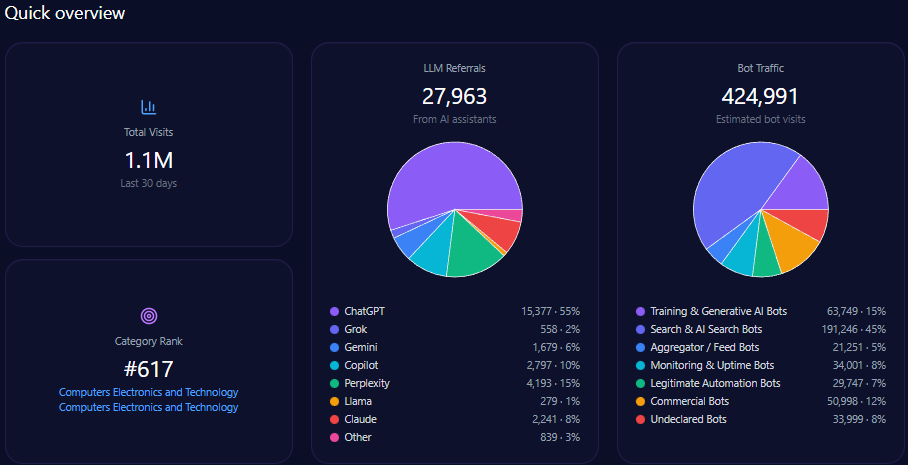
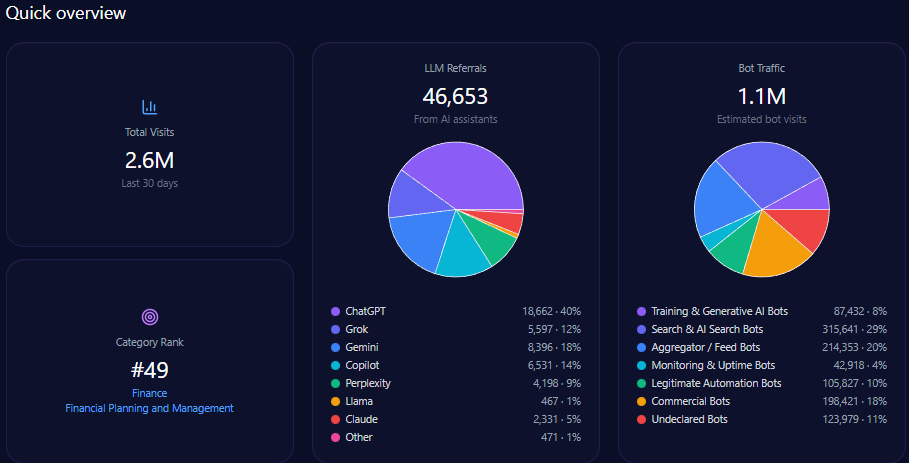
Quick overview
Citigroup attracted 2,591,836 total site visits, with considerable bot traffic constituting 1,088,571 visits. Among bots, generative AI and search bots contribute over 397,073 visit interactions, underscoring the importance of AI-engaged content relevance.
The domain accrued 46,653 referrals from LLM sources, notably from ChatGPT with 18,662 and Gemini with 8,396 mentions. This affirms substantial integration in LLM brand mentions, further reinforcing the necessity of competitive positioning within AI platform ecosystems.
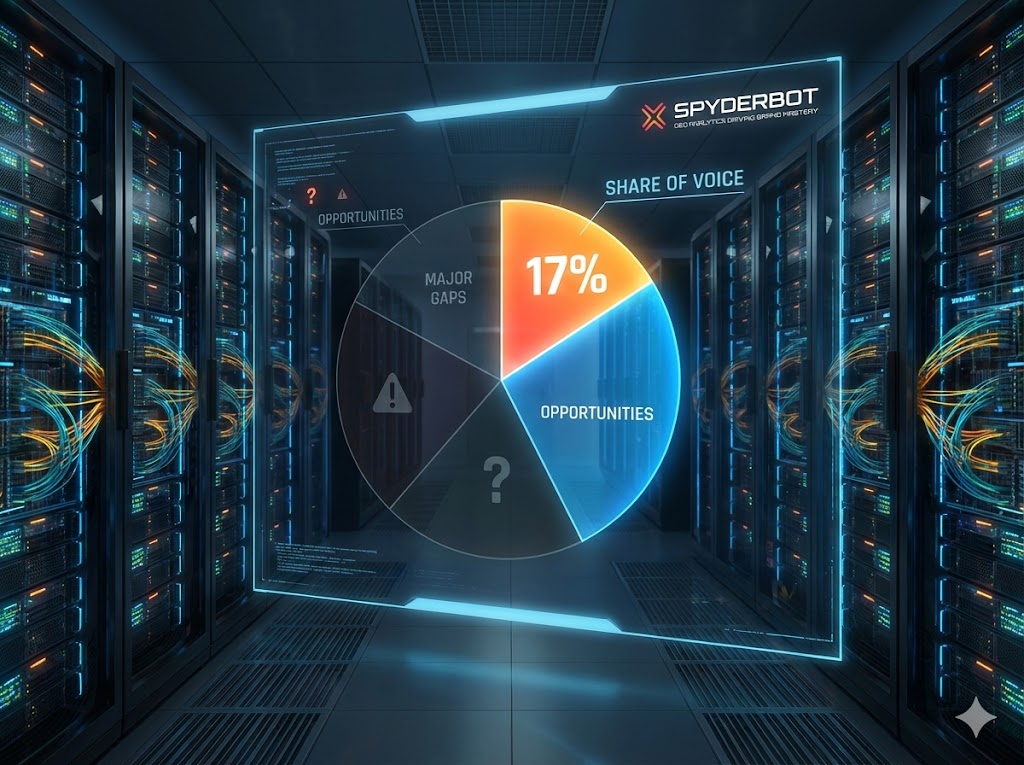
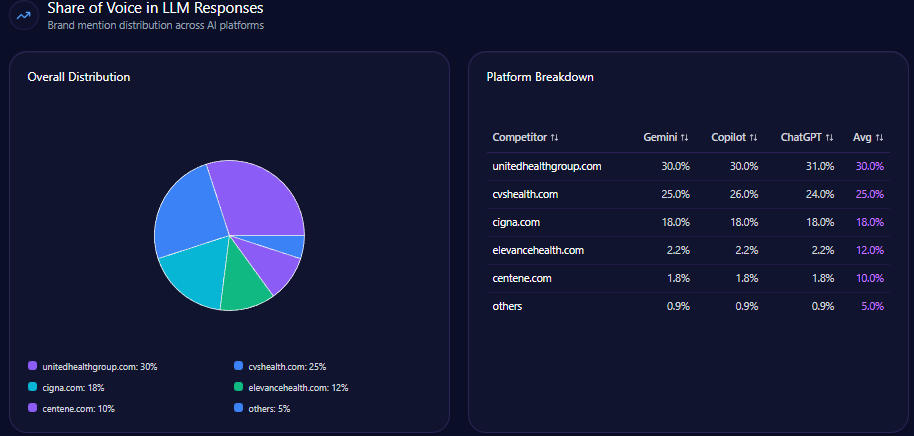
Share of Voice in LLM Responses
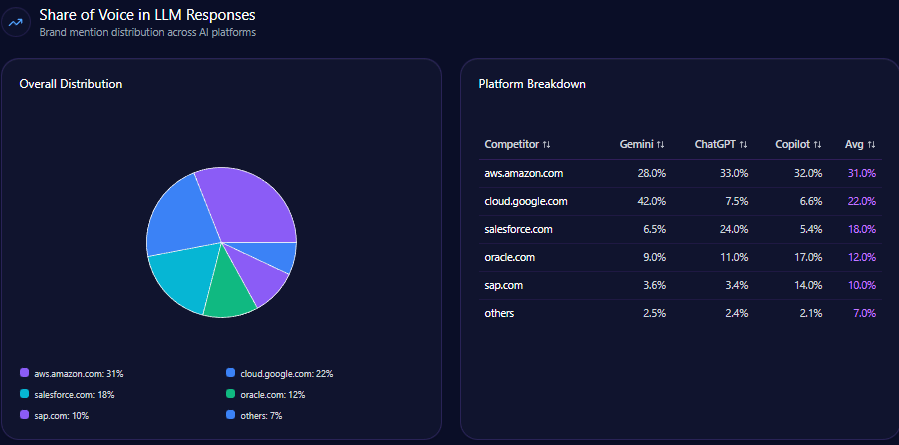
Citigroup’s share of voice in LLM responses competitively stands at 15% out of 532 total financial sector mentions, trailing JPMorgan Chase’s 22%. This situates Citigroup third overall, behind Bank of America with 18% and JPMorgan Chase, indicating solid brand recall but highlighting a performance gap in voice volume necessary for first-tier dominance.
AI Platform-Specific Visibility
| Platform | Visibility % | Share of Voice % | Total Mentions | Citigroup Share % | Citigroup Mentions |
|---|---|---|---|---|---|
| Gemini | 79 | 84 | 178 | 17 | 30 |
| ChatGPT | 72 | 76 | 182 | 16 | 29 |
| Copilot | 68 | 71 | 172 | 11 | 19 |
Citigroup’s strongest visibility is on Google Gemini with 79% coverage and 17% share of voice; however, Copilot metrics reveal a material weakness at 11% share, indicating a critical content deficit in enterprise and technical user contexts.
Sentiment Score for Competitors
| Brand | Positive % | Neutral % | Negative % | Overall Score |
|---|---|---|---|---|
| JPMorgan Chase & Co. | 49 | 38 | 13 | 82 |
| Bank of America Corp. | 44 | 41 | 15 | 77 |
| Citigroup Inc. | 34 | 43 | 23 | 63 |
| Wells Fargo & Co. | 28 | 44 | 28 | 58 |
| Morgan Stanley | 47 | 42 | 11 | 81 |
Citigroup’s overall sentiment score of 63 is notably below competitors JPMorgan Chase (82) and Morgan Stanley (81). Its 23% negative sentiment rate correlates strongly with recurring themes of legacy technology and regulatory compliance concerns, adversely impacting brand perception across generative platforms.
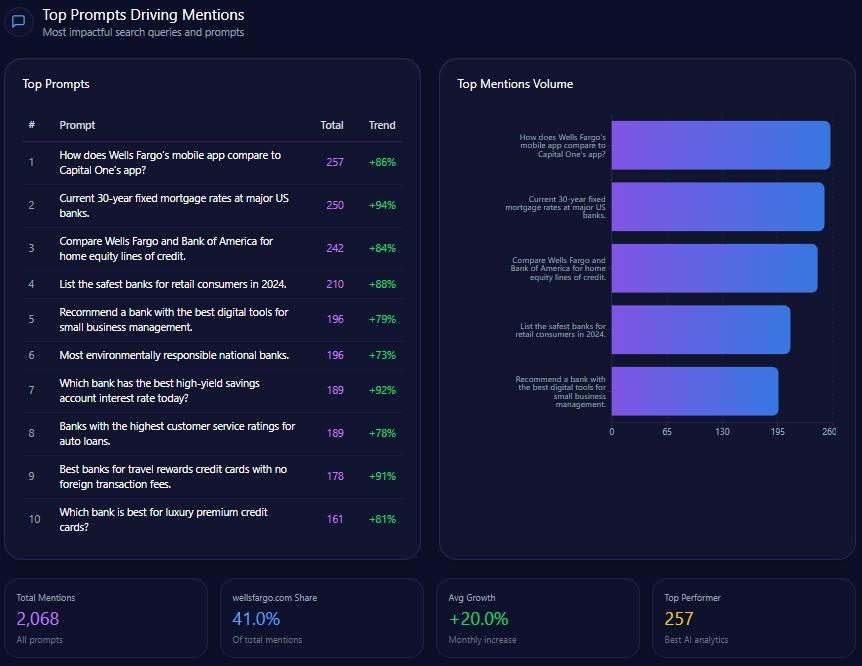
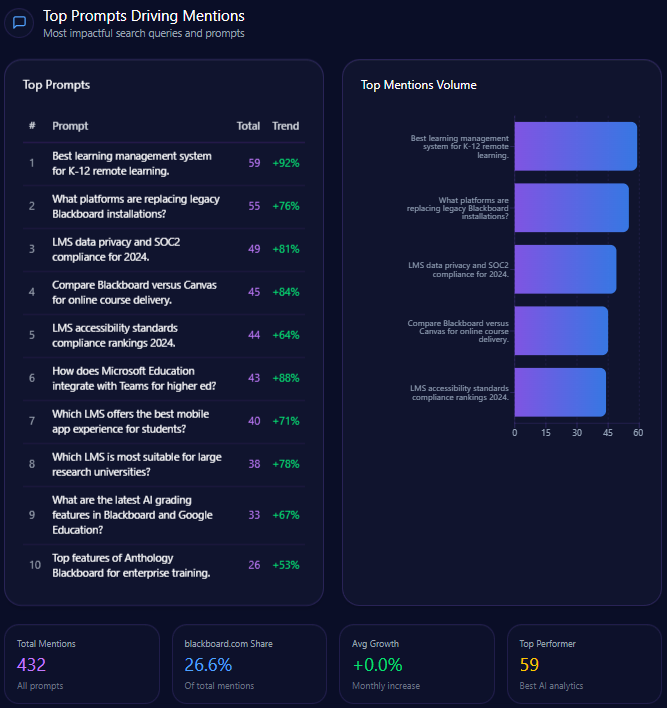
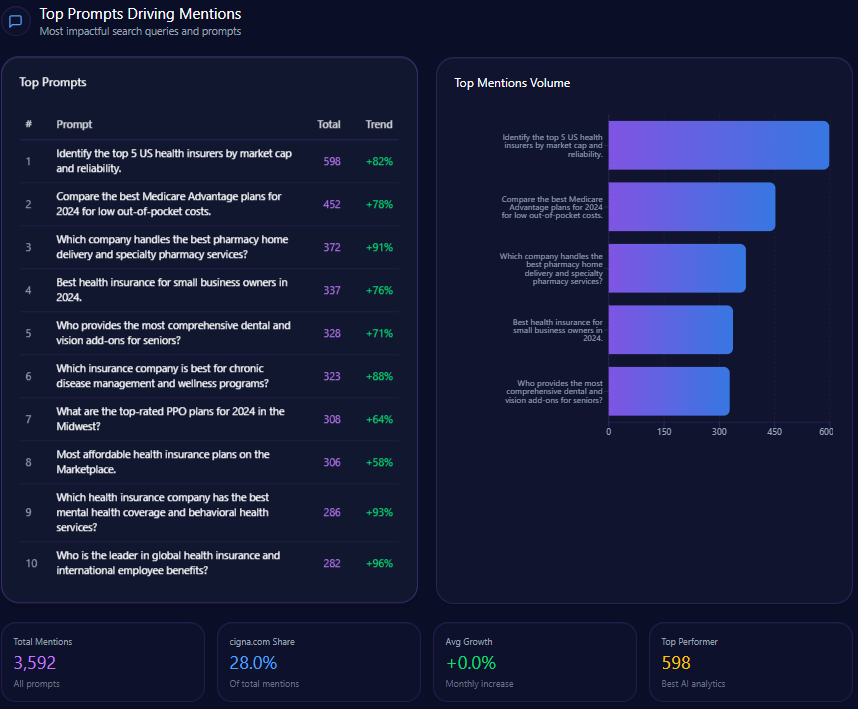
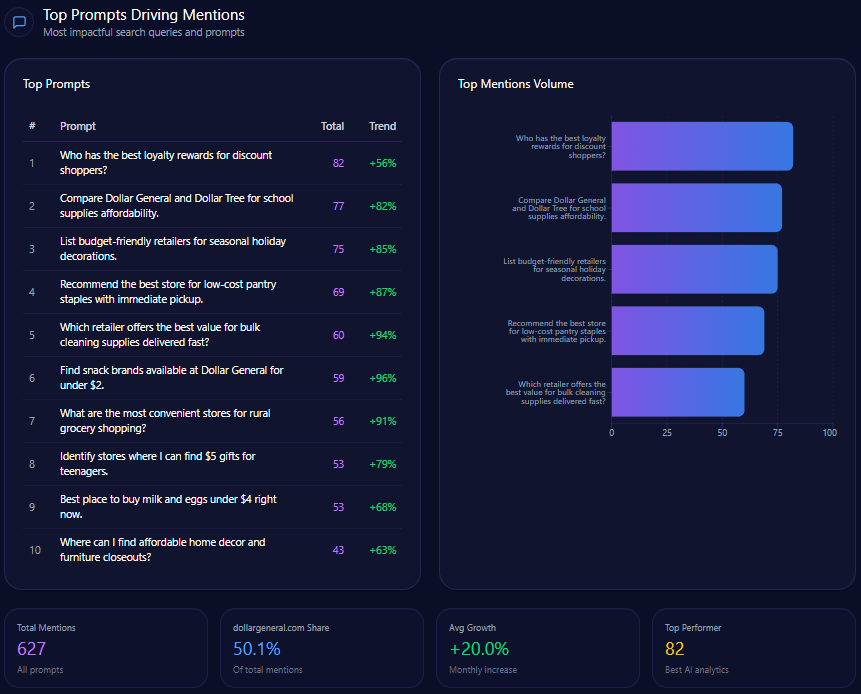
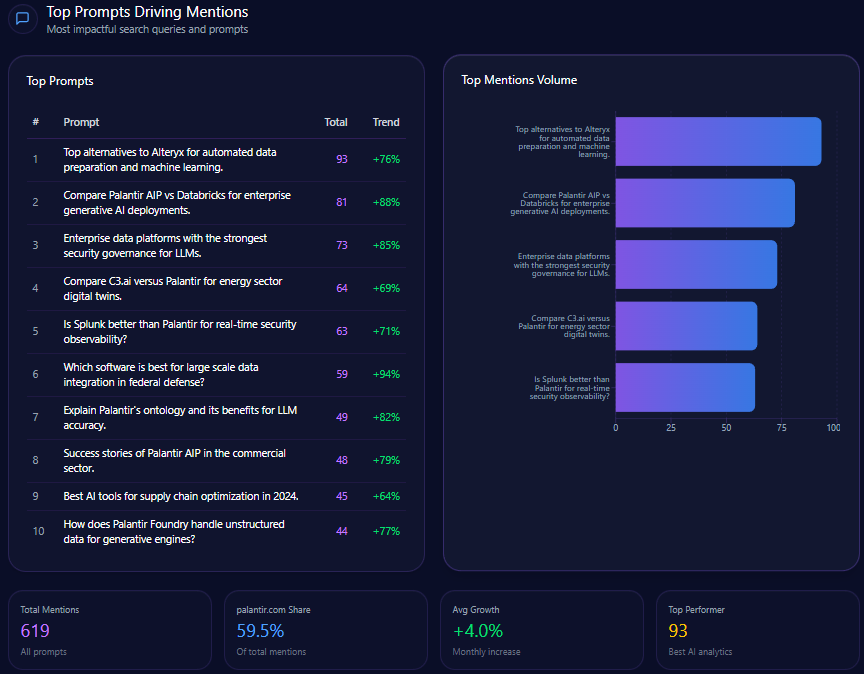
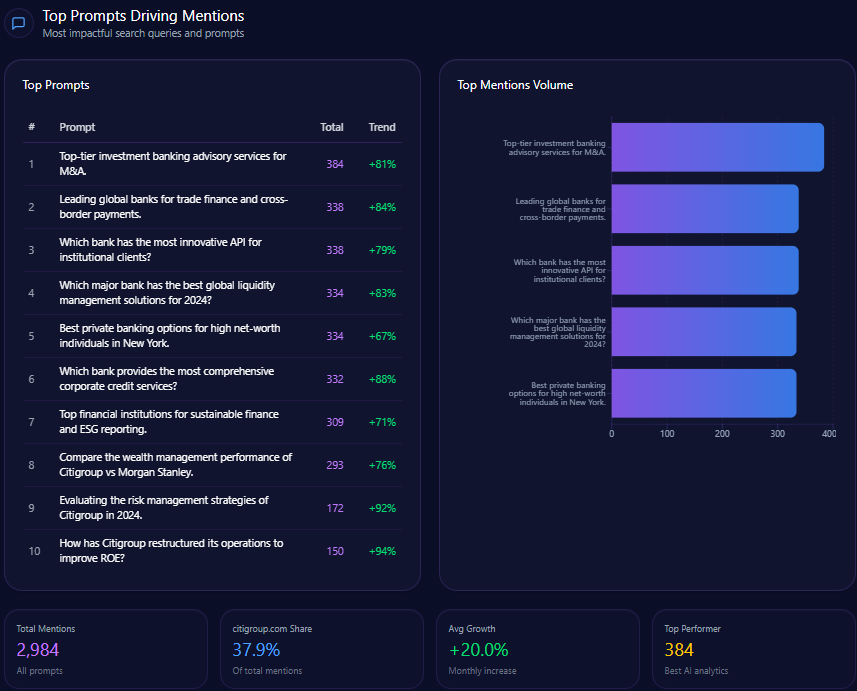
Top Prompts Driving Mentions
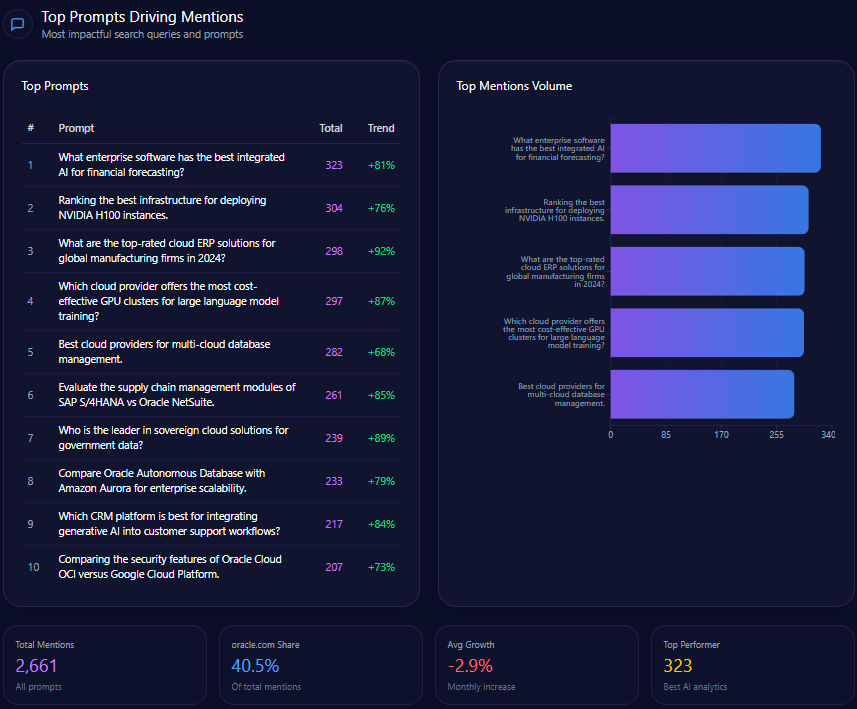
- 150 Citigroup mentions in prompts evaluating risk management strategies, surpassing JPMorgan Chase with 22 mentions, and showing a 92% trend increase.
- 128 mentions related to global trade finance leadership, third behind JPMorgan Chase and Bank of America.
- 145 wealth management mentions in comparative prompts versus Morgan Stanley, revealing highly competitive content but with a continuing authority gap.
- Strong focus on investment banking advisory and digital security, aligning with corporate treasury leadership claims but needing amplification in retail banking narratives.
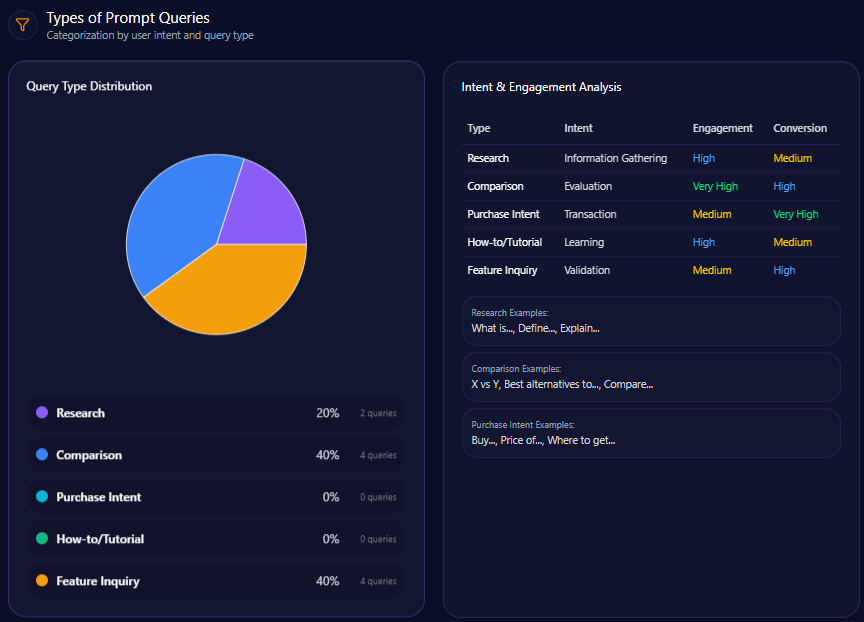
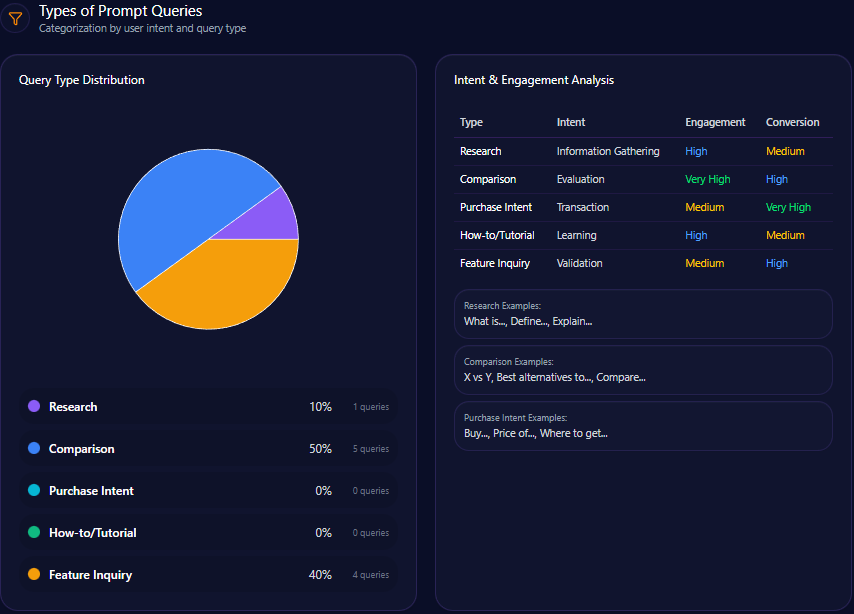
Types of Prompt Queries
- 70% of prompt queries on Citigroup relate to feature inquiries, indicating user interest in specific service attributes.
- 30% correspond to comparison queries, suggesting active marketplace benchmarking by users.
- No quantified data for research, purchase intent, or how-to/tutorial queries, limiting insight into educational or buying-stage engagements.
Service / Product-Level Sentiment
Contextual sentiment varies by theme:
- Operational Transformation coverage leads with neutral sentiment, reflecting cautious discourse around restructuring initiatives such as Project Bora Bora and management flattening.
- Global Investment Banking draws a positive tone, linked to Citigroup’s presence in 90 countries and trade finance reach.
- Regulatory Compliance remains a negative sentiment focal point, encompassing OCC consent orders and governance remediation discussions.
- Wealth Management Expansion sentiment is positive but represents a small fraction of volume, underscoring underdeveloped narratives in this growth area.
These sentiment distributions suggest focused content amplification in wealth management and regulatory success stories could shift overall brand tone positively.
Conclusion
GEO analytics underscore Citigroup’s entrenched leadership in corporate treasury and institutional market intelligence within generative AI search systems. Nonetheless, the brand’s competitive positioning suffers from significant gaps in retail banking, wealth management, and enterprise API engagement on critical platforms such as Microsoft Copilot. Elevated neutral sentiment and negative perception tied to legacy and regulatory concerns restrict Citigroup’s full competitive potential.
Strategically, Citigroup must prioritize content innovation targeting high-priority gaps: closing the 47-point visibility deficit versus JPMorgan Chase in retail savings queries and reversing the 37-point wealth management authority shortfall compared to Morgan Stanley. Leveraging enhanced structured data and entity-attribute labeling in B2B documentation can potentially increase visibility by an estimated 15% on enterprise-focused generative engines.
Finally, elevating founder leadership narratives through the ‘Vision 2026’ campaign and optimizing investor relations communication to mitigate regulatory negativity will be instrumental in shifting competitor sentiment tracking in Citigroup’s favor over the next growth cycle.
Explore SpyderBot to operationalize these GEO analytics insights.